HAL Id: hal-00301097
https://hal.archives-ouvertes.fr/hal-00301097
Submitted on 15 Mar 2005HAL is a multi-disciplinary open access
archive for the deposit and dissemination of sci-entific research documents, whether they are pub-lished or not. The documents may come from teaching and research institutions in France or abroad, or from public or private research centers.
L’archive ouverte pluridisciplinaire HAL, est destinée au dépôt et à la diffusion de documents scientifiques de niveau recherche, publiés ou non, émanant des établissements d’enseignement et de recherche français ou étrangers, des laboratoires publics ou privés.
NO2 and HCHO photolysis frequencies from irradiance
measurements in Thessaloniki, Greece
C. Topaloglou, S. Kazadzis, A. F. Bais, M. Blumthaler, B. Schallhart, D. Balis
To cite this version:
C. Topaloglou, S. Kazadzis, A. F. Bais, M. Blumthaler, B. Schallhart, et al.. NO2 and HCHO photolysis frequencies from irradiance measurements in Thessaloniki, Greece. Atmospheric Chemistry and Physics Discussions, European Geosciences Union, 2005, 5 (2), pp.1619-1646. �hal-00301097�
ACPD
5, 1619–1646, 2005 NO2 and HCHO photolysis frequencies C. Topaloglou et al. Title Page Abstract Introduction Conclusions References Tables Figures J I J I Back CloseFull Screen / Esc
Print Version Interactive Discussion
EGU
Atmos. Chem. Phys. Discuss., 5, 1619–1646, 2005 www.atmos-chem-phys.org/acpd/5/1619/
SRef-ID: 1680-7375/acpd/2005-5-1619 European Geosciences Union
Atmospheric Chemistry and Physics Discussions
NO
2
and HCHO photolysis frequencies
from irradiance measurements in
Thessaloniki, Greece
C. Topaloglou1, S. Kazadzis1, A. F. Bais1, M. Blumthaler2, B. Schallhart2, and D. Balis1
1
Laboratory of Atmospheric Physics, Aristotle University of Thessaloniki, Greece 2
Division for Biomedical Physics, Innsbruck Medical University, Austria
Received: 9 February 2005 – Accepted: 8 March 2005 – Published: 15 March 2005 Correspondence to: C. Topaloglou (ctopa@skiathos.physics.auth.gr)
ACPD
5, 1619–1646, 2005 NO2 and HCHO photolysis frequencies C. Topaloglou et al. Title Page Abstract Introduction Conclusions References Tables Figures J I J I Back CloseFull Screen / Esc
Print Version Interactive Discussion
EGU Abstract
An empirical approach for the retrieval of nitrogen dioxide (NO2) and formaldehyde (HCHO) photolysis frequencies from measurements of global irradiance is presented in this work. Four months of synchronous measurements of actinic flux and global irra-diance performed in Thessaloniki, Greece by a Bentham spectroradiometer were used 5
to extract polynomials for the conversion of global irradiance to photolysis frequencies [(NO2) and J (HCHO)]. The comparison of these photolysis frequency values to the corresponding values calculated by spectral actinic flux measurements, showed a ratio very close to unity for all J ’s with a standard deviation of 6% for J (NO2) and 3% for
J (HCHO). Additional sets of polynomials were also extracted to allow determination
10
of J (NO2) by spectroradiometers with lower upper wavelength limits such as single and double Brewer spectroradiometers within acceptable uncertainty (corresponding ratio was 1 and standard deviation was 6% for double and 10% for single Brewers). The validity of the method under different atmospheric conditions was also examined by applying the polynomials to another set of actinic flux and global irradiance mea-15
surements performed in May 2004, in Buchhofen, Germany. In this case, comparing
J values extracted from the polynomials to those calculated from actinic flux, showed
equivalent results, demonstrating that the method can also be applied to other mea-surement sites.
1. Introduction
20
The photodissociation of trace gases in the atmosphere is a process of great impor-tance for atmospheric chemistry. Solar ultraviolet radiation drives the photolysis of sev-eral species, such as NO2and HCHO, contributing to their decomposition and removal from the atmosphere as well as the formation of highly reactive radicals. Photodis-sociation is the dominant loss process for NO2 (Eq. 1), producing O(3P) atoms which 25
ACPD
5, 1619–1646, 2005 NO2 and HCHO photolysis frequencies C. Topaloglou et al. Title Page Abstract Introduction Conclusions References Tables Figures J I J I Back CloseFull Screen / Esc
Print Version Interactive Discussion
EGU
(1) is oxidized back to NO2, consuming ozone in this case (Eq. 3), see e.g. He and Charmichael, (1999):
NO2+ h.ν(λ ≤ 420 nm) → O(3P)+ NO (1)
O(3P)+ O2+ M → O3+ M (2)
O3+ NO → O2+ NO2. (3)
5
The NO2 photodissociation process itself as well as the NO-NO2 equilibrium in the NOx, (also influenced by NO2 photolysis) are closely related to the radical cycles of OH and HO2 (Kraus et al., 2000) and are an important parameter for tropospheric ozone concentrations.
Formaldehyde is one of the most important and abundant organic carbonyl com-10
pounds in the atmosphere, observed in both polluted urban and rural environments. It is mainly produced from fossil fuel combustion and is also a secondary product of photochemical oxidation of methane and other hydrocarbons (Meller and Moortgat, 2000). The processes (Eq. 4) and (Eq. 5) presented below achieve the photolysis of formaldehyde:
15
HCHO+ h.ν→ H+ HCO(λ ≤ 330 nm) (4)
HCHO+ h.ν→ H2+ CO(λ ≤ 361 nm). (5)
The photolysis of formaldehyde plays a significant role in the formation of photo-chemical smog, through the generation of HO2 radicals which participate in O3c at-alytic production (Smith et al., 2002). Both H and HCO produced from Eq. (4), yield 20
HO2radicals as shown in chemical reactions presented in Eqs. (6) and (7):
H+ O2+ M → HO2+ M (6)
ACPD
5, 1619–1646, 2005 NO2 and HCHO photolysis frequencies C. Topaloglou et al. Title Page Abstract Introduction Conclusions References Tables Figures J I J I Back CloseFull Screen / Esc
Print Version Interactive Discussion
EGU
It is therefore of considerable importance for atmospheric chemistry to accurately de-termine the photolysis rates of key atmospheric compounds such as NO2and HCHO. In the past, chemical actinometers and filter radiometers have been used to measure
J (NO2) (e.g. Dickerson et al., 1982; Shetter et al., 1992; Lantz et al., 1996; Balis et al., 2002, Shetter at al., 2003). Similar measurements for other photolysis rates such 5
as J (HCHO), were not as common as in the case of NO2 or O3, due to considerable requirements concerning the development and maintenance of these instruments, so those rates were either estimated or modeled (Kraus and Hofzumahaus, 1998). In the last decade, spectroradiometric measurements of actinic flux have developed enabling the determination of photolysis rates for several atmosperic species as the integral: 10 J= λ2 Z λ1 F (λ)σ(λ, T )ϕ(λ, T )d λ , (8)
where σ(λ, T is the absorption cross section of the molecule, φ(λ, T the photodis-sociation quantum yield, (both dependant on wavelength and temperature) and F (λ) the spectral actinic flux. Photolysis rate determination by means of spectroradiometry has been reported in the last decade for both NO2 (McElroy et al., 1995; Kraus and 15
Hofzumahaus, 1998; Shetter and M ¨uller, 1999; Edwards and Monks, 2003, Shetter et al., 2003) and formaldehyde (Kraus and Hofzumahaus, 1998; Shetter and M ¨uller, 1999). However, since actinic flux measurements are not trivial, several approaches have been developed in order to enable the use of global irradiance instead of actinic flux for photolysis rate determination. Previous work includes the transformation of 20
global irradiance to actinic flux (Cott ´e et al., 1997; Kazadzis et al., 2000; Webb et al., 2002; Kylling et al., 2003; Schallhart et al., 2004) which can then be used for photolysis rate determination, as well as empirical methods to derive photolysis rates directly from global irradiance measurements (McKenzie et al., 2002; Kazadzis et al., 2004; Seroji et al., 2004).
25
This work presents an empirical method to determine photolysis rate values for NO2 and HCHO from measurements of global irradiance from a Bentham
spectroradiome-ACPD
5, 1619–1646, 2005 NO2 and HCHO photolysis frequencies C. Topaloglou et al. Title Page Abstract Introduction Conclusions References Tables Figures J I J I Back CloseFull Screen / Esc
Print Version Interactive Discussion
EGU
ter. First, the variability of actinic flux to global ratio as a function of solar zenith angle (sza) is discussed. Then the empirical method is presented in detail and is imple-mented on global irradiance data. The photolysis frequency values produced by the method are compared to corresponding values derived from measured actinic flux. Additional polynomials are extracted using global irradiance at wavelengths suitable 5
for the use of Brewer spectroradiometer measurements. The results comparing J val-ues derived from this method to those calculated from actinic flux are presented for all cases. Finally, the performance of the method applied to measurements from a different measurement site is examined, showing satisfactory results.
2. Data and instrumentation
10
The UV global irradiance and actinic flux spectra used in this study to extract the polynomials for the empirical method were measured by a Bentham DTM 300 (Di-vision for Biomedical Physics, Innsbruck Medical University), installed at the roof of the Physics Department in Thessaloniki, at the Laboratory of Atmospheric Physics (LAP) from March to July 2003. The instrument performed synchronous measure-15
ments of actinic flux and global irradiance from 290 to 500 nm, in the framework of the INSPECTRO project (Influence of clouds on the Spectral actinic flux in the lower Troposphere, http://imk-ifu.fzk.de/inspectro/index.html). In addition, a double-monochromator Brewer MKIII spectroradiometer provided UV spectral global irradi-ance measurements in the range of 287–366 nm. Finally, total irradiirradi-ance from a Kipp 20
and Zonnen CM21 pyranometer was used to enable cloud flagging of the spectra. Dur-ing the INPSECTRO project the Bentham instrument also measured actinic and global irradiance at Buchhofen, Germany, in May 2004.
Detailed information on both the instrument characteristics and calibration details can be found in Kazadzis et al. (2004). A summary of the information on the in-25
struments, the locations and the periods of the measurements that are used in both methods presented in this paper are shown in Table 1.
ACPD
5, 1619–1646, 2005 NO2 and HCHO photolysis frequencies C. Topaloglou et al. Title Page Abstract Introduction Conclusions References Tables Figures J I J I Back CloseFull Screen / Esc
Print Version Interactive Discussion
EGU 3. Empirical method for J (NO2) retrieval
3.1. Variability of the ratio of actinic flux to global irradiance
The basic idea of this method is the determination of J (NO2) as a function of solar zenith angle, by the use of global irradiance and empirical relationships, instead of the direct way using actinic flux and Eq. (8). For all J (NO2) calculations in this work, 5
the absorption cross-section and quantum yield of DeMore et al. (1997) were used at the temperature of 298◦K. Examining the wavelength dependence of the J (NO2) rate using the molecule functions mentioned above, it appears that the spectral weighting of the solar radiation spectrum by this process is largest in the region between 375 and 400 nm. The relative contribution of each wavelength to the J (NO2) calculation for 10
12 May 2003, sza=24◦, is shown in Fig. 1. The contribution of the 375–400 region is around 40%. As a result, the integral of global irradiance in this spectral region was selected as the global irradiance quantity to be used for the J (NO2) determination.
Since the method aims to use global irradiance instead of actinic flux, the variability of downwelling actinic flux to global irradiance is discussed briefly. The ratio actinic 15
flux/global irradiance as a function of solar zenith angle for wavelength of 390 nm is shown in Fig. 2. All ratio values are above unity since actinic flux is a quantity measured by a spherical detector while global irradiance by a flat one. Lowest values of the ratio (around 1.35) represent small solar zenith angles and low aerosol load, where the highest values (around 2.6) appear around 75 degrees of sza and refer to cloudless 20
conditions with small aerosol optical depth (AOD) as well. The overall shape of the ratio distribution is a result of the diminished contribution of the direct component to the global irradiance as solar zenith angle increases. Consequently, high values of this ratio around 75◦, characterize this spectral region because of the more significant contribution of the direct component in comparison to the diffuse in these wavelengths. 25
Since overcast spectra give an almost constant value of actinic/global ratio for all sza, around 1.75, it is apparent that the larger variability of this ratio is to be found at solar zenith angles around 70–75◦. The variabily due to different cloud cover conditions as
ACPD
5, 1619–1646, 2005 NO2 and HCHO photolysis frequencies C. Topaloglou et al. Title Page Abstract Introduction Conclusions References Tables Figures J I J I Back CloseFull Screen / Esc
Print Version Interactive Discussion
EGU
well as various AOD loads, account for the vertical distribution of the data in Fig. 2, for a single solar zenith angle.
3.2. Description of the method
J (NO2) values were determined by Eq. (8) using spectral actinic flux measurements and the (375–400 nm) global irradiance integral (E375−400) calculated from simultane-5
ous global irradiance spectra. The two quantities are shown in Fig. 3. As it can be observed, J (NO2) is closely correlated to E375−400 and its variability for a given irradi-ance value is rather small.
The dataset was divided into groups of 5◦ sza and 2nd degree polynomials were calculated from least squares fits between the J (NO2) and (E375−400). The polynomial 10
coefficients are shown in Table 3. J(NO2) values were then recalculated using these polynomials (Jcalc) and were compared to J (NO2) values from actinic flux spectra using Eq.8. Their average ratio Jcalc
J (NO2)was 1.001±0.062 (1σ) including all solar zenith angles, cloud cover and aerosol load conditions (Fig. 4).
The variability of the ratio shown in Fig. 4 is related to the representativeness of the 15
polynomials. The scatter for a constant sza is smaller in the region of 40-50 degrees, (2σ=0.12), is consistent with the limited variation of the actinic to global ratio as demon-strated in Fig. 2. This means that the polynomials can more accurately reproduce the
J (NO2) values from the global irradiance value for these solar zenith angles. On the other hand, the increase of the ratio variability for solar zenith angles larger than 55 20
degrees reflects the greater variability of the actinic flux to global irradiance ratio at these angles (2σ=0.44 for 70–75◦sza) also shown in Fig. 2.
In order to decrease the method uncertainty, a parameterization with cloud condi-tions was examined. The spectra used in this work were characterized according to cloud cover from a methodology proposed by Vasaras et al. (2000). Pyranometer data 25
were used to determine the variability of the radiation field due to clouds for each scan, which was flagged as 0 (sun not occluded, stable radiation field), 1 (sun
oc-ACPD
5, 1619–1646, 2005 NO2 and HCHO photolysis frequencies C. Topaloglou et al. Title Page Abstract Introduction Conclusions References Tables Figures J I J I Back CloseFull Screen / Esc
Print Version Interactive Discussion
EGU
cluded, stable radiation field), or 2 (broken clouds, unstable radiation field). For scans flagged as 0 and 2, data were again divided into groups of 5◦sza and new polynomials were extracted for each group to produce J (NO2) from E375−400. For scans flagged as 1, J (NO2) and E375−400 were very successfully correlated by a linear approxima-tion, where R2=0.99, so this linear expression was used in this case for all solar zenith 5
angles.
The application of the new -cloud dependent- polynomials on the Bentham data, produced an overall mean value of 0.999 for the Jcalc
J (NO2) ratio, with a standard deviation of 0.06. It is apparent that no significant change is evident for the entire data set. Small differences between the Jcalc
J (NO2) ratio from the original method to the one with 10
cloud flagging have been observed, when examining each set of data (Flag 0, 1 and 2) individually, as seen in Table 2. The absolute value of J (NO2) derived from Flag 1 spectra is improved by approx. 1.5%, using the cloud dependent polynomials. The remaining flag cases have significantly smaller deviations.
3.3. Alternative polynomials for Brewer spectroradiometers 15
To enable the use of the method described above by spectroradiometers that do not reach 400 nm, such as double or single Brewer monochromators (upper wavelength limit 365 nm and 325 nm, respectively), similar approaches were developed by using global irradiance at 360 nm (E360) for double Brewer spectrometer and 325 nm (E325) for single Brewer spectrometer, as an independent variable instead of E375−400. A new 20
set of polynomials was extracted for each case, using once more Bentham simulta-neous actinic flux and global irradiance measurements. The corresponding ratios of
Jcalc
J (NO2) for these two cases are shown in Fig. 5.
The use of global irradiance at 360 nm as the independent variable does not sig-nificantly change the results of the application of this method. The ratio of Jcalc
J (NO2) is 25
0.999 with as standard deviation of 0.067. In the case of 325 nm, this ratio contin-ues to be very close to unity, namely 1.003, however the standard deviation increases
ACPD
5, 1619–1646, 2005 NO2 and HCHO photolysis frequencies C. Topaloglou et al. Title Page Abstract Introduction Conclusions References Tables Figures J I J I Back CloseFull Screen / Esc
Print Version Interactive Discussion
EGU
considerably, especially as mentioned before for large solar zenith angles and reaches 0.107. This means that the average values of J (NO2) can still be reproduced, but greater uncertainty is introduced by the fact that in the course of the spectral scan the 325 nm wavelength is measured several minutes before the 375–400 nm region, which is highly representative of the J (NO2) value. Rapid changes of the radiation 5
field caused by moving clouds in front of the sun, could result to a non representative irradiance value at 325 nm, for this photolysis frequency calculation.
To test the validity of this method, global irradiance spectra from a double Brewer MKIII spectrometer working in LAP were used to produce J (NO2) values. The data were corrected for calibration standard differences between the two instruments and 10
for possible wavelength shifts, using SHICRIVM (Slaper et al., 1995), an algorithm that also deconvolutes the measured spectra to a standard slit with 1nm FWHM (the methodology is discussed in Kazadzis et al., 2004). The photolysis frequencies pro-duced by Brewer irradiance from global spectra and the polynomials, JBREWER, were then compared to J (NO2) values from Bentham’s actinic flux spectra, for measure-15
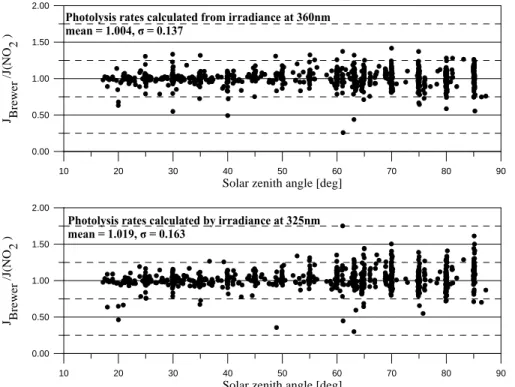
ments that deviated from each other less than 5 min. The results for the use of both (single and double) Brewer cases are presented in Fig. 6.
The results showed a mean ratio of 1.004±0.137 for the use of E360and 1.019±0.163 for the use of E325 as independent parameters. The same pattern with the increase of the ratio variability for large solar zenith angles also appears in these results. The total 20
uncertainty is greater in this case, because of additional factors affecting the quality of the results, such as measuring differences between the instruments. Another reason for the dispersion of the ratios around unity could be the time difference (the order of a few minutes) between the Brewer and Bentham scans, a potentially significant factor leading to large deviations in cases with variable cloud cover.
25
3.4. Implementation of the method on data from different locations
Finally, in order to investigate the extent to which the method is valid for other mea-surement sites, global irradiance and actinic flux data from the Bentham instrument
ACPD
5, 1619–1646, 2005 NO2 and HCHO photolysis frequencies C. Topaloglou et al. Title Page Abstract Introduction Conclusions References Tables Figures J I J I Back CloseFull Screen / Esc
Print Version Interactive Discussion
EGU
from a field campaign of INSPECTRO in May 2004 were used. The Bentham per-formed measurements in Buchhofen, Germany (48.7◦N, 12.9◦E, 340 m) from 13–22 May, 2004. J (NO2) values were calculated from the E375−400 integral and the polyno-mials retrieved from Thessaloniki’s dataset. The results were then compared to J (NO2) directly from actinic flux and Eq. (8). The results are shown in Fig. 7. The mean Jcalc
J (NO2) 5
ratio for sza<85◦ is 1.001 and the standard deviation is 0.063, showing that the poly-nomials seem to reproduce the J (NO2) values satisfactorily. The observation site in Buchhofen is rural, therefore the amount and type of aerosols is expested to be di ffer-ent compared to the measuremffer-ents in Thessaloniki. The atmospheric pattern for this period was dominated by partly cloudy and overcast sky conditions, with occasional 10
clear sky intervals. The application of the method to this data set showed generally good agreement among measured and calculated photolysis frequencies.
4. Empirical method for J(HCHO) retrieval
A similar empirical method could be used for calculating HCHO photolysis rates. How-ever, since the spectral region of interest of the HCHO photolysis is between 280 and 15
360 nm, special consideration has to be given to the fact that radiation in this spectral region is affected by ozone in the atmosphere. For this reason, instead of directly as-sociating the HCHO photolysis rates to global irradiance, the ratio J/Jpseudo is used where J is the photolysis frequency value calculated from Eq. (8) using actinic flux and Jpseudo is the corresponding value when global irradiance is integrated instead of 20
actinic flux. This ratio is associated with global irradiance at 325 nm. Both the ratio and the irradiance quantity are independent of ozone, so the method is to be used for all total ozone column conditions. 3rd degree polynomials are extracted for 5◦ sza groups. To calculate the J (HCHO), the global irradiance at 325 nm is used together with the extracted polynomials and finally a J/Jpseudo ratio is calculated. The ratio is 25
then multiplied with Jpseudo integrated from spectral global irradiance measurements, to produce the J (HCHO) value. The molecular data for J (HCHO) determination used
ACPD
5, 1619–1646, 2005 NO2 and HCHO photolysis frequencies C. Topaloglou et al. Title Page Abstract Introduction Conclusions References Tables Figures J I J I Back CloseFull Screen / Esc
Print Version Interactive Discussion
EGU
in this work are the cross section from Meller et Moortgat (2000) and the quantum yield from DeMore et al. (1997). The extracted polynomials for both chemical reactions are presented in Tables 4 and 5.
The method was applied to the measurements performed in Thessaloniki from April to July 2003, to produce J (HCHO) which were then compared to those calculated from 5
actinic flux. The results are shown in Fig. 8: The ratio Jcalc
J (HCHO) is practically unity and the standard deviation for both chemical
reactions is found around 3%. The decrease in the standard deviation value compared to that of the J (NO2) determination, derives from the fact that the variation of the actinic flux to global irradiance ratio is considerably smaller in the wavelength region of the 10
formaldehyde photolysis, especially for larger solar zenith angles.
When applying this method to Brewer global irradiance data in order to produce
J (HCHO) values, taking into consideration all factors already mentioned in the
previ-ous paragraph, the mean value of JBREWER
J (HCHO) equals 0.987 and a standard deviation of
0.097 for chemical reaction (R1) and 0.989±0.093 for reaction (R2). Finally, when ap-15
plying the method to the Bentham data in Buchhofen from May 2004, the ratio of the calculated J (HCHO) to those determined from actinic flux is found to be 0.989±0.038 for (R1) and 0.996±0.042 for (R2) for sza<85◦. This small deviation of the mean ratio from unity is a result of the implementation of the polynomials extracted in Thessa-loniki, an urban site with several clear sky days during the year, to data from a rural 20
and mostly cloudy (at the time of the measurements) site. It should also be noted that all σ values presented in this study are related to the uncertainty of the method itself and that the total uncertainty of the J values also includes cross section and quantum yield uncertainty as well as measuring uncertainties.
ACPD
5, 1619–1646, 2005 NO2 and HCHO photolysis frequencies C. Topaloglou et al. Title Page Abstract Introduction Conclusions References Tables Figures J I J I Back CloseFull Screen / Esc
Print Version Interactive Discussion
EGU
5. Conclusions
Two approaches of an empirical method for calculating J (NO2) and J (HCHO) are pre-sented, based on spectral measurements of global irradiance and the use of polyno-mials, as a function of solar zenith angle. The ratio of J values derived from these methods to those calculated directly by actinic flux spectra is 1.001 with a standard 5
deviation of around 6% for J (NO2), and for J (HCHO) 1.001±0.03 for chemical reac-tion (R1) and 1.001±0.03 for chemical reacreac-tion (R2), showing that nitrogen dioxide and formaldehyde photolysis frequencies can satisfactorily be reproduced by this method within acceptable uncertainty.
Alternative polynomials were extracted to enable the use of this method by Brewer 10
spectroradiometers (double and single) and the ratio of photolysis rates from a Brewer spectroradiometer to those retrieved from actinic flux measurements from a Ben-tham spectroradiometer show a ratio of JBREWER
J (NO2) equal to 1.004±0.137 using 360 nm, 1.019±0.163 using 325 nm, and for HCHO the ratio JBREWER
J (HCHO) is 0.989±0.093 for
reac-tion (R1) and 0.987±0.097 for reacreac-tion (R2), respectively. The level of agreement for 15
J (HCHO) is similar to that of the global irradiance spectra measured by the two
instru-ments for that spectral region.
Finally the method was applied also to measurements of the Bentham spectrora-diometer, performed in Buchhofen, Germany, in May 2004 in order to examine whether it could be implemented to data from another measuring site. The results from compar-20
ing the rates calculated by these methods to those determined from Bentham’s actinic flux spectra for sza<85◦, show a ratio of 1.001±0.063 for J (NO2) and for J (HCHO), 0.989±0.038 reaction (R1) and 0.996±0.042 for reaction (R2), demonstrating that the method can be applied to other measurement sites as well.
In the absence of routine actinic flux measurements due to the special configured op-25
tics required, the development of alternative methods to retrieve photolysis frequency values for NO2and HCHO can be very useful for atmospheric chemistry studies, since photolysis rates are an important input parameter for tropospheric chemistry models.
ACPD
5, 1619–1646, 2005 NO2 and HCHO photolysis frequencies C. Topaloglou et al. Title Page Abstract Introduction Conclusions References Tables Figures J I J I Back CloseFull Screen / Esc
Print Version Interactive Discussion
EGU
Ultraviolet (UV) global irradiance measurements are very common in monitoring sta-tions worldwide and a global network has developed in the last 20 years, providing a long history of quality assured irradiance measurements. Therefore, the retrieval of photolysis rate values from global irradiance measurements allows the reproduction of extensive time series of photolysis rates for nitrogen dioxide and formaldehyde, within 5
reasonable uncertainty.
Acknowledgements. Part of the work was conducted in the framework of the INSPECTRO EVK2-2001-00135 project, funded by the European Commission.
References
Balis, D. S., Zerefos, C. S., Kourtidis, K., Bais, A. F., Hofzumahaus, A., Kraus, A., Schmitt, R.,
10
Blumthaler, M., and Gobbi, G. P.: Measurements and modeling of photolysis rates during the Photochemical Activity and Ultraviolet Radiation (PAUR) II campaign, J. Geophys. Res., 107, D0, 8138–8149, 2002.
Cott ´e, H., Devaux, C., and Carlier, P.: Transformation of irradiance measurements into spectral actinic flux for photolysis rates determination, J. Atmos. Chem., 26, 1–28, 1997.
15
De More, W., Sander, S., Golden, D., Hampson, R., Kurylo, M., Howard, C., Ravishankara, A., Kolb, C., and Molina, M.: Chemical kinetics and photochemical data for use in stratospheric modeling, JPL Publ., 97-4, 1997.
Dickerson, R. R., Stedman, D. H., and Delany, A. C.: Direct measurements of ozone and nitrogen dioxide photolysis rates in the troposphere, J. Geophys. Res., 87, 4933–4946, 1982.
20
Edwards, G. D. and Monks, P. S.: Performance of a single-monochromator diode array spec-troradiometer for the determination of actinic flux and atmospheric photolysis frequencies, J. Geophys. Res., 108, D16, 8546–8558, 2003.
He, S. and Charmichael, G. R.: Sensitivity of photolysis rates and ozone production in the troposphere to aerosol properties, J. Geophys. Res., 104, D21, 26 307–36 324, 1999.
25
Kazadzis, S., Bais, A. F., Balis, D., Zerefos, C. S., and Blumthaler, M.: Retrieval of down-welling UV actinic flux density spectra from spectral measurements of global and direct solar UV irradiance, J. Geophys. Res., 105, 4857–4864, 2000.
ACPD
5, 1619–1646, 2005 NO2 and HCHO photolysis frequencies C. Topaloglou et al. Title Page Abstract Introduction Conclusions References Tables Figures J I J I Back CloseFull Screen / Esc
Print Version Interactive Discussion
EGU
Kazadzis, S., Topaloglou, C., Bais, A. F., Blumthaler, M., Balis, D., Kazantzidis, A., and Schall-hart, B.: Actinic flux and O1D photolysis frequencies retrieved from spectral of irradiance at Thessaloniki, Greece, Atmos. Chem. Phys., 4, 2215-2226, 2004,
SRef-ID: 1680-7324/acp/2004-4-2215.
Kraus, A. and Hofzumahaus, A.: Field measurements of atmospheric photolysis frequencies
5
for O3, NO2, HCHO, CH3CHO, H2O2 and HONO by UV spectroradiometry, J. Atm. Chem., 31, 161–180, 1998.
Kylling, A, Webb, A. R., Bais, A. F., Blumthaler, M., Schmitt, R., Thiel, S., Kazantzidis, A., Kift, R., Misslebeck, M., Schallhart, B., Schreder, J., Topaloglou, C., Kazadzis, S., and Rimmer, J.: Actinic flux determination from measurements of irradiance, J. Geophys. Res., 108, D16,
10
4506–4515, 2003.
Lantz, K. O., Shetter, R. E., Cantrell, C. A., Flocke, S. J., Calvert, J. G., and Madronich, S.: Theoretical, actinometric and radiometric determinations of the photolysis rate coefficient of NO2 during the Manua Loa Observatory Photochemistry Experiment 2., J. Geophys. Res., 101, 14 613–14 629, 1996.
15
McElroy, C. T., Midwinter, C., Barton, D. V., and Hall, R. B.: A comparison of J-values from the composition and photodissociative flux measurements with model calculations, Geophys. Res. Lett., 22, 11, 1365–1368, 1995.
McKenzie, R. L., Johnston, P. V., Hofzumahaus, A., Kraus, A., Madronich, S., Cantrell, C., Calvert, J., and Shetter, R.: Relationship between photolysis frequencies derived from
spec-20
troscopic measurements of actinic fluxes and irradiances during the IPMMI campaign, J. Geophys. Res., 107, D5, 4042–4057, 2002.
Meller, R. and Moortgat G. K.: Temperature dependence of the absorption cross sections of formaldehyde between 223 and 323 K in the wavelength range 225–375 nm, J. Geophys. Res, 105, D6, 7089–7101, 2000.
25
Schallhart, B., Huber M., and Blumthaler M.: Semi-empirical method for the conversion of spectral UV global irradiance data into actinic flux, Atm. Env., 38, 4341–4346, 2004.
Seroji, A. R., Webb, A. R., and Coe, H.: Derivation and validation of photolysis rates of O3, NO2 and CH2O from a GUV-541 radiometer, J. Geophys. Res., 109, D21307, 2004.
Shetter, R. E., McDaniel, A. H., Cantrell, C. A., Madronich, S., and Calvert, J. G.: Actinometer
30
and Eppley radiometer measurements of the NO2 photolysis rate during the Manua Loa Observatory Photochemistry Experiment, J. Geophys. Res., 97, 10 349–10 359, 1992. Shetter, R. E. and M ¨uller, M.: Photolysis frequency measurements using actinic flux
spec-ACPD
5, 1619–1646, 2005 NO2 and HCHO photolysis frequencies C. Topaloglou et al. Title Page Abstract Introduction Conclusions References Tables Figures J I J I Back CloseFull Screen / Esc
Print Version Interactive Discussion
EGU
troradiometry during the PEM-Tropics mission: Instrument description and some results, J. Geophys. Res., 104, 5647–5661, 1999.
Shetter, R. E. Junkermann, W., Swartz, W. H., Frost G. J., Crawford, J. H., Lefer, B. L., Barrick, J. D., Hall, S. R., Hofzumahaus, A., Bais, A., Calvert, J. G., Cantrell, C. A., Madronich, S., M ¨uller, M., Kraus, A., Monks, P. S., Edwards, G. D., McKenzie, R., Johnston, P., Schmitt,
5
R., Griffioen, E., Krol, M., Kylling, A., Dickerson, R. R., Lloyd, S. L., Martin, T., Gardiner, B., Mayer, B., Pfister, G., R ¨oth, E. P. Koepke, P., Ruggaber, A., Schwander, H., and Van Weele M.: Photolysis frequency of NO2: Measurement and modeling during the International Photolysis Frequency Measurement and Modeling Intercomparison (IPMMI), J. Geophys. Res., 108, D16, 8544–8558, 2003.
10
Smith, G. D., Molina, L. T., and Molina, M. J.: Measurement of radical quantum yields from formaldehyde photolysis between 269 and 339 nm, J. Phys. Chem., 106, 1233–1240, 2002. Vasaras, A., Bais, A. F., Feister, U., and Zerefos, C. S.: Comparison of two methods for cloud
flagging of spectral UV measurements, Atmos. Res., 57/1, 31–42, 2001.
Webb, A. R., Kift, R., Thiel, S., and Blumthaler, M.: An empirical method for the conversion of
15
spectral UV irradiance measurements to actinic flux data, Atmos. Environ., 36, 4044–4397, 2002.
Wiegand , A. N. and Bofinger N. D.: Review of empirical methods for the calculation of the diurnal NO2photolysis rate coefficient, Atmos. Environ., 34 , 99–108, 2000.
ACPD
5, 1619–1646, 2005 NO2 and HCHO photolysis frequencies C. Topaloglou et al. Title Page Abstract Introduction Conclusions References Tables Figures J I J I Back CloseFull Screen / Esc
Print Version Interactive Discussion
EGU
Table 1. Description of instruments details, location and periods of measurements.
Instrument Measurement quantity Location Period
Brewer MKII Global irradiance Thessaloniki, 2003
spectroradiometer 287–366 nm Greece
Pyranometer Total irradiance Thessaloniki, 2003
(305–800 nm) Greece
Bentham Actinic flux Thessaloniki, March–July
DTM300 290–550 nm Greece 2003
Spectroradiometer Global irradiance Buchhofen, 13–22 May
ACPD
5, 1619–1646, 2005 NO2 and HCHO photolysis frequencies C. Topaloglou et al. Title Page Abstract Introduction Conclusions References Tables Figures J I J I Back CloseFull Screen / Esc
Print Version Interactive Discussion
EGU
Table 2. Mean values of Jcalc
J (NO2) ratio for each group of spectra, using the original polynomials
and the cloud dependent polynomials.
Type of spectra Polynomials without cloud flagging Polynomials with cloud flagging
Mean ratio ±σ Mean ratio ±σ
Flag 0 0.996±0.038 1.001±0.037
Flag 1 1.029±0.08 1.012±0.056
ACPD
5, 1619–1646, 2005 NO2 and HCHO photolysis frequencies C. Topaloglou et al. Title Page Abstract Introduction Conclusions References Tables Figures J I J I Back CloseFull Screen / Esc
Print Version Interactive Discussion
EGU
Table 3. Polynomial coefficients for the calculation of J(NO2)=f (E375−400 nm). Ci represents the
i degree coefficient.
Solar zenith angle (◦) C2(x 10−6) C1(x 10−4) C0(x 10−5)
15–20 −9.09 5.53 9.246 20–25 −9.64 5.79 −14.548 25–30 −7.95 5.37 4.370 30–35 −8.34 5.62 −19.156 35–40 −7.28 5.47 −10.541 40–45 −6.68 5.49 −14.003 45–50 −3.97 5.25 −10.263 50–55 0.012 5.02 −9.151 55–60 3.22 5.02 −10.216 60–65 6.32 5.11 −12.000 65–70 9.31 5.22 −11.906 70–75 24.2 4.66 −4.895 75–80 53.5 3.79 3.422 80–85 40.8 4.35 0.578 85–90 43.6 4.35 0.374
ACPD
5, 1619–1646, 2005 NO2 and HCHO photolysis frequencies C. Topaloglou et al. Title Page Abstract Introduction Conclusions References Tables Figures J I J I Back CloseFull Screen / Esc
Print Version Interactive Discussion
EGU
Table 4. Polynomial coefficients for the calculation of J(HCHO)/Jpseudo=f (E325) for chemical reaction HCHO→H+HCO. Ci represents the i degree coefficient.
Solar zenith angle (◦) C3 C2 C1 C0
15–20 4.283 −4.404 0.193 1.899 20–25 6.552 −7.803 1.885 1.639 25–30 5.825 −6.070 0.949 1.778 30–35 −2.415 0.365 −0.396 1.829 35–40 −7.747 4.491 −1.241 1.876 40–45 −5.227 1.801 −0.226 1.785 45–50 −31.901 16.080 −2.086 1.833 50–55 −92.722 41.708 −4.662 1.889 55–60 −255.563 95.966 −9.138 1.990 60–65 −682.879 202.947 −15.857 2.120 65–70 −1029.41 232.180 −12.427 1.945 70–75 −863.652 166.211 −5.395 1.815 75–80 −5.177.15 626.845 −18.422 1.941 80–85 −10842.9 630.335 −6.472 1.794 85–90 −76310 1924.930 −7.929 1.790
ACPD
5, 1619–1646, 2005 NO2 and HCHO photolysis frequencies C. Topaloglou et al. Title Page Abstract Introduction Conclusions References Tables Figures J I J I Back CloseFull Screen / Esc
Print Version Interactive Discussion
EGU
Table 5. Polynomial coefficients for the calculation of J(HCHO)/Jpseudo=f (E325) for chemical reaction HCHO→H2+CO. Ci represents the i degree coefficient.
Solar zenith angle (◦) C3 C2 C1 C0
15–20 5.202 −5.229 0.366 1.892 20–25 6.905 −8.116 1.890 1.649 25–30 6.029 −6.383 1.021 1.776 30–35 −2.016 −0.160 −0.257 1.822 35–40 −7.143 3.741 −1.050 1.868 40–45 −6.598 2.211 −0.234 1.787 45–50 −32.717 16.183 −2.034 1.833 50–55 −100.082 44.429 −4.867 1.895 55–60 −295.819 109.447 −10.297 2.022 60–65 −797.964 233.588 −17.891 2.159 65–70 −1228.350 272.479 −14.237 1.970 70–75 −991.823 186.025 −5.420 1.813 75–80 −5318.360 650.78 −18.192 1.941 80–85 −8042.850 458.765 −1.792 1.775 85–90 −135796 3079.43 −11.693 1.799
ACPD
5, 1619–1646, 2005 NO2 and HCHO photolysis frequencies C. Topaloglou et al. Title Page Abstract Introduction Conclusions References Tables Figures J I J I Back CloseFull Screen / Esc
Print Version Interactive Discussion EGU FIGURE 1 280 290 300 310 320 330 340 350 360 370 380 390 400 410 420 430 440 Wavelength [nm] 0.0x100 2.0x10⁻³ 4.0x10⁻³ 6.0x10⁻³ 8.0x10⁻³ 10-2 1.2x10⁻² F( λ)* σ (λ )* φ (λ ) /J( NO 2 )
Fig. 1. Relative contribution of each actinic flux wavelength (F (λ) · σ(λ) · ϕ(λ)) to J (NO2) calcu-lation, for sza=24◦
, on 12 May 2004.
ACPD
5, 1619–1646, 2005 NO2 and HCHO photolysis frequencies C. Topaloglou et al. Title Page Abstract Introduction Conclusions References Tables Figures J I J I Back CloseFull Screen / Esc
Print Version Interactive Discussion
EGU
FIGURE 2
10 20 30 40 50 60 70 80 90
Solar zenith angle [deg] 1.20 1.40 1.60 1.80 2.00 2.20 2.40 2.60 2.80 ac tinic flu x / g lob a l irradiance 390 nm
Fig. 2. Ratio of actinic flux/global irradiance at 390 nm as a function of sza. All data are from
Bentham measurements in Thessaloniki.
ACPD
5, 1619–1646, 2005 NO2 and HCHO photolysis frequencies C. Topaloglou et al. Title Page Abstract Introduction Conclusions References Tables Figures J I J I Back CloseFull Screen / Esc
Print Version Interactive Discussion EGU FIGURE 3 0.0 4.0 8.0 12.0 16.0 20.0 24.0 E 375-400 [W/m 2 ] 0.0E+0 2.0E-3 4.0E-3 6.0E-3 8.0E-3 1.0E-2 J(NO 2 ) [ s -1 ]
solar zenith angle (deg) 15-20 20-25 25-30 30-35 35-40 40-45 45-50 50-55 55-60 60-65 65-70 70-75 75-80 80-85 85-90
ACPD
5, 1619–1646, 2005 NO2 and HCHO photolysis frequencies C. Topaloglou et al. Title Page Abstract Introduction Conclusions References Tables Figures J I J I Back CloseFull Screen / Esc
Print Version Interactive Discussion
EGU
FIGURE 4
10 20 30 40 50 60 70 80 90
Solar zenith angle [deg] 0.40 0.60 0.80 1.00 1.20 1.40 1.60 J ca lc /J(NO 2 ) Μean ratio= 1.001, σ = 0.062
Fig. 4. Ratio of J (NO2) calculated by E375−400 and polynomials (Jcalc) over J (NO2) estimated by actinic flux versus solar zenith angle. The mean value of the ratio is 1.001 and the standard deviation 0.062.
ACPD
5, 1619–1646, 2005 NO2 and HCHO photolysis frequencies C. Topaloglou et al. Title Page Abstract Introduction Conclusions References Tables Figures J I J I Back CloseFull Screen / Esc
Print Version Interactive Discussion
EGU
FIGURE 5
10 20 30 40 50 60 70 80 90
Solar zenith angle [deg]
0.00 0.50 1.00 1.50 2.00 J cal c /J(NO 2 )
Photolysis rates calculated from irradiance at 360nm mean ratio = 0.999 std=0.067
10 20 30 40 50 60 70 80 90
Solar zenith angle [deg]
0.00 0.50 1.00 1.50 2.00 J cal c /J(NO 2 )
Photolysis rates calculated from irradiance at 325nm mean ratio = 1.003, std = 0.107
Fig. 5. Ratio of calculated J (NO2) from polynomials by the use of global irradiance at 360 nm to J (NO2) from actinic flux (upper graph). All data are from the Bentham spectroradiometer. Same ratio for J (NO2) calculated from global irradiance at 325 nm (lower graph).
ACPD
5, 1619–1646, 2005 NO2 and HCHO photolysis frequencies C. Topaloglou et al. Title Page Abstract Introduction Conclusions References Tables Figures J I J I Back CloseFull Screen / Esc
Print Version Interactive Discussion
EGU
FIGURE 6
10 20 30 40 50 60 70 80 90
Solar zenith angle [deg] 0.00 0.50 1.00 1.50 2.00 J Brewe r /J(NO 2 )
Photolysis rates calculated by irradiance at 325nm mean = 1.019, σ = 0.163
10 20 30 40 50 60 70 80 90
Solar zenith angle [deg] 0.00 0.50 1.00 1.50 2.00 J Brewe r /J(NO 2 )
Photolysis rates calculated from irradiance at 360nm mean = 1.004, σ = 0.137
Fig. 6. Ratio of calculated J (NO2) from polynomials by the use of global irradiance at 360 nm to J (NO2) from actinic flux (upper graph). Same ratio for J (NO2) calculated from global irradiance at 325 nm (lower graph).
ACPD
5, 1619–1646, 2005 NO2 and HCHO photolysis frequencies C. Topaloglou et al. Title Page Abstract Introduction Conclusions References Tables Figures J I J I Back CloseFull Screen / Esc
Print Version Interactive Discussion
EGU
FIGURE 7
20 30 40 50 60 70 80 90
Solar zenith angle [deg] 0.50 0.60 0.70 0.80 0.90 1.00 1.10 1.20 1.30 1.40 1.50 J ca lc /J(NO 2 )
Photolysis rated calculated from irradiance at 375-400nm mean = 1.001, std = 0.063 (sza<85 deg)
Data from Bentham, Buchhofen, Germany, 13-22 May 2004
Fig. 7. Ratio of calculated J (NO2) from polynomials by the use of E375−400 and Thessaloniki polynomials, to J (NO2) from actinic flux. All data are provided from a Bentham spectroradiome-ter from measurements in 13–22 May 2004 in Buchhofen, Germany.
ACPD
5, 1619–1646, 2005 NO2 and HCHO photolysis frequencies C. Topaloglou et al. Title Page Abstract Introduction Conclusions References Tables Figures J I J I Back CloseFull Screen / Esc
Print Version Interactive Discussion
EGU
FIGURE 8
10 20 30 40 50 60 70 80 90
Solar zenith angle [deg]
0.60 0.80 1.00 1.20 1.40 J calc / J (HCHO)
HCHO photolysis---> H+HCO mean=1.001, σ = 0.030
10 20 30 40 50 60 70 80 90
Solar zenith angle [deg]
0.60 0.80 1.00 1.20 1.40 J calc / J (HCHO)
HCHO photolysis---> H2+CO mean=1.001, σ = 0.034
Fig. 8. Ratio of calculated J (HCHO) from polynomials by the use of global irradiance at 325 nm
to J (HCHO) from actinic flux for the two chemical reactions of formaldehyde photolysis. All data are provided from the Bentham spectroradiometer.