HAL Id: tel-02010551
https://tel.archives-ouvertes.fr/tel-02010551
Submitted on 7 Feb 2019HAL is a multi-disciplinary open access
archive for the deposit and dissemination of sci-entific research documents, whether they are pub-lished or not. The documents may come from teaching and research institutions in France or abroad, or from public or private research centers.
L’archive ouverte pluridisciplinaire HAL, est destinée au dépôt et à la diffusion de documents scientifiques de niveau recherche, publiés ou non, émanant des établissements d’enseignement et de recherche français ou étrangers, des laboratoires publics ou privés.
Mount Meager, a glaciated volcano in a changing
cryosphere : hazards and risk challenges
Gioachino Roberti
To cite this version:
Gioachino Roberti. Mount Meager, a glaciated volcano in a changing cryosphere : hazards and risk challenges. Earth Sciences. Université Clermont Auvergne, 2018. English. �NNT : 2018CLFAC040�. �tel-02010551�
Mount Meager, a glaciated volcano in a changing
cryosphere: hazard and risk challenges
by
Gioachino Roberti
M.Sc, University of Turin, 2014
B.Sc, University of Turin, 2011
Thesis Submitted in Partial Fulfillment of the Requirements for the
Joint Degree (Cotutelle)
Doctor of Philosophy in the Department of Earth Sciences Faculty of Science at Simon Fraser University (Canada)
and
Doctor of Philosophy in the Laboratoire Magmas et Volcans, École Doctorale des Sciences Fondamentales
Université Clermont Auvergne (France)
©
Gioachino Roberti 2018 SIMON FRASER UNIVERSITY UNIVERISTE CLERMONT AUVERGNEDefended October 24, 2018
Copyright in this work rests with the author. Please ensure that any reproduction or re-use is done in accordance with the relevant national copyright legislation.
Approval
Name: Gioachino Roberti
Degree: Doctor of Philosophy (Earth Sciences)
Title:
Mount Meager, a glaciated volcano in a changing cryosphere: hazard and risk challenges
Examining Committee: Chair:
Marta Chiarle Researcher Benjamin van Wyk de Vries
Supervisor Professor
Laboratoire Magmas et volcans, Université Clermont Auvergne
Brent Ward Supervisor
Professor and Chair Glyn Williams-Jones Supervisor
Professor Via Teleconference / Skype
Kelly Russell External Examiner Professor
Department of Earth, Ocean and Atmospheric
Sciences, University of British Columbia Via Teleconference / Skype Marta Chiarle
External Examiner Researcher
Istituto di Ricerca per la Protezione Idrogeologica, Consiglio Nazionale delle Ricerche
Irene Manzella External Examiner Lecturer
School of Geography, Earth and Environmental Sciences,
Plymouth University Via Teleconference / Skype
Anja Dufresne External Examiner Senior Scientist
Department of Engineering Geology and Hydrogeology
RWTH Aachen University Via Teleconference / Skype Susan Conway
External Examiner Chargé de recherche
Laboratoire de Planétologie et Géodynamique, Université de Nantes
Abstract
Mount Meager is a glacier-clad volcanic complex in British Columbia, Canada. It is known for its landslides, of which the 2010 is the largest Canadian historical landslide. In this thesis we investigated slope instability processes at Mount Meager volcano and the effects of ongoing deglaciation. We used a variety of methods including field and remote, geological, geomorphological and structural mapping to characterize glacial and
landslide activity at Mount Meager. We used Structure from Motion photogrammetry (SfM) and Lidar to produce digital surface models and InSAR to monitor slope
deformation. We applied SfM to historic photography to document glacier and landslide activity at Mount Meager. We discussed a model of growth and erosion of a volcano in glacial and interglacial periods, and the scientific and dissemination value of historic 3D topographic reconstruction. We described the 2010 Mount Meager landslide deposit to interpret emplacement dynamics and kinematics. The 2010 landslide separated in water-rich and water-poor phases that had different runout and distinct deposits. We analyzed historic airphotos to constrain the slope deformation prior to the 2010 collapse. The glacier near the toe of the slope retreated in the failure lead up, the collapse evolved in four subfailures involving the whole volcanic sequence and some basement rocks. We estimated 6 × 10⁶ m3 of water in the slope, that allowed the separation of the frontal water-rich phase. The total failure volume was 53 ± 3.8 × 10⁶ m3. We identified 27 large (>5×10⁵ m2) unstable slopes at Mount Meager and calculated ~1.3 km3 of ice loss since 1987. The west flank of Plinth peak and Devastation Creek valley moved up to -34±10 mm and -36±10 mm, respectively, over a 24-day period during the summer of 2016. The failure of these slopes could impact infrastructures and communities downstream of the volcano. The resulting decompression on the volcanic edifice after the failure of Plinth peak would affect the stress field to a depth of 6 km and up to 4 MPa. This sudden decompression could lead to hydrothermal or magmatic eruptions.
Keywords: Mount Meager volcano; Landslide; Glacier retreat; Climate change; Structure from Motion; Debris avalanche
Résumé
Mount Meager est un complexe volcanique glaciaire en British Columbia (Canada). Il est connu pour ses glissements de terrain, dont celui de 2010 étant le plus grand glissement de terrain historique au Canada. Dans cette thèse, nous avons étudié les processus d'instabilités du volcan Mont Meager ainsi que les effets de la déglaciation en cours. Nous avons utilisé une approche pluridisciplinaire, intégrant la cartographie géologique, géomorphologique et structurelle, du terrain et de la télédétection, pour caractériser l'activité glaciaire et les glissements de terrain au Mount Meager. Nous avons utilisé la photogrammétrie Structure from Motion (SfM) et la technologie Lidar pour produire des modèles numériques de terrain, et techniques InSAR pour surveiller le mouvement et la déformation des pentes du volcan. Nous avons appliqué la technique SfM à des photographies aériennes historiques pour documenter les activités des glaciers et des glissements de terrain au Mount Meager. Nous avons discuté un modèle de croissance et d'érosion d'un volcan en période glaciaire et interglaciaire, ainsi que la valeur scientifique et de vulgarisation de la reconstruction topographique 3D. Nous avons décrit les dépôts de glissement de terrain de 2010 à Mount Meager pour interpréter la dynamique de leur mise en place. Le glissement de terrain de 2010 s'est divisé en phases riches en eau et pauvres en eau, ayant des distances d'écoulement différentes et des dépôts distincts. Nous avons analysé des photographies aériennes historiques remontant à 1948, afin de documenter la déformation de la pente avant l'effondrement de 2010. Le glacier situé a proximité du pied de la pente a reculé durant les années précédents la rupture. Cette effondrement a évolué en quatre sous-effondrements, impliquant toute la séquence volcanique et le socle. Nous avons estimé 6 × 10⁶ m3 d'eau dans la pente, ce qui a permis la séparation de la phase frontale riche en eau. Le volume total d'effondrement est 53 ± 3.8 × 10⁶ m3. Nous avons identifié 27 grands (>5×10⁵ m2) flancs instables au Mount Meager et calculé a ~1.3 km3 de récession des glaciers depuis 1987. Le flanc ouest de Plinth Peak et de la vallée de Devastation Creek se sont déplacés de -34±10 mm -36±10 mm, respectivement, dans un période de 24 jours pendant l'été 2016. L‘effondrement de ces flancs pourrait avoir un impact important sur les infrastructures et les communautés en aval du volcan. La décompression résultant de l'édifice volcanique après l'effondrement du flanc ouest de Plinth Peak affecterait le champ de contrainte à une profondeur de 6 km et jusqu'à 4 MPa. Cette décompression soudaine pourrait
mener des éruptions hydrothermales et magmatiques. Un important glissement de terrain pourrait donc avoir joué un rôle dans le déclenchement de l'éruption de 2360 cal BP.
Mot clés Volcan Mount Meager; Glissement de terrain; Font de glace; Changement climatique; Structure from Motion; Avalanche de débris
Synthèses des travaux
Synthèses
Mount Meager est un complexe volcanique glaciaire en British Columbia,
Canada. Il est connu pour ses nombreux glissements de terrain et une éruption en 2360 cal yr BP. Le lien entre les glaciers, les glissements de terrain, et l'activité volcanique a été mal contraint, malgré les aléas et les risques possibles pour les communautés locales. Cette thèse a intégré les approches de géologie Quaternaire, volcanologie, géotechnique, et l‘étude des aléas naturels pour mieux comprendre l'interaction des processus à Mount Meager et améliorer l'évaluation des dangers et des risques géologiques.
L'importance de la photographie aérienne historique et un
demi-siècle de changements géomorphologiques du Mount Meager
Chapitre 1 est un analyse bibliographique, où nous avons exploré la problématique d'un volcan dans une cryosphère en mutation. Les volcans sont des systèmes complexes auxquels les glaciers ajoutent un degré de complexité. Les dangers des volcans glaciaires sont parmi les plus meurtriers de la planète. Les changements climatiques entraînent un recul des glaciers, contribuant à conditionner les flancs à l‘effondrement. Les effondrements des édifices volcaniques se transforment en avalanches de débris qui voyagent de longues distances, avec des effets dévastateurs en aval.
Chapitre 2 documente la recherche sur des données d‘archives de
photographies aériennes sur le Mount Meager. L‘approche innovante du traitement de ces photos aériennes avec photogrammétrie Structure from Motion (SfM) a permis une reconstruction topographique rapide en 3D du Mount Meager de 1947 à 2006. La possibilité d'analyser plus de 50 ans de changements géomorphologiques au Mount Meager a permis d'identifier les mouvements des glaciers et des glissements de terrain. Chacun des glaciers a des tendances, des morphologies et une couverture de débris différentes. Les pentes se sont déformées et se sont effondrées, générant des glissements de terrain qui ont voyagé de longues distances. Afin d'expliquer la
fréquence élevée des glissements de terrain au Mount Meager, nous présentons un modèle conceptuel de l'évolution d'un édifice volcanique associée à des glaciations régionales multiples. L'activité volcanique pendant les périodes glaciaires construit des édifices plus instables qui sont susceptibles de s'effondrer pendant les périodes
interglaciaires. Les glaciers influencent la forme du volcan pendant les périodes
glaciaires, mais, lors les périodes interglaciaires, les glaciers sont influencés par l'activité volcanique. Outre la valeur scientifique de la photographie historique, la contribution de la visualisation de données 3D multi temporelle aux services de vulgarisation a une valeur inestimable. Des exemples de ce travail sont des images 3D par intervalles, faciles à comprendre et intéressantes aussi pour le public non scientifique (voir ici le Glacier Mosaic et ici le flanc sud de Mount Meager avant l'effondrement en 2010).
Le dépôt de glissement de terrain de Mount Meager 2010
Le 6 août 2010, le flanc sud du Mount Meager s‘est effondré, provoquant le plus grand glissement de terrain de l'histoire canadienne. Dans le Chapitre 3, nous décrivons les dépôts de glissement de terrain, la dynamique de mise en place et de l'évolution rhéologique. Lorsque le flanc sud du Mount Meager s‘est effondré, la masse fracturée et liquéfiée, se séparent en un flux frontal, plus rapide, riche en eau et un noyau plus lent et pauvre en eau. Les deux phases ont suivi des trajectoires différentes laissant des dépôts différents. La phase riche en eau a laissé un dépôt dispersé distal et a provoqué les fortes remontées observées sur les flancs des vallées.La phase pauvre en eau est restée confinée dans la vallée, laissant un dépôt épais avec des monticules. Le zonage lithologique brut dans le gisement respecte la structure originale du flanc de la source, avec le matériau avec l'altération hydrothermale de la base de la pente trouvée dans le dépôt distal. La teneur en argile dans le gisement indique qu'au moins 12% de la pente a été altérée par voie hydrothermale. Les différentes rhéologies et trajectoires ont des impacts différents sur les côtés des vallées (voir ici le modèle de la phase riche en eau de glissement de terrain de 2010), cela montre l'importance de considérer de multiples rhéologies et la transformation des flux lors de la modélisation des avalanches de débris et de la production de cartes de danger.
La pente avant le glissement de terrain du Mount Meager en 2010
Pour comprendre la dynamique de la mise en place de glissement de terrain 2010, nous avons déplacé notre attention sur l'état de la pente avant la rupture (Chapitre 4). En utilisant les photographies aérienne historiques nous avons documenté ladéformation des pentes et l‘activité des glaciers de 1948 à 2006. Avec le travail de terrain, nous avons amélioré les contraintes sur la géologie et les structures de la cicatrice d'effondrement. Nous avons recalculé le volume d'effondrement, et nous discutons du volume et du rôle de l'eau dans l'effondrement et la séquence
d'effondrement. Le glacier du Capricorne a progressé dans les années 1970-1980 et a reculé de 1990 à 2006.Les principales discontinuités du flanc étaient déjà présentes en 1948, le nombre de fractures et les déplacements le long des failles majeures ont augmenté dans les années suivantes (voir ici le flanc 1948-2010). Le renflement des talus et les défaillances précurseurs se sont produits au pied de la pente.
L'augmentation de la pression de l'eau interstitielle provenant des champs de neige et de l'eau de fonte glaciaire a causé la rupture au pied de la pente. Lors de l‘effondrement, nous avons estimé que 6 × 10⁶ m3 de l'eau résidait au pied de la pente, ce qui a permis la séparation de la phase frontale riche en eau. Le volume total d'effondrement est 53 ± 3.8 × 10⁶ m3. L‘effondrement a évolué en quatre sous-parties de 24.6 × 10⁶ m3, 13.8 × 10⁶ m3, 9.0 × 10⁶ m3, et 5.6 × 10⁶ m3, impliquant des roches de socle et toute la séquence volcanique. Cycles glaciaires, altération hydrothermale et déformation gravitationnelle lente conditionnant la pente à la rupture. La déformation lente des pentes aurait pu être surveillée auparavant et la défaillance prévue des décennies à l'avance. Beaucoup d'autres pentes sont dans le même état que la pente de glissement d'avant 2010, et nous avons identifié plusieurs zones instables, des systèmes de surveillance et d‘alerte rapide doivent donc être mis en place, de toute urgence, a fin de réduire les risques consécutifs, y compris les pertes de vie causées par les glissements de terrain du Mount Meager.
Les pentes du Mount Meager, danger et risque
L'analyse historique des photos aériennes, Lidar et InSAR, a permis de calculer la perte de masse des glaciers depuis 1987, et d‘identifier et de mesurer les taux de déformation de nombreuses pentes instables au Mount Meager (Chapitre 5). La déglaciation continue est susceptible de déclencher d'autres effondrements importants
pouvant affecter les activités économiques à proximité du volcan et dans les
communautés de la vallée de la rivière Lillooet. Le volcan Mount Meager a perdu~1.3 km3 de glace depuis 1987. Nous avons identifié 27 grands (>5×10⁵ m2) pentes instables. Dix-sept de ces pentes ont été touchées par la récente déglaciation. Quinze des pentes ont des volumes de >106 m3; si elles s‘effondraient de manière catastrophique, les infrastructures proches du volcan pourraient être sérieusement affectées. Dix pentes ont des volumes de >107 m3; leur effondrement peut avoir un impact sur les zones peuplées en aval. Les flancs des vallées du ruisseau Job et du ruisseau Devastation ont atteint respectivement -34 ± 10 mm et -36 ± 10 mm sur une période de 24 jours au cours de l‘été 2016. Nous considérons que ces pentes sont dans un état critique. Le risque de perte de vie suite à un grand glissement de terrain du Mount Meager a été jugé inacceptable. Des systèmes de surveillance des pentes et d'alerte rapide sont nécessaires de toute urgence pour atténuer les risques. La surveillance InSAR est l‘option la plus rapide et la plus rentable du volcan Mount Meager.
Glissements de terrain et éruptions
En cas de défaillance catastrophique du flanc ouest du Plinth Peak, une grande (108- 109 m3) avalanche de débris serait générée, impactant les infrastructures et les communautés dans la vallée de Lillooet. Outre l‘impact direct du glissement de terrain, la modélisation par éléments finis 2D montre que la décompression résultante sur l'édifice volcanique après l'enlèvement de la masse affecterait le champ de contrainte jusqu'à une profondeur de 6 km et pouvant atteindre des décompressions de 4 MPa. Un tel changement brusque de stress effectif pourrait à la fois déclencher une explosion hydrothermale et affecter le réseau magmatique et à travers une série de processus (propagation de fractures, exsolution de gaz, migration de magma) déclencher une éruption (Chapitre 6). Ces nouvelles connaissances sur la décompression suite à un glissement de terrain au Mount Meager permettent de réévaluer le déclencheur d'éruption 2360 cal yr BP. Un effondrement important provenant de Job Valley avant l'éruption pourrait avoir joué un rôle dans le déclenchement de l'éruption. Bien que les preuves stratigraphiques et la datation au radiocarbone montrent un décalage entre le glissement de terrain et l'éruption, nous interprétons le décalage commet étant lié au temps nécessaire pour que le système magmatique réagisse à la décompression. Le changement de stress consécutif au glissement de terrain a permis aux fractures de se
propager NE de la cicatrice de glissement de terrain et de perturber le système magmatique permettant le mélange de magma et finalement déclenchant l'éruption. (Chapitre 6). D'autres études sont nécessaires pour mieux contraindre le réseau magmatique de Mount Meager, de sorte que de nouveaux modèles numériques
puissent être développés et appliqués pour mieux évaluer l'interaction entre la fonte des glaciers, les glissements de terrain et les éruptions au Mount Meager.
Travail futur
Beaucoup de travail futur à Mount Meager est nécessaire. De meilleures
contraintes d'âge sur le volcanisme et les glaciations sont nécessaires pour comprendre le système glaciaire, le système volcanique et l'interaction entre les deux. Des
connaissances plus approfondies sur l'histoire glaciovolcanique peut aider à comprendre les dangers actuels des glaciers et des glissements de terrain au Mount Meager, ainsi que sur d'autres volcans glaciaires du monde entier. Des cartes de dangers et de risques devraient être produites à Mount Meager; la surveillance des pentes et les systèmes d'alerte précoce et d'alarme doivent être mis en œuvre avec une
communication efficace des risques aux responsables locaux, aux communautés et aux parties prenantes.
Les glaciers couverts de débris du Mount Meager
Les glaciers couverts de débris sur le Mount Meager devraient être étudiés plus en détail. Les effets des avalanches de débris et des chutes des roches sur la
dynamique des glaciers ainsi que l‘influence du substrat rocheux volcanique altéré par l‘hydrothermie peuvent être étudiés à l‘aide de modèles numériques et de travaux sur le terrain. Les effets thermiques des fumerolles sur le glacier Job sont inconnus et méritent des études. Les glaciers du Mount Meager et les glaciers d‘autres volcans peuvent être comparés à des glaciers recouverts de débris provenant de montagnes non
volcaniques.
Glaciovolcanisme à Mount Meager?
La cartographie géologique du Mount Meager a été réalisée dans les années 1970 (Read 1978). Les progrès scientifiques d'aujourd'hui sur la compréhension des processus volcaniques et glaciaires pourraient permettre une mise à jour de la carte géologique. Les avancées technologiques telles que Lidar et photographie haute résolution permettent une cartographie de plus haute résolution. La stratigraphie du volcan pourrait être cartographiée plus en détail, en particulier à plus petite échelle (affleurement ou chenal), afin d‘identifier davantage d‘unités stratigraphiques. Les caractéristiques glaciovolcaniques non cartographiées peuvent être reconnues et des
nouvelles dates pourraient mieux limiter l'âge des glaciations et du volcanisme au Mount Meager.
Mise en œuvre de la surveillance des pentes et communication des
dangers et des risques
À l'heure actuelle, la surveillance de la température et des précipitations est utilisée comme système d'avertissement indirecte de glissement de terrain au Mount Meager; cela devrait être accompagné d'observations directes de pentes. Des systèmes de surveillance par satellite et au sol, des systèmes d'alerte précoce et des systèmes d'alarme doivent être mis en place pour réduire les risques sur les lieux des travail situés près du volcan et dans les communautés de la vallée de Lillooet. Une communication des risques efficace, des directives et des protocoles devraient être élaborés et mis en œuvre car la surveillance coûteuse aurait peu d‘impact à moins que ses résultats ne soient compris par les personnes à risque. Les applications de médias sociaux et les technologies 3D peuvent aider les locaux à comprendre les dangers et les risques volcaniques.
Modèles de glissement de terrain pour le zonage des dangers
Des simulations numériques sont nécessaires pour déterminer les zones d'impact, et définir le zonage des risques dans la vallée de la rivière Lillooet. Les travaux de Simpson et al. (2006) dans l‘identification des zones d‘inondation peuvent-être améliorés, également à la lumière de l'événement de 2010. La distance d'impact du glissement de 2010 a été surestimée par le modèle de Simpson et al. (2006). L'analyse des risques de Friele et al. (2008) devrait être mise à jour compte tenu de l'augmentation de la population et des activités économiques près du Mount Meager et des glissements de terrain identifiés dans cette étude.
Le modèle numérique préliminaire du glissement de terrain de 2010 (voir vidéo
ici) a été calculé avec le logiciel Volcflow, développé par Kelfoun and Druitt (2005). Des simulations séparées avec différents paramètres de frottement et de cohésion ont été effectuées pour reproduire des phases de rhéologie différentes. Le recalibrage du modèle suer l‘événement de 2010 permettrait des scénarios d'impact plus précis pour les pentes instables identifiées.
Déglaciation, glissements de terrain et éruptions
Des études supplémentaires numériques et sur le terrain sont nécessaires pour étudier le lien entre la déglaciation, les glissements de terrain et les éruptions au Mount Meager. Des analyses pétrologiques, géochimiques et géophysiques peuvent aider à comprendre les systèmes hydrothermaux et volcaniques du Mount Meager. Des simulations numériques des variations de contraintes consécutives à des glissements de terrain pourraient contribuer à comprendre la probabilité d‘une éruption en cas de grands glissements de terrain.
Les résultats obtenus à Mount Meager apportent un nouvel éclairage sur les effets des glaciations régionales et alpines sur le volcanisme et sur les effets du volcanisme sur les glaciers. Ces nouvelles connaissances peuvent être appliquées à d‘autres volcans dans le monde et à d‘autres planètes.
Acknowledgements
I would like to acknowledge all the people that supported me though these years of travels and science. First my supervisors. Ben for encouraging me to enrol in the PhD, for being a great mentor, and friend. Brent for his invaluable mentorship and friendship, and for the patience in dealing with the "greasy Italian". They both helped me in
developing my scientific interest, encouraging new ideas and making sure I did not get too imaginative, ...and they gave me a roof multiple time (and thank you to Fran and Lorraine to welcoming home). Pierre for the field adventures, professional advices, and friendship. John for slaughtering my manuscripts, the humour, and the friendship. Marco and Gigi that first exposed me to the international academic community and kept
encouraging me from the backstage. Glyn for his ongoing optimism and support. Giacomo for the Italian dinners and, together with Geidy and Jean-Pascal, for the successful collaboration with TRE-Altamira. Audray, and Brian for discussion and collaboration. Alex, Kelly, and Melanie for constructive discussions. Bernhard and Farnoush for sharing the Mt Meager passion.
Then all the staff, from both LMV and SFU, that helped me with logistics and bureaucracy. In particular Tarja, Lorena, Matt, Thierry, Audray, Nathalie. And the PhD students. In particular Ale, Silvia and Anne for sharing the office and the fun. Snowy, Carie-Ann, Patrick and Derek to share the dirt and the chaos. Davide for sharing the expat experience. Mohsen for the insightful conversations. The Peruvian connection, friends and colleagues from INGEMMET, and OVI; especially Nelida, Ivonne, Gael, Patricio, Rigoberto, Joseph, Saida, Hugo, Bilbeto, Lionel, Domingo, Marco, Gissel, Luisa.
Lucian, Susanne, Chloe, Aspen, Erik, Brad, Surabhi, Hazel, Sarah, Betka, Omar, Chu, Brian, Annie, Alex, Leif, Dave, Flvien, Jeff(s), Sammy, Sarah, Stefano, Cate, Line, Kai, Melanie, Rachel, Antonina, the SFU climbing wall community (especially Adam and his truck) that helped to endure the Vancouver rain and enjoy the Squamish sun. Taoye, Fares, Magda, Myriam, Auriane, Melody, Audrey, Marie, Ophelie, Floriane, Fanny, Clothilde, Nico, Orya, Romi, Bertrand, Melodie, Baptiste, Tatum, Marie-Anne, Bene, Brahim, Christophe, Swetha, Simon, Diego, Giacomo, Damien, Alexis, Valentin(s), Lois, Juliette, Baptiste, Pierre, Marina, Nathan, Lola, Julie, Vincent, Taya, Yannick(s),
Federica, ChouChou, Camila, Sarah, Coco for sharing the "Spleen de Clermont" and the wine with me. Catherine for adopting the Italo-French-Canadian kid and giving him a roof. Cat for the endless support and careful manuscript review.
Finally, I would like to thank my family, and old friends, that have always been cheering for me. Francesco, Ema, Michela, GiuGiu, Giacomo, Betto, Kiki. Special thanks to my grandparent, Carlo, always an inspirational figure and my grandmother, Monet. And everyone that I may have forgotten.
Table of Contents
Approval ... ii
Abstract ... iii
Résumé ... iv
Synthèses des travaux ... vi
Synthèses ... vi
L'importance de la photographie aérienne historique et un demi-siècle de changements géomorphologiques du Mount Meager ... vi
Le dépôt de glissement de terrain de Mount Meager 2010 ... vii
La pente avant le glissement de terrain du Mount Meager en 2010 ... viii
Les pentes du Mount Meager, danger et risque ... viii
Glissements de terrain et éruptions... ix
Travail futur ... xi
Les glaciers couverts de débris du Mount Meager ... xi
Glaciovolcanisme à Mount Meager? ... xi
Mise en œuvre de la surveillance des pentes et communication des dangers et des risques ... xii
Modèles de glissement de terrain pour le zonage des dangers ... xii
Déglaciation, glissements de terrain et éruptions ... xiii
Acknowledgements ... xiv
Table of Contents ... xvi
List of Tables ... xxi
List of Figures... xxii
Chapter 1. Introduction ... 1
1.1. Introduction ... 1
1.1.1. Mount Meager and the Garibaldi Volcanic Belt ... 1
1.1.2. Mount Meager landslides and the last eruption ... 4
1.1.3. Glacier, landslides and volcanoes... 6
1.1.4. Hazard and risk at Mount Meager volcano ... 7
1.2. Methods ... 8
1.2.1. Photogrammetry and Structure from Motion ... 8
Photogrammetry ... 8
Structure from Motion - Multi-view stereo ... 9
1.2.2. Lidar ... 11
1.2.3. InSAR ... 12
1.3. Thesis outline ... 13
1.3.1. Publication list... 14
Papers ... 15
Conference papers and presentations... 15
Conference sessions organized ... 17
Chapter 2. Structure from Motion and historical airphotos to document decades
of glacier and landslide activity at Mount Meager volcano ... 18
2.1. Abstract ... 18
2.2. Introduction ... 19
2.2.1. Context of glacier and landslide activity at Mount Meager volcano ... 20
2.3. Methods ... 21
2.3.1. Digitization of historical airphotos and cartographic production ... 21
2.3.2. Cartographic product validation and GIS mapping ... 27
2.4. 1947-2016 geomorphic changes at Mount Meager volcano ... 34
2.4.1. Devastation ... 34 2.4.2. Mosaic ... 37 2.4.3. Job ... 39 2.4.4. Affliction ... 41 2.4.5. Bridge River ... 43 2.5. Discussion ... 44 Devastation ... 45 Mosaic ... 46 Job ... 46 Affliction ... 47 Bridge River ... 47
2.5.2. Landslides and debris-covered glaciers on a volcano ... 47
2.5.3. The value of historic photography. ... 49
2.6. Conclusions ... 49
2.7. Acknowledgments ... 50
Chapter 3. Rheological evolution of the Mount Meager 2010 debris avalanche, southwestern British Columbia ... 52
3.1. Abstract ... 52
3.2. Introduction ... 53
3.2.1. Setting ... 54
3.2.2. Landslides on Mount Meager ... 55
3.2.3. The 2010 event ... 56
3.3. Methods ... 58
3.3.1. Photography and Structure from Motion ... 58
3.3.2. Field mapping ... 59
3.3.3. Grain size and lithologic analysis ... 59
3.4. Results ... 60
3.4.1. Facies ... 61
3.4.2. Structures ... 62
3.4.3. Hummocks ... 63
3.4.4. Area descriptions ... 64
Area 1: Meager barrier ... 64
Area 2: Terrace ... 67
Area 4: Distal zone upvalley of the campsite (‗distal up‘) ... 74
Area 5: Distal zone downvalley of the campsite (‗distal down‘) ... 78
3.5. Discussion ... 79
3.5.1. Lithology and grain size ... 81
3.5.2. Rheology phases ... 82
3.5.3. Summary of the event ... 84
3.5.4. Hazard implications ... 86
3.6. Summary and conclusions ... 87
3.7. Acknowledgments ... 89
Chapter 4. Precursory slope distress prior to the 2010 Mount Meager landslide, British Columbia ... 90
4.1. Abstract ... 90
4.2. Introduction ... 91
4.2.1. Context of the Mount Meager failure ... 93
4.3. Methods ... 95
4.3.1. Structure from Motion (SfM) ... 95
4.3.2. Quality assessment ... 96
4.3.3. Glacier area errors ... 97
4.3.4. Volumetric errors ... 97
4.4. Results ... 98
4.4.1. Glacier change ... 98
4.4.2. Pre-event flank conditions, 1948-2006 ... 99
4.4.3. 2010 collapse ... 101
4.4.4. Meteorological trigger ... 103
4.4.5. Water in the source rocks ... 104
4.5. Discussion ... 105
4.5.1. Glacier activity ... 105
4.5.2. Progressive failure ... 105
4.5.3. Causes and failure mechanism ... 107
4.6. Conclusions ... 110
4.7. Acknowledgments ... 111
Chapter 5. Landslides and glacier retreat at Mount Meager volcano: hazard and risk challenges ... 112
5.1. Abstract ... 112
5.2. Introduction ... 113
5.3. Methods ... 115
5.3.1. Structure from Motion (SfM) ... 116
5.3.2. Lidar ... 117
5.3.3. Interferometric Synthetic Aperture Radar ... 117
5.3.4. Landslide mapping ... 118
5.3.5. Glacier changes 1987-2016 ... 119
5.4. Results ... 119
5.4.2. Landslide inventory and InSAR deformation data ... 120
5.5. Discussion ... 123
5.5.1. Glacial retreat at Mount Meager volcano ... 123
5.5.2. Volcano-ice interaction hazards ... 123
5.5.3. Landslide hazards ... 124
5.5.4. InSAR deformation data ... 125
5.5.5. Risk from landslides and volcanic activity at Mount Meager... 125
5.5.6. Slope monitoring and early warning system ... 126
5.6. Conclusions ... 127
5.7. Acknowledgments ... 128
Chapter 6. Could glacial retreat-related landslides trigger volcanic eruptions? Insights from Mount Meager, British Columbia ... 129
6.1. Abstract ... 129
6.2. Introduction ... 130
6.3. Methods ... 133
6.4. Results ... 134
6.4.1. The west flank of Plinth Peak. ... 134
6.4.2. The Job landslide ... 136
6.5. Discussion ... 138
6.5.1. The Plinth collapse ... 138
6.5.2. The Job landslide and the 2360 cal yr BP eruption. ... 139
6.6. Conclusions ... 142
6.7. Acknowledgments ... 143
Chapter 7. Summary and conclusions ... 144
7.1. Synthesis ... 144
7.1.1. The value of historic photography and half a century of geomorphic changes at Mount Meager Volcano ... 144
7.1.2. The 2010 Mount Meager landslide deposit ... 145
7.1.3. The slope prior to the 2010 Mount Meager landslide ... 145
7.1.4. The slopes of Mount Meager, hazard and risk ... 146
7.1.5. Landslides and eruptions ... 147
7.2. Future work ... 147
7.2.1. Mount Meager debris-covered glaciers ... 148
7.2.2. Glaciovolcanism at Mount Meager? ... 148
7.2.3. Slope monitoring implementation, and hazard and risk communication ... 148
7.2.4. Landslide runout models for hazard zonation ... 149
7.2.5. Deglaciation, landslides and eruptions ... 149
References ... 150
APPENDIX A. Supplemental Files to Chapter 2 ... 170
List of Tables
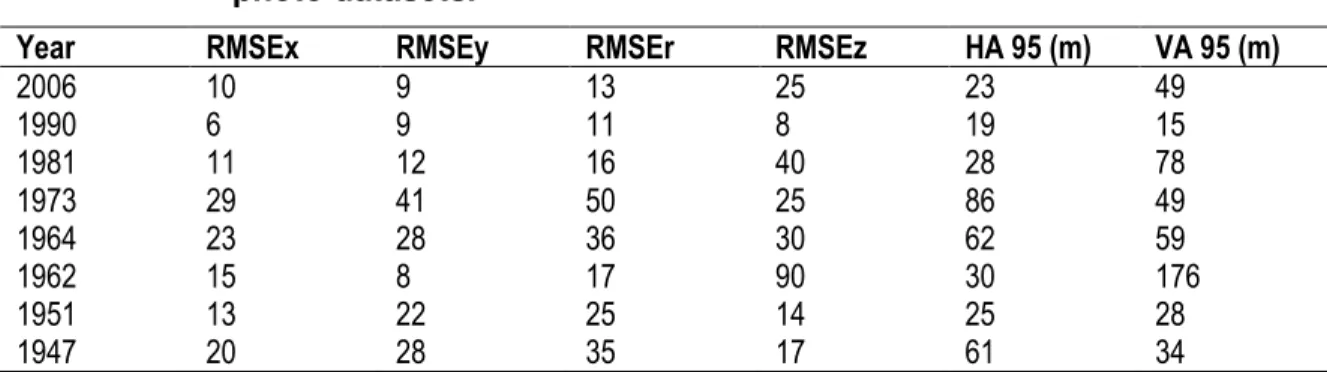
Table 1.1. Photogrammetry vs SfM. ... 11 Table 1.2. Terminology of digital elevation data. ... 12 Table 2.1. Airphotos and PhotoScan model characteristics... 26 Table 2.2. RMSEx, RMSEy, RMSEz, RMSEr, HA 95, and VA 95 for the different photo datasets. ... 28 Table 2.3. Glacier parameters. N=North; NE = Northeast; SE = Southeast. a =
referred to the 1947 dataset. b = referred to the 1951 dataset. ... 44 Table 4.1. Precision and accuracy of the different datasets. ... 96 Table 5.1. Inventory of unstable slopes on the Mount Meager volcano. ... 122 Table 6.1. Density, Young's modulus and Poisson's ration used to model the
volcanic edifice and the country rocks. Data from a) Russel, personal communication (2018) and b) Wohletz and Heiken (1992). ... 133
List of Figures
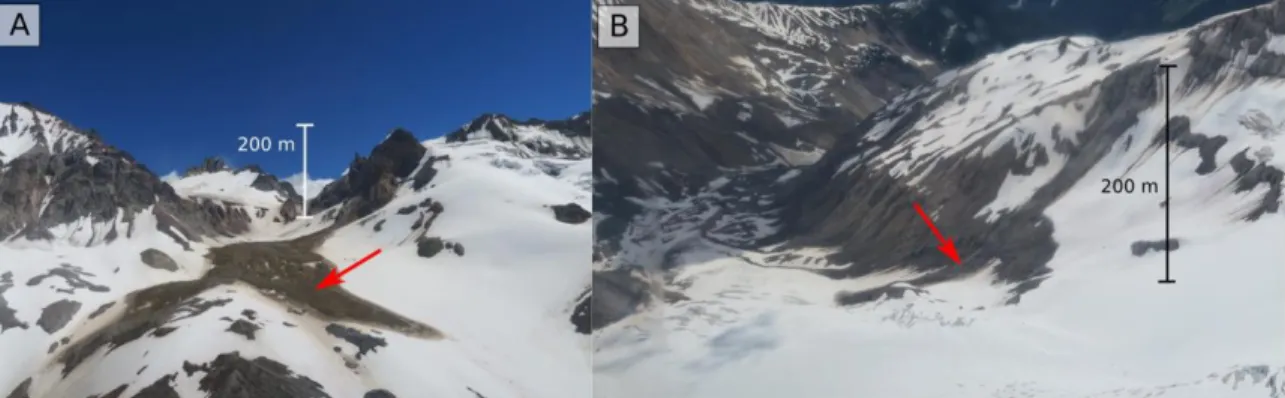
Figure 1.1. Map of the Pacific Northwest: Mount Meager, circled in red, the Garibaldi Volcanic Belt, circled in blue, the Cascade Volcanic Arc circled in green, and the Cordilleran Ice Sheet extent in black dashed lines. Note the smaller extension of the Garibaldi Volcanic Belt compared to the Cascade Volcanic Arc, and the boundary of the Cordilleran Ice Sheet, shortly after the Canada-US border. Modified from Wilson and Russel 2018. ... 4 Figure 1.2. Rock avalanches (arrows) at Mount Meager in summer 2018. A) Job
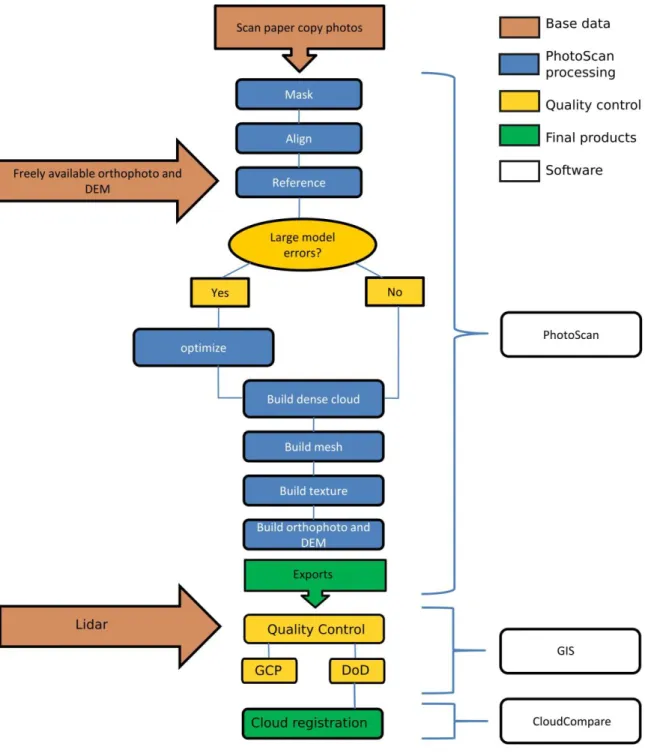
Valley. B) Devastation Valley. ... 5 Figure 2.1. SfM workflow from photo digitization to orthophoto, DEM export, and
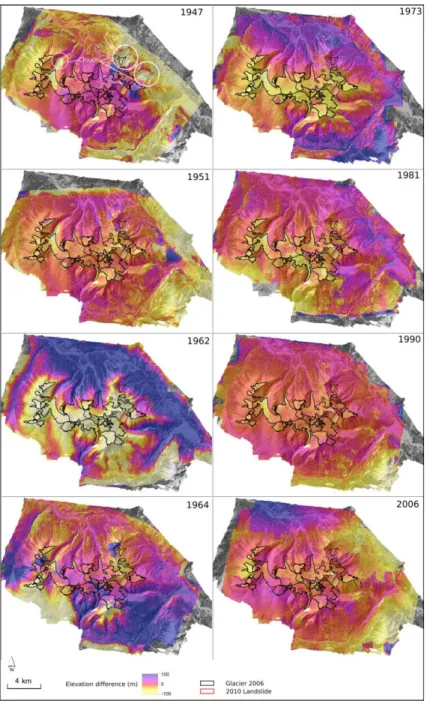
quality control. ... 23 Figure 2.2. DEMs of difference between the photo datasets and the Lidar reference.
Black outlines are the glaciers in 2006. Red outline is the 2010 landslide scar. In the 1947 dataset, artifacts are generated by clouds. Despite systematic errors (doming, photo strips misalignment, tilting) that are present in all the datasets, the glacier mass loss is visible in some
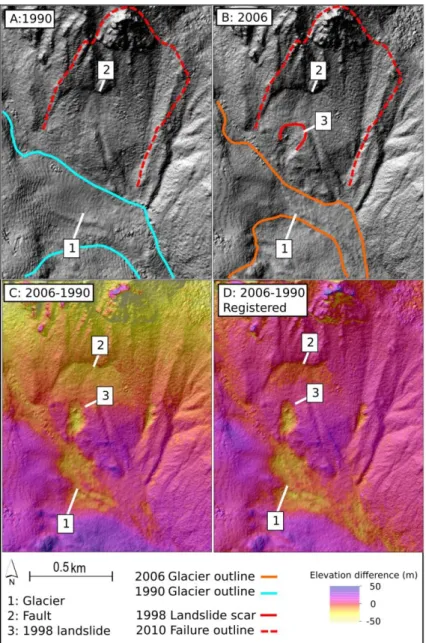
datasets without further processing. ... 30 Figure 2.3. Comparison of 1990 and 2006 datasets for the pre-2010 failure slope.
A)Shaded relief model of the 1990 DEM. Glacier outline, the 2010 failure, and a major fault associated with the 2010 failure are indicated. B) Shaded relief model of the 2006 DEM. Glacier outline, 2010 failure, 1998 landslide scar, and major fault are indicated C) 2006-1990 DoD, note the systematic yellow to purple transition from the top to the bottom of the figure, indicating tilting between the two DEMs. Glacier, 1998 landslide scar and fault are indicated. D) 2006-1990 DoD after CloudCompare registration. The systematic tilting is corrected and the elevation difference in stable areas is 2 m. Glacier mass loss, 1998 scar and displacement along the fault are visible in the DoD. See Chapter 4 for the description of the 2010 slope deformation prior to the collapse. ... 31 Figure 2.4. Comparison of 195 and 1990 datasets for Devastation Valley. A) Shaded
relief model of the 1951 DEM. B) Shaded relief model of the 1990 DEM. C) DoD after CloudCompare registration. Glacier frontal retreat (1), the 1975 landslide scar (2) and glacier thickening (3) are visible. The
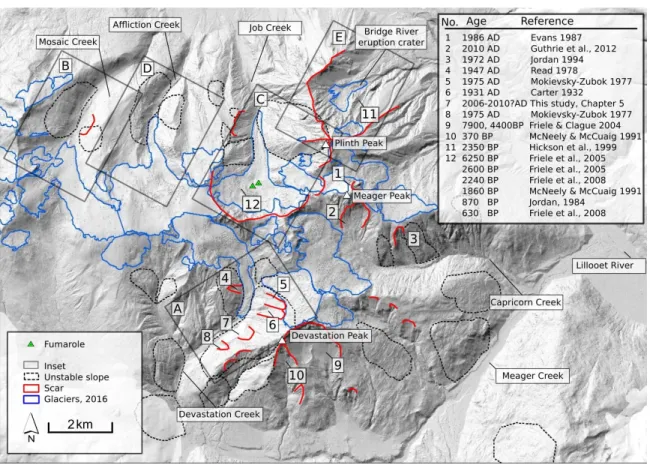
elevation difference between 1951 and 1990 DEMs in stable areas is 10.6 m. Note the artificially rough surface in the 1951 DEM. ... 32 Figure 2.5. Overview of the Mount Meager volcanic complex showing 2016 glacier
extent, landslide scars with reference study, unstable areas, and figure locations. Inset A) Figure 2.6. B) Figure 2.7. C) Figure 2.8. D) Figure 2.9. E) Figure 2.10. ... 33 Figure 2.6. Devastation Valley from 1947 to 2016. Glacier outlines, moraines,
landslide deposits, scars, and scarps are indicated. A) 1947: glacier at its maximum extent, note the 1947 landslide deposit. B) 1962: glacier has carried the 1947 landslide deposit to form an arched moraine back from the terminus of the glacier. C) 1973: while the debris-covered front has receded the landslide debris/moraine has advanced further. D) 1981:
glacier front has receded and a new moraine formed from the 1975 landslide debris. Note the 1975 landslide scar. E) 1990: glacier front has receded, note the arched moraine from the 1975 landslide debris. F) 2006: glacier has receded. G) 2016 (Lidar data): glacier has receded further. H) 2016 (Lidar data) with glacier outlines. I) Change in the glacier front position over the photo period. Years in x-axis and metres from the reference line in the y-axis. Note the decrease of recession during 1962-1973 and 1981-2006 periods... 35 Figure 2.7. Mosaic valley from 1951 to 2016 period. Glacier outlines, landslide
deposits, scars, and scarps are indicated. The glacier has been retreating since 1951. A) 1951. B) 1962. C). 1964: note the lateral moraine collapse on the glacier. D) 1973. E) 1981.F) 1990. G) 2006: note that the landslide deposit has been eroded away. H) 2016 Lidar data. I) 2016 Lidar data and glacier outlines. J) Change in the glacier front position over the photo period. Years in x-axis and metres from the reference line in the y-axis. 38 Figure 2.8. Job valley from 1947 to 2016. Glacier front, unstable slopes landslide
scars, landslide deposits and fumaroles are indicated.The glacier
retreated in the 1947-1964 period, advanced between 1964 and 1981 and retreated between 1981 and 2016. A) 1947: note the dark spot on the glacier marking the fumarole position. B) 1951. C) 1962. D) 1964. E) 1973. F) 1981. G) 1990: note debris on glacier. H) 2006. I) 2016 Lidar J) 2016: Lidar and glacier outlines. K) Summary of changes of glacier front position over the photo period. Years in x-axis and metres from the
reference line in the y-axis. ... 40 Figure 2.9. Affliction valley, 1947-2016. Glacier front and unstable slopes are shown.
Note constant debris cover on the west side of the glacier. The glacier retreated in the 1947-1964 period, advanced between 1964 and 1981, and retreated between 1981 and 2016. A) 1947. B) 1951. C) 1962. D) 1964. E) 1973. F) 1981. G) 1990. H) 2006. I) 2016 Lidar. J) 2016 Lidar and glacier outlines summary. K) Changes in the glacier front position over the photo period. Years in x-axis and metres from the reference line in the y-axis. ... 42 Figure 2.10. Bridge River Glacier, 1951-2016. Glacier outlines and
eruptioncrater/landslide scar are indicated. The glacier advanced
between 1951 and 1990, retreated between 1990-2006, and readvanced in the 2006-2016 period. A) 1951. B) 1962. C) 1964. D) 1973. E) 1981. F) 1990. G) 2006. H) 2016 Lidar. I) Lidar 2016 with glacier outlines. J) Changes in the glacier front position over the period of the photographic record. Years in x-axis and metres from the reference line in the y-axis. 44 Figure 3.1. Mount Meager area (British Columbia) (geology after Read 1979),
showing margins of the Mount Meager 2010 landslide, the locations and durations of the landslide dams, and the five deposit areas discussed in the paper. The locations of the lithology transects are shown by red lines. Inset map shows the location of the study area in western Canada (BC— British Columbia). ... 55 Figure 3.2. Map of Mount Meager landslide deposits and structures. Also indicated
are locations of photographs shown in other figures. Numbers in circles identify the five deposit areas. ... 58
Figure 3.3. Photographs of typical Mount Meager landslide deposit facies. White arrows indicate flow direction. (A) Block facies. (B) Contacts between mixed facies (a), sheared block facies of gray rhyodacite (b), and sheared block facies of red rhyodacite (c). Hammer is ~30 cm. (C) A coherent but highly brecciated block (a) disaggregated by shear to form sheared block facies (b). The surrounding material is mixed facies (c). (D) Woody debris facies. (E) Aerial photograph of the debris avalanche deposit in Lillooet River valley taken the morning after the event, before the dam on Meager Creek breached (photo courtesy of D.B. Steers). ... 60 Figure 3.4. Sand-silt-clay ratios of samples of the Mount Meager debris avalanche
matrix. Fields indicate the 12 classes of soil textural classification (Soil Survey Division Staff 1993). ... 62 Figure 3.5. Photographs of typical structures in the Mount Meager landslide debris.
White arrows indicate flow direction. (A) Compressional ridges (hammer ~30 cm). The black lines show thrusts separating compressional ridges of gray rhyodacite and cream-colored, altered sheared block facies. (B) Panoramic view of a shear zone (circled person for scale). The red line marks a strike-slip fault; the white dotted lines highlight lithological
markers that show the displacement along the fault. A graben is visible in the foreground. (C) View down Lillooet River valley showing extensional features in the plug; normal fault scarps are indicated by white lines. The graben in front of the circled standing person is perpendicular to the flow direc- tion. Note the runup on the valley side. (D) Normal fault trace exposed in section. White dotted lines here indicate lithological markers. The shovel is 1.5 m in length. ... 64 Figure 3.6. (A) Sketch of the Meager barrier (area 1) based on a photograph taken
before the dam breach, showing compression. (B) Sketch of the barrier area after the dam breach. The limit of the debris avalanche and lower debris lines on the valley side are marked: 1—high lineament caused by runup of the first pulse; 2— debris line left by the bulk of the mass flowing toward Lillooet River valley; 3— debris line left by runup and collapse of Meager barrier debris. Arrows indicate the direction of movement. Photos courtesy of D.B. Steers. ... 67 Figure 3.7. (A) Orthophoto of the Capricorn Creek fan (part of area 2 of the Mount
Meager landslide), showing unit a and unit b (the latter a product of three lobes: b1, b2, and b3). (B) Orthophoto of the central portion of the terrace tread showing unit a (water-rich flow deposit) and unit b (intermediate-water-content phase). The latter supports hummocks and deformation structures. Ridges indicate compressional motion against the valley side. (C) Panoramic view of the terrace scarp, debris trimlines, and
post-depositional sloughing (person in the circle at lower right for scale). Image courtesy of C.-A. Lau. ... 70 Figure 3.8. Orthophoto of the plug area, Mount Meager landslide (area 3). Structures
indicate different stress regimes: extension (light blue) at the west corner of the plug; shear (purple) in the central part and at the sides; and
compression (red) at the front and between the two lobes. Box indicates location of Appendix B, Figure B8, which shows structures and
Figure 3.9. (A) Orthophoto of the distal part of the Mount Meager landslide deposit upstream of the unaffected Forest Service campsite (area 4), showing units a and b. Location of B is shown. (B) Partially buried terrace scarp showing the boundary between units a and b. ... 77 Figure 3.10. (A) Orthophoto of the distal part of the Mount Meager landslide deposit
downstream of the unaffected Forest Service campsite (area 5) showing units, hummocks, shear zones, and the direction of movement. Location of B is shown. (B) Contact between thick hummocky debris (unit b) and the discontinuous debris veneer with small hummocks (unit a). ... 79 Figure 3.11. Top: Summary sketch map showing the distribution of water-rich and
water-poor deposits of the Mount Meager landslide. Bottom: Flow chart summarizing the correlation between rheology phases, areas, and deposits. The water-rich phase produced the high debris line at the Meager barrier and deposited unit a in the terrace, distal up, and distal down areas. There are no traces of the water-rich phase in the plug area. The water-poor phase produced the lower debris line at the Meager barrier and left the thick body of debris in that area. It left the debris lines on the terrace scarp and unit b (lobes b1 and b3) on the terrace fan and in the distal up and distal down areas. The plug was also deposited by the water-poor phase. Unit b on the terrace tread and lobe b2 on the terrace fan are interpreted as deposited by an intermediate-water-content phase. ... 80 Figure 3.12. Rheology end-member deposits, Mount Meager landslide. (A) Thick
debris, hummocks, and faults of the water-poor phase in area 3. The red line marks strike- slip faults; the white dotted lines delineate block and sheared block facies. (B) Woody debris and dead trees of the water-rich phase downstream of the unaffected Forest Service campsite. White arrow indicates the direction of movement. ... 82 Figure 3.13. Conceptual diagram showing stages in the evolution of the Mount Meager debris avalanche. (1) The south flank of Mount Meager fails. (2) The rock mass breaks up, spreads, and liquefies as it begins to accelerate down Capricorn Creek valley. Water escapes from beneath the debris
avalanche, forming the advance water-rich phase (blue line); the bulk of the mass, in comparison, is relatively dry (red line). Although the two phases interact, they follow different paths and leave separate deposits. (3) Both phases achieve very high velocities before impacting the south valley wall of Meager Creek. They decelerate as they spread up and down Meager Creek and into Lillooet River valley. (4) Final deceleration and cessation of flow. ... 84 Figure 3.14. Schematic diagram showing the evolution of the Mount Meager debris
avalanche with inferred rheological behavior. (A) At initiation, the
collapsed material behaves as a single phase. (B) The water-rich phase forms as the debris avalanche moves down the valley of Capricorn Creek. Upon reaching Meager Creek, it runs 270 m up the south valley wall. (C) It then flows both up and down Meager Creek valley. (D) The water-rich phase travels farther than the water-poor phase. The latter leaves a thicker deposit, which displays deformation structures that develop during final emplacement. d. aval.—debris avalanche; hyperc.—
Figure .4.1. Location map and geology of Mount Meager volcanic complex (geology after Read 1978). Also shown is the headscarp and deposit of the 2010 landslide, as well as other gravitational instabilities in the area. Inset map shows the location of Mount Meager. ... 93 Figure 4.2. Change in extent of Capricorn Glacier over the period of the photographic
record. Note the readvance of the glacier that culminated around 1981, followed by rapid retreat to the present. Black lines delineate error bars. ... 97 Figure 4.3. Maps of the head-scarp area of the 2010 landslide from 1948 to 2006.
Locations of the margin of Capricorn Glacier through time, the outline of the 2010 headscarp, and faults are shown. A) 1948: Major faults are already present. B) 1964-1965. Diffuse deformation at the toe of the slope. C) 1973: A large portion of the slope toe (~1.5 x10⁶ m3) has been removed by erosion, and major and minor faults have expanded. D) 1981: Snow covers most of the area. Capricorn Glacier is at its maximum 20th century extent. E) 1990: Diffuse deformation and some bulging at the toe of the slope. F) 2006: Diffuse deformation, bulging, the scar of the 1998 landslide, and the source area of the 2009 event. ... 99 Figure 4.4. Topographic cross-sections of the flank of Mount Meager in 1948, 1990,
2006, and 2010. Note major faulting, sagging, and bulging of the toe of the slope in the lead-up to the 2010 landslide. Arrows show relative directions of motion. ... 101 Figure 4.5. A) Flank of Mount Meager four years before the collapse in 2010
(modified from Delcamp et al. 2016), showing the head scarp of the landslide, failure domains, directions of collapse, faults, and the terminus of Capricorn Glacier. 1) First failure: direction of movement 191°; volume 24.6 x10⁶ m3. 2) Second failure: direction of movement 217°; two pulses about 20 seconds apart; volume 13.8 x10⁶ m3. 3) Third failure: direction of movement mainly vertical; 40 seconds after the two main failures; volume 9.0 x10⁶ m3. 4) Fourth failure: direction of movement mainly vertical towards the SE; two minutes after the third failure; volume 5.6 x10⁶ m3. Movement directions and timing from Allstadt (2013). B) Headscarp of 2010 landslide after the collapse (modified from Delcamp et al. 2016), showing bedrock units described in the paper. C) Pre-and post-failure cross-sections of the source area. m.asl = metres above sea level. ... 103 Figure 4.6. Daily maximum temperature and daily total precipitation at Pemberton
over the period 1 July –10 August 1975, 1998, and 2010 in relation to landslides (modified from Bovis and Jakob 2000). The 1975, 1998, and 2010 landslides happened after sustained summer heatwaves. No significant precipitation is recorded during the three periods. Max T maximum daily temperature, Ppt precipitation. ... 105 Figure 4.7. Continuing instability on the Mount Meager massif. A) East flank of
Devastation Creek valley. B) West flank of Plinth Peak. C) West flank of Affliction Creek valley. ... 109 Figure 5.1. Overview of the Mount Meager volcanic complex, showing glaciers, ice
loss, fumaroles, past landslides, unstable slopes. A) Figure 5.2. B) Figure 5.3. C) Figure 5.4. D) Figure 5.5. ... 114
Figure 5.2. Job Creek valley (Inset A, Figure 5.1), showing past and present glacier outlines, unstable slopes, fractures, and fumaroles. SqueeSAR
displacement data, and DInSAR deformation map are also shown. The volume estimate of the unstable slopes is 108-109 m3. ... 116 Figure 5.3. Mosaic Creek valley (Inset B, Figure 5.1), showing past and present
glacier outlines, unstable slopes and fractures. SqueeSAR displacement data, and DInSAR phase difference are also shown. The volume estimate for the unstable west and east flanks is 108-109 m3. ... 118 Figure 5.4. Affliction Creek valley (Inset C, Figure 5.1), showing past and present
glacier outlines, unstable slopes, fractures, SqueeSAR displacement data, and DInSAR phase difference. The volume estimate is of 108-109 m3 and 107-108 m3 for the west and east flank. ... 120 Figure 5.5. Inset D in Figure 5.1. The Devastation Creek valley showing past and
present glacier outlines, unstable slopes, fractures, SqueeSAR
displacement data, and DInSAR deformation map. The volume estimate is of 108-109 m3. LOS = line of sight. ... 123 Figure 6.1. Job Valley, Plinth Peak, and the 2360 cal yr BP eruption crater. Scars,
unstable slopes, landslides, eruption deposits, photos, fumaroles, sample, and profile locations are indicated. A) Figure 6.2. B) Figure 6.3. C) Figure 6.4. D) Figure 6.5. E) Figure 6.6. ... 133 Figure 6.2. The west flank of Plinth Peak. Little Ice Age (LIA) and 1981 glacier limits,
lower and upper zone of deformation are outlined. Note fumaroles ice caves in the foreground. ... 135 Figure 6.3 Stress field before and after the collapse. The oblique line separates
volcanc to the left and basement rocks to the right. The change in
effective stress after the collapse would be up to 4 MPa and would reach a depth of 6 km. ... 135 Figure 6.4. A) Panoramic view of debris avalanche outcrop on the Lillooet River. Red
line indicates the source and red arrow indicates the avalanche path. B) Outcrop Detail. C) Detail on the lithologies: a, flame of yellow debris, b red debris, and c gray debris. ... 136 Figure 6.5 Panorama of the amphitheatre shaped collapse scar from the west flank
of Plinth. The red line shows the collapse scar, the yellow dashed line the approximate location of the contact of the volcanic and the basement rocks (after Read 1978). The blue arrows indicate the fumaroles and ice caves. The red arrows show fractures on the west flank of Plinth. Person in circle as scale. Note the yellow altered rocksleft of the fumaroles. Image courtesy of H. Wong. ... 137 Figure 6.6. Core sample from the landslide deposit near the Job Creek and Lillooet
River intersection. Note the 2360 cal yr BP eruption pumice separated from the landslide diamicton by sand and humic stains. ... 138
Chapter 1.
Introduction
1.1. Introduction
Mount Meager is a glacier-clad and unstable volcanic massif in British Columbia. Mount Meager has been the site of a recent (2360 cal yr BP ) eruption, has had many large landslides originating from its flanks, has an active hydrothermal system, and is presently covered by retreating glaciers. Ongoing deglaciation and high landslide frequency make Mount Meager a perfect case study of landslide processes from a glaciated volcano. The presence of communities and economic activities near the volcano mark the urgency and need for a better understanding of the hazards from Mount Meager.
Studies of Mount Meager have focused either on the volcanological perspective (geochemistry, eruptive styles, etc.) neglecting geotechnical aspects (slope stability, debris flow hazards etc.) or from a geotechnical approach neglecting the volcanological point of view. The glacial history, present day glacial retreat and impacts on the stability of the mountain have also been understudied. The knowledge fragmentation negatively impacts the understanding of the hazard as well as hazard and risk communication to the general public. The different levels of the Canadian government as well as Canadian citizens are generally unaware of the presence of volcanoes and of volcanic hazards in Canada. Political and social unawareness of the hazards manifests in the lack of a consistent volcanic hazard assessment and monitoring that exposes the population to an unacceptable risk. This thesis aims to bring together volcanological, geomorphological and geotechnical approaches to the study of Mount Meager volcano for a better hazard and risk understanding.
1.1.1. Mount Meager and the Garibaldi Volcanic Belt
Mount Meager is a Quaternary, glacier covered, volcanic complex located in Southwestern British Columbia, Canada. It is about 150 km north of the city Vancouver and 65 km from the closest town Pemberton. Mount Meager is part of the Garibaldi Volcanic Belt, which is north of the Cascades volcanic arc. The Garibaldi belt stretches 150 km, includes three major stratovolcanoes, Mount Meager, Mount Cayley, and Mount
Garibaldi, and numerous smaller monogenetic volcanoes (Wilson and Russel 2018). The Garibaldi Volcanic Belt differs from the Cascades in several ways. The Garibaldi
Volcanic Belt magmatism is younger (5-15 Ma) than the Cascades (35 Ma), and is related to a hotter subducting plate that resulted in lower eruption rates and narrower arc width (Harry and Green 1999; Mullen et al. 2013; Mullen et al. 2018). With lower eruptive rates, the Garibaldi Volcanic Belt volcanic edifices are relatively small and sit on igneous and metamorphic basement ridge crests (Wilson and Russel 2018) (Figure 1.1). The Cascades volcanoes, on the other hand, created significant landscape morphology, building large stratocones with thousands of metres of relief. The Cordilleran Ice Sheet has affected volcano morphologies in the Garibaldi Volcanic Belt (Wilson et al. 2016; Wilson and Russel 2017, 2018) while the Cascades have only been affected by local ice caps and were not covered by the Cordilleran Ice Sheet (excluding, partially, Mount Baker).
Figure 1.1. Map of the Pacific Northwest: Mount Meager, circled in red, the Garibaldi Volcanic Belt, circled in blue, the Cascade Volcanic Arc circled in green, and the Cordilleran Ice Sheet extent in black dashed lines. Note the smaller extension of the Garibaldi Volcanic Belt compared to the Cascade Volcanic Arc, and the boundary of the Cordilleran Ice Sheet, shortly after the Canada-US border. Modified from Wilson and Russel 2018.
1.1.2. Mount Meager landslides and the last eruption
The local relief of Mount Meager is 2200 m, with the peaks about 2700 m asl and the valley bases around 500 m asl. The lower part of the mountain is made of
metamorphic and igneous basement and only the upper 600 m are volcanic rocks. The volcanic sequence is comprised of pyroclastic rocks, basaltic-andesitic lava flows and rhyodacite domes (Read 1978, 1990). There is widespread hydrothermal alteration and active hot springs and fumaroles.
Mount Meager last erupted 2360 cal yr BP (Clague et al. 1995; Hickson et al. 1999), and is the epicentre of shallow earthquakes (Friele et al. 2008). A minimum of two hydrothermal events affected the area; an ancient hydrothermal event caused propylitic alteration of the basement rocks and the present system deposited sphalerite, pyrite, clays, carbonates and chlorite in basement and volcanic rocks (NSBG 1985). The recent hydrothermal system manifests as hotsprings and fumaroles (Venugopal et al. 2017). The area has been repeatedly glaciated during the Pleistocene and today Mount Meager hosts alpine glaciers and snow fields. The high relief, hydrothermal alteration, and glacial modification conditions the slopes for failures, leaving the volcanic edifice and the
underlying basement rocks in a state of instability.
Mount Meager has been the site of numerous large landslides in the Holocene, along with almost annual smaller events (Figure 1.2). Many studies have focused on mass movements from Mount Meager, documenting catastrophic landslides, slow slope deformation, debris flow and landslide activity following the Little Ice Age glacial retreat (Carter 1932; Mokievsky-Zubok 1977; Jordan 1994; Jakob 1996; Bovis and Evans 1996; Evans 1987; Bovis and Jackob1998; Bovis 1990; Holm et al. 2004; Friele and Clague 2004; Guthrie et al. 2012a, b, Hetherington 2014). The Lillooet River is the main drainage system of the Mount Meager volcanic complex. Studies have focused on the sedimentary record in the Lillooet valley by correlating debris flows and
hyperconcentrated flow deposits with the major landslide events from Mount Meager (Simpson et al. 2006; Friele at al. 2008)and determining flood plain aggradation and delta-front progradation following these sediment pulses (Jordan and Slaymaker 1991; Friele et al. 2005).
Figure 1.2. Rock avalanches (arrows) at Mount Meager in summer 2018. A) Job Valley. B) Devastation Valley.
The high frequency and magnitude of mass movements at Mount Meager lead Read (1978, 1990) to call it the most landslide prone area in Canada. The major hazard from Mount Meager has been argued to be from landslides rather than direct volcanic activity (eruptions, pyroclastic flow, ash fall or lava flow) (Stewart 2002; Friele et al. 2008). In the case of the 2360 cal yr BP eruption, Hickson et al. (1999) and Andrews et al. (2014) show that secondary eruptive effects, such as river damming and subsequent catastrophic outburst flood, had more widespread impact than the volcanic eruption itself. The 2360 cal yr BP eruption with a Volcanic Explosivity Index (VEI 4), lasted weeks to months and consisted of an initial sub-Plinian explosive phase that transitioned into a Vulcanian phase (Satsiuk et al. 1996; Hickson et al. 1999; Andrews et al. 2014). Welded pyroclastic material blocked the river and formed a lake with a volume of 0.25-1.0 109 m3 that catastrophically drained (Satsiuk et al. 1996; Hickson et al. 1999; Andrews et al. 2014). Deposits from hyperconcentrated flows have been found in drill cores 42-47 km downstream from the volcano and have been interpreted to be the outburst flood deposits (Friele et al. 2008). The eruptive products are underlain and overlain by landslide deposits not directly related to the eruption (Hickson et al. 1999).
1.1.3. Glacier, landslides and volcanoes
An increase in landslide activity can be linked to deglaciation and permafrost degradation (Deline et al. 2015). Glacial erosion removes the support on slopes and glacier cycles repeatedly change the state of stress of slopes, conditioning them for catastrophic collapses (Grämiger et al. 2017). Permafrost thaw, which affects the water circulation and the mechanical behaviour of rock and debris, leads to a decrease in slope stability and an increase in the rock fall frequency and magnitude (Gruber and Haberli 2007; Krautblatter et al. 2013; Dreabling et al. 2017). Numerous studies have documented slope instabilities from deglaciation in high mountains regions (Evans and Clague 1994; Huggel et al. 2008; McColl and Davies 2013; Deline et al. 2015), others have documented landslides from glaciated volcanoes (Vallance and Scott 1997; Holm et al. 2004; Huggel et al. 2007a, b; Ball et al. 2018), but few have studied the effect of ice loss and thermal regime perturbations on the stability of volcanic edifices (Huggel 2009).
Volcanoes add a degree of complexity to the understanding of the effects of ice loss and permafrost degradation on landslide activity. Volcanoes are dynamic
environments where deep magmatic and tectonic processes as well as surficial
geomorphic process are linked and have rapid effects on the edifice stability. The time-scale of volcano edifice construction can be as short as few days (Pioli et al. 2008); the rapid volcanic and volcanoclastic deposit emplacement contributes to edifice instability. When a volcano grows in a glacial environment the instability is compounded. Lava and ice interaction causes rapid cooling and quenching of volcanic rocks. Water availability from glaciers can increase the fragmentation of erupted material and can enhance hydrothermal circulation and rock alteration (Edwards et al. 2015; Barr et al. 2018b). These phenomena lead to the construction of an even weaker volcanic edifice making glaciated volcanoes especially prone to failure (Vallance and Scott 1997; Huggel et al. 2007a).
Slope failures in both volcanic and non-volcanic glaciated environments generate complex, long runout landslides (Evans and Clague 1994; Deline et al. 2015). Unstable rock and debris slopes catastrophically fail, and commonly transform from rock slides, or rotational landslides into rock or debris avalanches and debris flows (Scott et al. 2002; Geertsema et al. 2006). Kinematic transformations and long landslide runout are related
to the availability of water contributing to the decrease of internal and bed friction angles. In the case of volcanic landslides, the flow transformation and runout is enhanced by the high percentage of fines (Vallance and Scott 1997; Scott et al. 2002; Friele and Clague 2004). The fine particles come from the primary fine grained volcanoclastic material and the subsequent hydrothermal alteration. The combination of water availability and poor geomechanic rock quality make landslides from glaciated volcanoes among the most far-reaching and deadly sub-aerial mass movements (Major and Newhall 1989; van Wyk de Vries and Delcamp 2015).
1.1.4. Hazard and risk at Mount Meager volcano
Volcanoes are sources of multiple hazards, directly from eruptions (lava flow, pyroclasic flows, ash fall, etc.) or indirectly, with mass movements from the volcanic edifices (debris avalanches, lahar, etc.). One of the most deadly volcanic event in the 20th century was a lahar from Nevado del Ruitz volcano in Colombia. The volcanic debris flow, generated form ice and snow melt following an eruption onto a glacier, killed more than 22,000 people (Herd et al. 1986). Volcanic landslide hazard has been recognized at other volcanoes, including the Cascade volcanoes such as Mount Rainier, where
extensive hazard and risk studies have been done by the United States Geological Survey (USGS) (Vallance and Scott 1997; Wood and Soulard 2009; Waythomas 2014; Bell et al. 2018). At Mount Meager, despite the numerous hazards studies, only Friele et al. (2008) assessed the risk from large landslides while Stasiuk et al. (2003) presented a synthesis ofvolcanic hazard in Canada and a quantitative analysis for Mount Cayley volcano. At present, there is the lack of a comprehensive hazard and risk assessment at the Mount Meager volcano.
Along with hazard and risk analysis, effective communication to the local stakeholders is of vital importance. Nevado del Ruiz is a sad example of poor
communication between the scientific community and the general public. The hazard was known and so was the risk, but the scientific community was not able to effectively communicate the risk to the local authorities, such that no evacuation occurred (Voight 1990). At Mount Meager both economic activity and resident population are increasing in the proximity of the volcano; the combined lack of a consistent monitoring program and effective risk communication to the local communities could be disastrous.
1.2. Methods
We used field, state-of-art, and innovative remote sensing methods to document slope stability, landslide emplacement dynamics and glacial retreat at Mount Meager volcano. We collected available topography data including digital elevation models (DEM) and satellite imagery, historic aerial photography, oblique helicopter photography, and airborne Lidar. We produced orthophotos and DEMs applying Structure from Motion (SfM) photogrammetry to historic airphotos. We calculated DEMs of Difference (DoD) to evaluate landslide volumes and glacier mass changes. We mapped geomorphic features and rock and sediment types both remotely and in the field. We collected rock and debris samples to characterize the 2010 landslide deposit and emplacement dynamics. We applied satellite InSAR for slope displacement monitoring. Specific methods are presented in each chapter. We discuss here the SfM background as it is a novel technique, and we will briefly give an overview of Lidar and InSAR technologies.
1.2.1. Photogrammetry and Structure from Motion
Historical aerial photography offers the opportunity to document decades of topographic changes, however the full potential of historic airphotos has been hindered by technological limitations. Today's advancement in photogrammetry and computing vision led to the Structure from Motion (SfM) revolution in the geosciences. SfM offers a cost and time-effective alternative to classic photogrammetry, allowing fast and high-resolution three-dimensional topography reproduction for a full exploitation of archival data.
Photogrammetry
Photogrammetry is an early discipline that evolved together with technological advancements in photography, aviation, and computers (Schenk 2005).
Photogrammetry has evolved from analogue, to analytical and, in recent years, to digital photogrammetry (Gomarasca 2009;Linder 2009). Ever since the invention of
photography, retrieving quantitative information with photographs has been pursued. At the beginning of the 20th century, the stereo plotter was invented and during the First World War, aerial photogrammetry was developed and refined. In the same period, the basic practice for aerial photogrammetry was established as well as the mathematical
theory of the technique. This was the time of ―analogue photogrammetry‖: analogue methods were used to retrieve precise information from the photographs. In the 1960's, the technique evolved to ―analytical photogrammetry‖ with the invention of the analytical plotter: the restitution process was partly numerical and partly analogue. The evolution of computers and advent of digital photography brings us to the present ―digital
photogrammetry‖ era. Analogue cameras have been largely replaced by digital cameras but the workflow still relies on the analogue framework; digital image matching
algorithms require manual intervention to satisfy the required precision.
In the aerial photogrammetry survey workflow, nadiral overlapping stereo-airphotos are acquired on strips in parallel trajectories from an aircraft flying at constant altitude (Gomarasca 2009). The airphotos are acquired by a survey-grade metric camera and the area of interest is covered with the smallest number of overlapping images (60% lateral, 20%vertical). The definition of ground control points (GCP) is necessary in order to solve the collinearity equation and retrieve the real world coordinate position of surface features (Wolf and Dewitt 2000), then image matching and semi-automated aerial triangulation algorithms are used to build the three-dimensional geometry and produce an orthophoto and DEM. Commonly, photogrammetric software packages are costly and rely on relatively old image matching methods. These software packages generally apply feature-based image matching algorithms (Haala et al. 2014) that match only selected points at high accuracy but they suffer in areas of poor image texture (Haala and Rothermel 2012). Today, photogrammetry software packages are moving into more modern image matching algorithms and some of them can resolve the three-dimensional geometry of object prior to the introduction of GCP (Fonstad et al. 2013).
Structure from Motion - Multi-view stereo
SfM is commonly seen as an advance in photogrammetry, but there are basic conceptual differences. SfM finds its roots in the field of computer vision where the aim is to get machines to understand scenes through the automatized reconstruction of the three-dimensional geometry of objects (Szeliski 2010); precision and geolocation are not a priority.