ANALYSIS OF HYDRAULIC HYBRID VEHICLES
AND ECONOMICAL COMPARISON WITH HYBRID
ELECTRIC VEHICLES
Yannick Louvigny
1, Jonathan Nzisabira
2, Pierre Duysinx
31Université de Liège, A & M, Chemin des Chevreuils 1, bat B52, B-4000 Liège – yannick.louvigny@ulg.ac.be 2Université de Liège, A & M, Chemin des Chevreuils 1, bat B52, B-4000 Liège – jnzisabira@student.ulg.ac.be
3Université de Liège, A & M, Chemin des Chevreuils 1, bat B52, B-4000 Liège – P.Duysinx@ulg.ac.be
EET-2007 European Ele-Drive Conference
Brussels, Belgium, May 30 – June 01, 2007
ABSTRACT
Hybrid Hydraulic Vehicle (HHV) technology is an alternative to HEV. This technology deserves new attention because of recent development in reversible hydraulic motor pumps with high efficiency. The HHV technology is based on parallel architecture of motor assist systems. A first preliminary study investigated the fuel consumption of a passenger car, a SUV and an urban bus. It clearly demonstrated that the fuel efficiency benefits are the better for heavy vehicles with frequent stops and starts. The second part of the work then compared both HEV and HHV buses. The fuel consumption is simulated using ADVISOR on the basis of 3 SORT driving cycles. The results showed that the HHV are penalized by his weight but they can be economically interesting because of the lower cost and longer lifetime of the hydraulic system.
Keywords: Energy storage, pumps, bus, HEV, simulation.
Nomenclature
Cd ; HEV;HHV;ICE;L;NEDC;NYCC;SOC;V
1
Introduction
In the framework of CO2 emission reduction
from the transport sector and given the ever growing demand for more fuel efficient road vehicles, there has been an increased interest in alternative powertrain layouts. Among them, Hydraulic Hybrid Vehicle (HHV) technology is considered as a competitive alternative to the more conventional Hybrid Electric Vehicle (HEV) technology as already found on roads today (Toyota Prius, Lexus RX-400H, etc.). In general, a vehicle is considered as hybrid when it has more than one power source. This means that in addition to its primary energy source (most of the time the chemical energy of
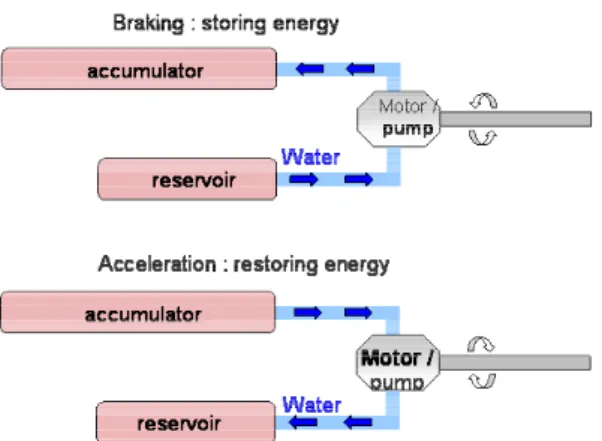
the fuel), the vehicle is also equipped with an additional energy storage system [1]. In a HHV, the additional storage consists of pressurized oil or water. The hydraulic circuit is composed of a low pressure reservoir, a high pressure accumulator and a reversible hydraulic machine operating in two modes, motor and pump. The basic principle of a HHV is shown on figure 1: during braking phases, water or oil is pumped from the reservoir to the high pressure accumulator (the hydraulic machine is working as a pump). This energy stored is then used by emptying the accumulator through the hydraulic machine (working as a motor) when needed. The starting point of this study was the evaluation of a new type of reversible hydraulic motor/pump with very low drag at neutral point. The machine was based on a novel concept of machines that is even able to work with a non lubricant fluid like water.
Figure 1: Basic principle of a HHV
The first goal of the study was to identify the potential benefits and/or disadvantages associated to HHV technology taking advantage of the novel hydraulic motor pump. We conducted the study for three different vehicles, namely a C-segment passenger car (e.g. Opel Astra, VW Golf, Renault Mégane, etc.), a Sport Utility Vehicle (SUV) and an urban bus, whose characteristics are given in Table 1.
Table 1: Vehicles characteristics
C-Seg. SUV Bus
Engine Diesel Gasoline Diesel
Pmax [kW] 56 102 205
Cd 0,31 0,41 0,45
S [m²] 1,98 3,06 5,88
L [m] 4,2 4,57 12,04
Mass [kg] 1235 1785 15281
The second objective was to make a complete technical and economical comparison between a HEV and a HHV for the types of vehicle that show some potential interest in the first part of this study, i.e. heavy urban vehicle.
2
Modelling
2.1 Powertrain layout
In this study, the hydraulic pump/motor system is only used to provide power assist during vehicle acceleration and to recover energy during vehicle braking (this kind of vehicle is often referred to as a “mild” hybrid). Because of the very low drag of the hydraulic motor pump at neutral, the parallel hybrid configuration shown in figure 2 is perfectly suited for the study. The hydraulic machine can be connected
directly and permanently to the powertrain shaft between the internal combustion engine (ICE) and the wheels without requiring any clutch system.
Figure 2: Powertrain layout
2.2 Hydraulic
motor/pump
The University of Liège has recently carried out researches about a new type of reversible hydraulic machine that is characterised by a very low drag at neutral as well as the possibility to use water as working fluid [5]. As this particular type of hydraulic machine is still under development, we estimated the expected characteristics from the characteristics of similar available machines. These machines of reference are the Parker pumps of P2 and P3 series. They are perfectly suited to mobile application thanks to their low volume and relatively low noise and mass [6].
2.3 Accumulators
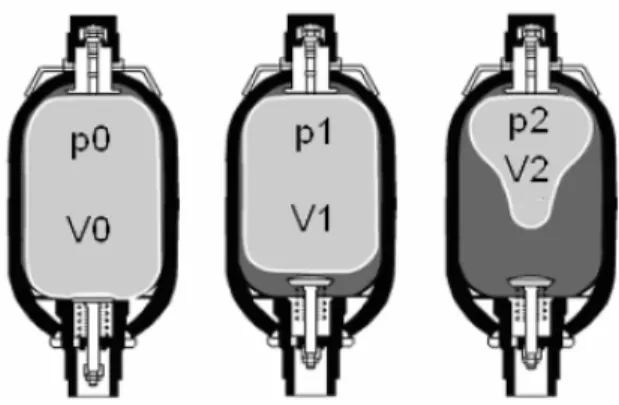
In a HHV, the energy is stored in hydraulic accumulators that work by compressing an inert gas (generally Nitrogen) separated from the working fluid by a membrane or a piston. There are three different types of hydro pneumatic accumulators:
- bladder-type, - membrane-type, - piston-type,
respectively numbered (1), (2) , (3) in figure 3. For automotive applications, which requires fast response and experience horizontal accelerations, we select the bladder-type accumulator because the working fluid selected is water. The same kind of accumulators has been used for the design of HHV in [2], [3] and [4].
Figure 4 shows the different states of the accumulator: 0 for the pre charge (p0 is taken
equal to 0.9*p1), 1 for the minimum pressure
state, for which the State Of Charge (SOC) = 0, and 2 for the maximum pressure state for which the SOC=1.
Figure 3: Hydro-pneumatic accumulators
Figure 4: Different states of the accumulator
The maximum volume of water that it is possible to store in the accumulator (dark surface on Fig 4) is given by equation (1).
⎥
⎥
⎥
⎦
⎤
⎢
⎢
⎢
⎣
⎡
⎟⎟
⎠
⎞
⎜⎜
⎝
⎛
−
⎟⎟
⎠
⎞
⎜⎜
⎝
⎛
=
−
=
∆
γ γ 1 2 0 1 1 0 0 2 1p
p
p
p
V
V
V
V
(1)V1 and V2 being the volumes occupied by the
gas inside the bladder. The maximum energy storage capacity of the accumulator is given by the compression work at constant temperature in Eq. (2).
∫
=
1 2 V VpdV
W
= RT ln(V1/V2) (2)For the bladder type accumulator, the maximum pressure admitted is typically [7,8] p2 = 345bar
and the minimum pressure is p1 = 125bar.
2.4 Reservoirs
The low-pressure accumulator is a reservoir of the same construction as the high-pressure accumulator. Its mass is however lower due to the use of a thinner wall resulting from the lower maximum pressure, 35bar in this case. In order
to avoid any inlet cavitation problem that may occur in any hydraulic system where a motor/pump system works reversibly, the minimum pressure selected is 5 bars.
3
Simulation
3.1 Overview
For each vehicle studied here (C-segment passenger car, SUV and bus), three models were developed:
- a reference model, i.e. the vehicle with a conventional ICE
- a mild HEV, with the same ICE as the reference vehicle
- a mild HHV, with the same ICE as the reference vehicle and the same energy control strategy as the one used in the HEV.
These three vehicles are simulated using ADVISOR (Advanced Vehicle Simulator) developed by the National Renewable Energy Lab (NREL). ADISOR was initially written to simulate HEV. The models of the conventional vehicles and of the HEV used in this study are simply already existing models available in ADVISOR library. For the modelling of HHV, the HEV models have been adapted to take care of the characteristics of the hydraulic system instead of an electrical one.
In order to obtain meaningful results, the three types of vehicle (C-segment, SUV and bus) are compared on driving cycles. Driving cycles are normalized trips that reflect everyday use. The velocity and gear ratio are specified in function of the time. The key is always on, even during stops, so that the vehicle is considered to accelerate and decelerate only.
Figure 5: New European Drive Cycle
For the C-segment vehicle and for the SUV, the New European Drive Cycle (NEDC) is selected (see figure 5) because it is the legal reference in
Europe. This drive cycle has two parts, the first one is representative of an urban cycle (this part is called the ECE15 drive cycle) and lasts about 780s, the maximum speed being 50km/h, whereas the second part simulates an extra urban cycle (EUDC drive cycle) and lasts about 400s with a maximum speed of 120km/h.
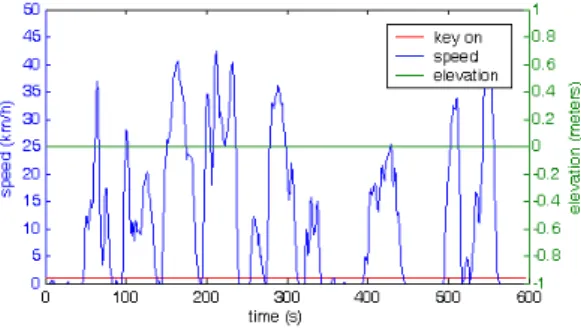
For the bus, very little driving cycles are available. New York City Cycle (NYCC) (see figure 6) which was selected in the first part of the study is one of these ones. The maximum speed is lower but the vehicle is subject to frequent start and stops with rather high acceleration levels.
Figure 6: New York City Cycle
3.2 C-segment
vehicle
3.2.1 Conventional vehicle
For a reference vehicle with an ICE engine (turbo diesel) and a mass of 1235 kg, ADVISOR simulation predicts a cumulative fuel consumption of 5.5L/100km on the NEDC. This fuel consumption is taken as the reference for the C-segment vehicle.
3.2.2 HEV
The mild HEV modelling is derived from the model of the Honda Insight directly available in ADVISOR. Indeed, the Honda Insight has exactly the same power-train layout as the one selected for this study (see Section 2.1). The characteristics of the vehicle were modified in accordance with the ones given in Table 1.
We kept the same algorithm of power management as the Honda Insight, but the values the model variables tuned in accordance with the characteristics of the virtual vehicle selected. This power management strategy allows for power assist from the electric machine during acceleration and for regenerative braking during deceleration phases, the ICE remaining the prime mover of the vehicle. In addition, under
well defined conditions (vehicle speed, battery state of charge, gear lever position, etc.), the power management algorithm turns off the ICE when the vehicle stops, thus saving the fuel that would normally be lost at idle.
Because of the electrical engine, the batteries and the electronic systems, the total mass of the HEV is equal to 1330 kg, a bit heavier than the ICE conventional vehicle. For this HEV, ADVISOR predicts a fuel consumption of 4.96L/100km.
3.2.3 HHV
As explained in Section 3.1, the modelling of HHV is based on the HEV one and on its power management strategy. Once again, the parameters of the model had to be modified to take into account the characteristics of the hydraulic system instead of the electric one. In particular, the sizing of the hydraulic accumulators was carried out in two different ways.
The first way is to choose the hydraulic accumulators in order to have the same energy storage capacity as the batteries of the HEV. In this case, the energy storage capacity is equal to 936Wh (3369.6kJ). Using equations (1) and (2) of Section 2.2, it is possible to find the volume of accumulators required to store 3369.6kJ. This gives a total volume of the accumulators V0 of
about 90 gallons (340L) and a volume of about 165L of water in the hydraulic circuit. As the selected accumulators have a capacity of 15 gallons each [8], the vehicle must be equipped with 6 accumulators that gives a total mass for the accumulators of 6x170kg=1020kg. The low pressure reservoir is sized based on the volume of water in the hydraulic circuit, with the minimum and maximum pressures given in Section 2.3. The calculations give a total volume of reservoirs V0 of about 64gallons (240L). As
the reservoir selected has a capacity of 13 gallons, a total of 5 reservoirs must be fitted in the vehicle, giving an additional mass of 5x52kg = 260kg. Hence, the total mass of the hydraulic circuit is equal to 1020kg+260kg+165kg (water in the circuit) = 1445 kg. The total mass of the HHV is then equal to 1235 kg (mass of the vehicle)+1445 kg (mass of the hydraulic circuit)+100 kg (mass of the hydraulic machine) = 2780kg. With this overweight, the cumulative fuel consumption on the NEDC raises 6.66L/100km.
One concludes that sizing the hydraulic circuit in order to keep the same energy storage capacity as the HEV is not acceptable. Indeed, not only the resulting huge mass of the vehicle (2780kg compared to 1235kg of the conventional vehicle) increases the fuel consumption of the vehicle but it will also affect dramatically the dynamics behaviour of the vehicle during manoeuvre. Another way to highlight the disadvantages of this way of dimensioning the hydraulic circuit is looking at the volume required for the accumulators and reservoirs and comparing it to the external volume of the vehicle. It is clearly impossible to pack the hydraulic circuit in the vehicle.
Another way to choose the hydraulic circuit is to size it on a mass basis. The idea is then to dimension it in order to have approximately the same weight as the HEV. In this case, a high-pressure accumulator of 10 gallons weighing approximately 115kg is selected. This accumulator has an energy storage capacity of 103Wh (370kJ) that corresponds to 18.13L of water in the hydraulic circuit. The corresponding low-pressure reservoir has a mass of around 38kg.
In this case, the total mass of the hydraulic circuit is equal to 115kg+38kg+18.13kg (water in the circuit) = 171kg. The total mass of the HHV is then equal to 1235kg (mass of the vehicle)+171kg (mass of the hydraulic circuit)+40kg (mass of the hydraulic machine) = 1446kg. Its cumulative fuel consumption on the NEDC is equal to 5.3L/100km. This way of sizing the hydraulic circuit gives a more acceptable solution in terms of interior space but it is still a little larger than the space occupied by the batteries in a HEV.
3.3 SUV
As the volume and the mass of the hydraulic circuit appeared to be the most critical aspect of a HHV, it is interesting to compare the results obtained by hydraulic technology with the HEV technology on a bigger vehicle like a SUV.
3.3.1 Conventional vehicle
The conventional vehicle selected is inspired by the BMW X3 car. It has a total mass of 1783kg and its fuel consumption calculated by ADVISOR on the NEDC is 13.22L/100km.
3.3.2 HEV
Once again, the HEV is based on the model of the Honda Insight directly available in ADVISOR. Only a few characteristics of the vehicle were modified in accordance with the ones given in Table 1. The battery packs as well as the electric machine were scaled up according to the mass ratio of the two vehicles. The characteristics of the battery are:
• Type: NiMH (45 packs – 6,5 Ah) • Nominal voltage = 324 V • Total mass = 60 kg
The characteristics of the electric motor are: • Power = 23 kW
• ηmax = 96 %
• Total mass = 122 kg
This gives a total mass for the vehicle of 1965kg and that corresponds to 11.24L/100km on the NEDC.
3.3.3 HHV
Once again, if one chooses the hydraulic system to store the same energy amount, the volume required by the accumulators and reservoirs as compared to the external volume of the vehicle is much too large.
In addition, the total mass of the vehicle is around 4680 kg, which is totally unrealistic for this kind of vehicle. The fuel consumption is even higher than with the conventional vehicle, reaching 16.55L/100km on the NEDC.
The other way to dimension the hydraulic circuit is to choose its components in order to obtain a total vehicle mass similar to the HEV one. In this case, two high pressure accumulators of 15 gallons, giving an energy storage capacity of 1109kJ (308Wh) for a mass of 340kg are selected. A volume of 54 litres of water is flowing in the hydraulic circuit and the reservoirs weigh 90kg. The total weight of the hydraulic circuit is equal to 340kg+90kg+54kg (water in the circuit) = 484kg. The total mass of the HHV is then equal to 1783kg (mass of the vehicle) + 484kg (mass of the hydraulic circuit) + 60kg (mass of the hydraulic machine) = 2327kg and its cumulative fuel consumption on the NEDC is equal to 12.7L/100km.
3.4 Urban bus
We have seen that the dimensions and the mass of the hydraulic circuit of a HHV are such that this technology is not very well suited to small vehicles (C-segment vehicle) or even to SUV. It
is now interesting to study how this technology behaves in a heavier vehicle that is an urban bus.
3.4.1 Conventional vehicle
The vehicle selected for this study is an urban bus of approximately 15300kg.
The model of the urban bus used for the simulation is adapted from an existing model of bus directly available in ADVISOR. The characteristics of the vehicle are modified in accordance with the data given in Table 1. For this vehicle, ADVISOR gives the total fuel consumption on the NYCC, typical of a city driving cycle, of 101.3L/100km.
3.4.2 HEV
Keeping the same powertrain architecture as for the passenger cars, the energy storage device and electric machine of the HEV modelled in ADVISOR have the following properties.
Battery:
• Type: NiMH (571 packs – 6,5 Ah) • Nominal voltage = 511 V • Total mass = 570 kg Electric machine: • Power = 122 kW • ηmax = 96 % • Total mass = 149 kg
This gives a total mass for the vehicle of 16000kg and that corresponds to 56.9L/100km on the NYCC. This is a significant decrease in the fuel consumption by 44% compared to the conventional vehicle. This also shows that the selected powertrain architecture is well suited to vehicles undergoing frequent stops and starts.
3.4.3 HHV
Once again, dimensioning the hydraulic circuit in order to offer the same energy storage capacity as the HEV (96197kJ) gives totally unrealistic results. Indeed, the total mass of the vehicle is greater than 60.000kg and the fuel consumption on the NYCC is even higher than that of the conventional vehicle: 124.1L/100km. As for the C-segment vehicle and for the SUV, one has to dimension the hydraulic circuit on a mass basis. For the urban bus, a parametric study on the number of high pressure accumulators was carried out. This study shows the impact of the use of an hydraulic circuit made of 5, 10, 15 and then 20 accumulators on the performance of the vehicle. Because of the size of the vehicle, these different configurations can be packed in the vehicle, or at least on the roof.
The detailed results of the parametric study are presented in the next section.
4
Results and discussion
Tables 2, 3 and 4 summarize respectively the results obtained from the simulation of the C-segment vehicle, the SUV and the urban bus.
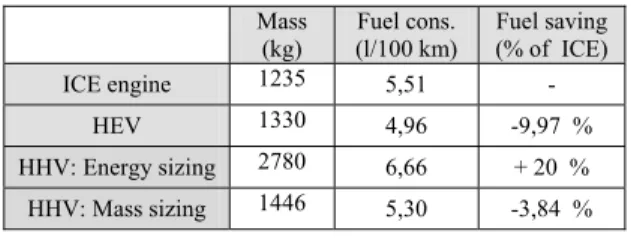
Table 2: Results obtained for the C-segment vehicle Mass
(kg) (l/100 km) Fuel cons. Fuel saving (% of ICE)
ICE engine 1235 5,51 -
HEV 1330 4,96 -9,97 % HHV: Energy sizing 2780 6,66 + 20 % HHV: Mass sizing 1446 5,30 -3,84 %
Table 3: Results obtained for the SUV Mass (kg) Fuel cons. (l/100 km) Fuel saving (% of ICE) ICE 1783 13,22 - HEV 1965 11,24 -14,95 % HHV: Energy sizing 4679 16,55 + 25,22 % HHV: Mass sizing 2327 12,69 -3,94 %
Table 4: Results obtained for the urban bus Mass (kg) Fuel cons (l/100 km) Fuel saving (% of ICE) ICE 15 281 101,28 - HEV 16 000 56,90 -43,82 % HHV: Energy sizing 57 016 124,10 +22,51 % HHV: 5 accumulators 16 555 70,50 -30,39 % HHV: 10 accumulators 17 769 72,44 -28,47 % HHV: 15 accumulators 18 983 74,92 -26,02 % HHV: 20 accumulators 20 187 76,52 -24,44 %
For the same energy storage capacity, a HHV has a mass twice as big as a HEV. The fuel consumption of the HHV is hence even bigger than the fuel consumption of the conventional ICE vehicle. If we dimensioned the hydraulic system to weigh the same as the electric system in the HEV, we obtain better results with reduction of the fuel consumption of about 4% for the cars and 30% for the bus. If we compare these results with the ones obtained for the HEV, we noticed that the fuel economies of the HEV are better, about 10 or 15% for the cars and 43% for the urban bus.
In conclusion, the low energy density of the HHV technology makes this solution well suited to ‘mild’ hybrid architecture, where the
motor/pump is only used to provide additional power to the crankshaft of the prime mover during short periods of time (vehicle launch) and to recover energy during braking phases.
The study showed that HHV technology is neither well suited to small (C-segment) vehicles, nor even to SUV for which the HEV technology appears to be the best choice. The main reasons are the major penalty coming from the high mass and size of the hydraulic system that prevents the vehicle from achieving good fuel savings. In addition, the high mass and size of the hydraulic system can cause many troubles in terms of packaging, vehicle dynamics, vehicle structure, etc.
The HHV technology appears to be best suited to heavier vehicles because the surplus of mass is then relatively less important, while the architecture of the chassis offers greater possibility for the packaging of the hydraulic accumulators and reservoirs. In addition, heavier vehicles suffer less from the surplus of weight from a vehicle dynamics point of view due to the lower speed of those vehicles.
The study also showed that HHV technology can provide good fuel saving on city typical drive cycles with frequent stops and starts. With the urban bus, the fuel saving for the HHV on the NYCC is about 30% as compared to the conventional vehicle. Despite a smaller fuel saving than with a HEV (43%), the HHV technology has a chance to compete with HEV if costs are also taken into consideration, this will be the next part of this study.
5 Economical
comparison
between HEV and HHV
5.1 Fuel
economy
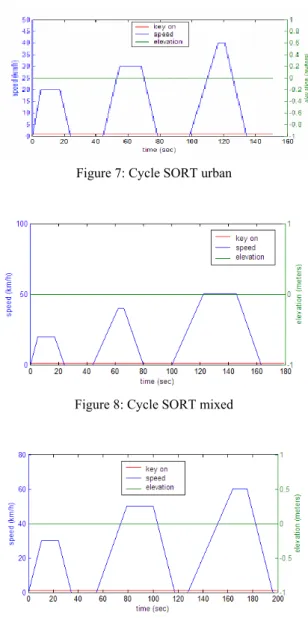
In this part of the study, we compare a hybrid hydraulic bus and a hybrid electric bus driven on city cycle and we take into account the cost and the lifetime of the components. We simulate the HHV and the HEV buses on three SORT (Standardised On-Road Test) drive cycles [9]: urban (figure 7), mixed (figure 8), suburban (figure 9). These drive cycles has been developed by the UITP with the help of many European bus users and manufacturers to fit to reality. So we use the SORT cycles in place of the New-York City cycle in this part of the study because they are more suited to European traffic characteristics and they offer a wider range of possibilities.
Figure 7: Cycle SORT urban
Figure 8: Cycle SORT mixed
Figure 9: Cycle SORT suburban
As we have seen in the table 4, the fuel consumption of the HHV depends on the number of accumulators, in this part of the study, we optimize the size of the ICE (172 kW) and the number of accumulator (5) in order to reach the minimal consumption on the three SORT cycles. The table 5, 6 and 7 illustrate respectively the results for the urban SORT drive cycle, mixed SORT drive cycle and suburban SORT drive cycle.
Table 5: Results for the buses on urban SORT cycle Mass [kg] Fuel consumption [l/100km] Fuel saving[%] ICE 15132 64,20 - HEV 15302 52,10 -18,85% HHV 16595 58,45 -8,96%
Table 6: Results for the buses on mixed SORT cycle Mass [kg] Fuel consumption [l/100km] Fuel saving[%] ICE 15132 53,13 - HEV 15302 44,45 -16,34% HHV 16595 49,95 -5,98%
Table 7: Results for the buses on suburban SORT cycle Mass [kg] Fuel consumption [l/100km] Fuel saving[%] ICE 15132 47,84 - HEV 15302 40,76 -14,80% HHV 16595 46,36 -3,09%
5.2 Payback
time
With the results obtained in table 5, 6 and 7, we can make an estimation of the reduction in fuel cost per year for HEV or HHV buses.
We make also an estimation of the cost to develop (2.250.000€) and produce one thousand HHV (table 8) or HEV buses (table 9). We notice that there is only a small difference of price between the hydraulic and the electric system. But we must remember that the lifetime of the batteries is much lower than the lifetime of the hydraulic storage system. The lifetime of a battery pack is more or less 150 000 km, this distance can be done by an urban bus in three years.
Table 8: Estimation of the cost for a hydraulic system Components Description Price per bus(€)
Motor/pump Parker PE060 1350
Gearbox Single reduction gearbox 800 Energy storage Hydac SB600+SB40 17750
Total 19900 Table 9: Estimation of the cost for an electric system for
a bus driving in heavy urban traffic
Components Description Price per bus(€) Motor/generator Solectria AC55 1320
Gearbox Single reduction gearbox 800
Controller Siemens 2000 Energy storage Panasonic EV 17743
Total 21863
Knowing the additional cost to transform one thousand conventional buses into hybrid buses and the reduction of operating expenses (fuel and brake), we can calculate the payback time in
function of the driving condition for the HEV buses (table 10) and for the HHV buses (table 11).
Table 10: Estimation of the payback period for HEV bus Sort 1 Sort 2 Sort 3
Components (€) 21863 20014 20150
Fabrication (€) 7250 7250 7250
Development (€) 2250 2250 2250
Total (€) 31363 29514 29650
Energy storage (€/year) -5914 -4838 -4583 Fuel economy (€/year) 3934 4231 4899 Brake economy (€/year) 500 500 500 Economy (€/year) -1480 -107 816
Payback time (years) 36,3
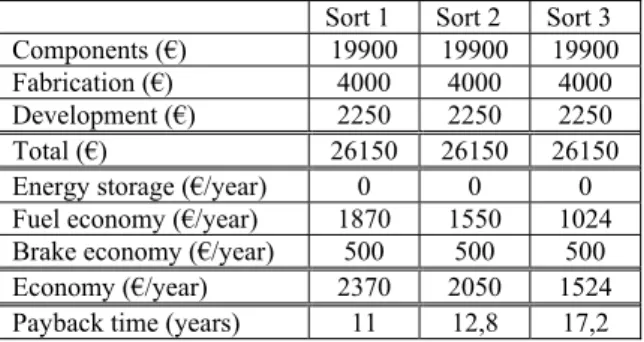
Table 11: Estimation of the payback period for HHV bus Sort 1 Sort 2 Sort 3
Components (€) 19900 19900 19900
Fabrication (€) 4000 4000 4000
Development (€) 2250 2250 2250
Total (€) 26150 26150 26150
Energy storage (€/year) 0 0 0 Fuel economy (€/year) 1870 1550 1024 Brake economy (€/year) 500 500 500
Economy (€/year) 2370 2050 1524
Payback time (years) 11 12,8 17,2
We note that, due to the actual high cost and short lifetime of a battery pack, the HEV system is generally more expensive than a conventional bus excepted for the suburban drive cycle but even in this case, the payback time is very long. Despite a smaller annual fuel economy, the HHV are more interesting, economically speaking, because of the longer lifetime of its energy storage system. Indeed, the cost of the hydraulic system could be repay in one or two decades depending on the driving conditions. The worst are these conditions (heavy traffic, frequent stops), the faster are the payback.
6 Conclusions
From the single consumption point of view, the HHV technology can not rival with the performance achievable with a HEV. But when the cost ratio is also taken into account, the HHV technology can compete with HEV thus making the HHV technology a valid alternative in niche markets such as urban buses, bin lorries or heavy urban delivery vehicles.
References
[1] Jefferson C.M. and Barnard R.H. Hybrid Vehicle
Propulsion Southampton WIT Press, 2002
[2] Bin W., Chan-Chiao L., Zoran F., Huei P. and Dennis A., Optimization of Power Management
Strategies for a Hydraulic Hybrid Medium Truck,
In Proceedings of 6th International Symposium on Advanced Vehicle Control, AVEC2002 Hiroshima, Japan, September, 2002
[3] Matheson P. and Stecki J., Development and
simulation of a hydraulic-Hybrid Powertrain for use in Commercial Heavy Vehicles, SAE Technical
paper No 2003-01-3370, 2003.
[4] Kepner R.P., Hydraulic Power Assist – A
Demonstration of Hydraulic Hybrid Vehicle Regenerative Braking in a Road Vehicle Application, Ford motor company, SAE Technical
paper No 2002-01-3128, 2002.
[5] ENERCARE, Technical and economical study of a
new hydraulic motor pump. Technical report
Piment2 Walloon Region of Belgium.
[6] Parker Hannifin Corporation, Parker PE series
Piston Pumps variable Displacement. Catalog HY13-2657-001/US and HY13-1552-002/US.
www.parker.com/pumpmotor/
[7] Parker Hannifin Corporation. Hydraulic
Accumulator Selection Guide. Catalog
HY10-1630/US. http://www.parker.com/accumulator/
[8] Hydac. Accumalator online catalog.
http://www.hydacusa.com/literature/accumulators/
[9] Union International des Transports Publiques (UITP), SORT Standardised On-Road Test Cycles, 2004
[10] Andreu Montserrat N., Simulation et étude technico
économique comparative de bus hybrides électriques et hydrauliques,ULg, 2006