Journal Pre-proof
Deposition of environmentally relevant nanoplastic models in sand during transport experiments
Alice Pradel, Hind el Hadri, Cloé Desmet, Jessica Ponti, Stéphanie Reynaud, Bruno Grassl, Julien Gigault
PII: S0045-6535(20)31105-X
DOI: https://doi.org/10.1016/j.chemosphere.2020.126912 Reference: CHEM 126912
To appear in: ECSN
Received Date: 9 February 2020 Revised Date: 17 April 2020 Accepted Date: 26 April 2020
Please cite this article as: Pradel, A., Hadri, H.e., Desmet, Cloé., Ponti, J., Reynaud, Sté., Grassl, B., Gigault, J., Deposition of environmentally relevant nanoplastic models in sand during transport experiments, Chemosphere (2020), doi: https://doi.org/10.1016/j.chemosphere.2020.126912.
This is a PDF file of an article that has undergone enhancements after acceptance, such as the addition of a cover page and metadata, and formatting for readability, but it is not yet the definitive version of record. This version will undergo additional copyediting, typesetting and review before it is published in its final form, but we are providing this version to give early visibility of the article. Please note that, during the production process, errors may be discovered which could affect the content, and all legal disclaimers that apply to the journal pertain.
Deposition of Environmentally Relevant Nanoplastic Models in Sand during Transport Experiments
Alice Pradel a*, Hind el Hadri b, Cloé Desmetc, Jessica Pontic, Stéphanie Reynaud b, Bruno Grassl b, Julien Gigault a*
a
Univ Rennes, CNRS, Géosciences Rennes - UMR 6118, 35000 Rennes, France
b
IPREM, UMR 5254, CNRS-Université de Pau et des Pays de L’Adour, 64000 Pau, France
c
European Commission, Joint Research Centre (JRC), Directorate F - Health, Consumers and Reference Materials, Via E. Fermi 2749, 21027 Ispra, VA, Italy
CRediT authorship contribution statement
• Alice Pradel: Conceptualization, Methodology, Investigation, Formal analysis, Writing - original draft, review & editing, Visualization.
• Hind el Hadri: Preparation of nanoplastic models.
• Cloé Desmet: Characterization of Particle Hydrophobicity. • Jessica Ponti: Transmission Electron Microscopy Analysis. • Stéphanie Reynaud: Preparation of nanoplastic models.
• Bruno Grassl: Conceptualization, Writing - review and editing.
• Julien Gigault: Conceptualization, Formal analysis, Writing - review and editing, Funding acquisition.
1
Deposition of Environmentally Relevant Nanoplastic Models in Sand during Transport
1
Experiments
2
Alice Pradel a*, Hind el Hadri b, Cloé Desmetc, Jessica Pontic, Stéphanie Reynaud b, Bruno Grassl b,
3
Julien Gigault a*
4
a
Univ Rennes, CNRS, Géosciences Rennes - UMR 6118, 35000 Rennes, France 5
b
IPREM, UMR 5254, CNRS-Université de Pau et des Pays de L’Adour, 64000 Pau, France 6
c
European Commission, Joint Research Centre (JRC), Directorate F - Health, Consumers and 7
Reference Materials, Via E. Fermi 2749, 21027 Ispra, VA, Italy 8 *[email protected] 9 10 Abstract 11
Nanoplastics (NPTs) are defined as colloids that originated from the unintentional degradation of
12
plastic debris. To understand the possible risks caused by NPTs, it is crucial to determine how they are
13
transported and where they may finally accumulate. Unfortunately, although most sources of plastic
14
are land-based, risk assessments concerning NPTs in the terrestrial environmental system (soils,
15
aquifers, freshwater sediments, etc.) have been largely lacking compared to studies concerning NPTs
16
in the marine system. Furthermore, an important limitation of environmental fate studies is that the
17
NPT models used are questionable in terms of their environmental representativeness. This study
18
describes the fate of different NPT models in a porous media under unfavorable (repulsive) conditions,
19
according to their physical and chemical properties: average hydrodynamic diameters (200 to 460 nm),
20
composition (polystyrene with additives or primary polystyrene) and shape (spherical or
21
polymorphic). NPTs that more closely mimic environmental NPTs present an inhomogeneous shape
22
(i.e., deviating from a sphere) and are more deposited in a sand column by an order of magnitude. This
23
deposition was attributed in part to physical retention, as confirmed by the straining that occurred for
24
the larger size fractions. Additionally, different Derjaguin-Landau-Verwey-Overbeek (DLVO) models
25
-the extended DLVO (XDLVO) and a DLVO modified by surface element integration (SEI) method-
26
suggest that the environmentally relevant NPT models may alter its orientation to diminish repulsion
27
from the sand surface and may find enough kinetic energy to deposit in the primary energetic
28
minimum. These results point to the importance of choosing environmentally relevant NPT models.
29
Keywords: Nanoplastic; Size; Shape; Transport; Soil; Column
2
1. Introduction:
31
It has been established that every environmental system contains plastic debris (Bank and
32
Hansson, 2019). The marine environment is the first system in which plastic pollution has been
33
extensively studied, probably due to the highly visible accumulation that started in the 1970s
34
(Carpenter and Smith, 1972; Cozar et al., 2014; Law et al., 2010; Schwarz et al., 2019). Since then, the
35
extent of this contamination has been more closely described. Plastic fragments or additives are found
36
in remote areas as they can travel long distances (Jamieson et al., 2017; Peng et al., 2020). They have
37
reached uninhabited forests after undergoing atmospheric transport (Allen et al., 2019) and have been
38
incorporated into Artic sea ice after being transported by oceanic currents (Obbard et al., 2014). It is
39
generally agreed upon that the terrestrial system is the major source of plastic waste (Jambeck et al.,
40
2015). However, plastics in terrestrial and freshwater environments have received little attention
41
(Horton et al., 2017; Rillig, 2012; Wagner et al., 2014). Plastic accumulates in the terrestrial system
42
due to common sources, such as faulty waste management systems, spreading of sewage sludge, use
43
of plastic mulches and other plastic products in agriculture, and tire wear particles (Carr et al., 2016;
44
He et al., 2018; Liu et al., 2019; Scheurer and Bigalke, 2018). This rapidly accumulating plastic in
45
soils and sediments can be degraded by photo-oxidation, thermo-oxidation, abrasion and
46
biodegradation, which causes the inevitable release of small plastic particles (Huerta Lwanga et al.,
47
2017; Ng et al., 2018). In the terrestrial system (soils, aquifers, sediments, etc.), studies have generally
48
focused on microplastics (1 μm to 5 mm) (Dong et al., 2019a, 2019b; He et al., 2018; Liu et al., 2019;
49
Tufenkji and Elimelech, 2005), although it is clear that plastic fragmentation does not stop at the
50
micrometer size (Gigault et al., 2016; Lambert and Wagner, 2016).
51
The fragmentation of macro- and microplastics to nanoplastics (<1 μm) adds complexity to the
52
global plastic waste issue. Even if no clear definition of nanoplastics (NPTs) is proposed by
policy-53
makers, a scientific consensus has been proposed to define NPTs as colloids that originate from the
54
unintentional degradation of plastic (Gigault et al., 2018; Hartmann et al., 2019). Compared to
55
microplastics, NPTs acquire colloidal properties and become unaffected by gravity. At this scale, the
56
fate of NPTs will be controlled by surface properties, shape and diffusion rather than by the bulk
3
properties (Hiemenz and Rajagopalan, 1997). The fact that the majority of plastic debris cannot be
58
located by mass budgets at the ocean surface suggests that part of the missing fraction of plastic debris
59
could be composed of fractions smaller than 300 µm in size (Albert A Koelmans et al., 2017; van
60
Sebille et al., 2015). Since the nanoscale characteristics of plastic debris may pose potential risks, it is
61
therefore crucial to determine where this plastic originates from and where it accumulates (Galloway,
62
2015; Albert A. Koelmans et al., 2017; Lehner et al., 2019).
63
Due to limited data on the occurrence of NPTs, lab-scale models can aid in determining the
64
transfer of NPTs from one environmental system to another. For the terrestrial system, a saturated
65
sand column is generally used as a proxy for the study of colloid transfer in soils, sediments and
66
aquifers (Geitner et al., 2017; Lecoanet et al., 2004; Petosa et al., 2010; Redman et al., 2004;
67
Syngouna and Chrysikopoulos, 2013; Tufenkji and Elimelech, 2004). Quevedo and Tufenkji
68
compared the transport of spherical and size standardized polystyrene nanoparticles in quartz sand and
69
loamy soil in the presence of monovalent or divalent salts (Quevedo and Tufenkji, 2012). Recently,
70
Hu et al. used quartz sand columns to investigate the cotransport of naphthalene with polystyrene
71
nanoparticles (Hu et al., 2020). Another recent work demonstrated the influence of the soil type on the
72
same nanoparticles (Wu et al., 2019). While these works highlight the importance and complexity of
73
the transport mechanisms in soils, they only focused on NPT models that are not representative of the
74
NPTs found in our environment (Ter Halle et al., 2017). Indeed, the composition, shape, size, and
75
surface are known to play key roles in the transport of nanoparticles in the environment (Hotze et al.,
76
2010; Pelley and Tufenkji, 2008; Salerno et al., 2006). Such parameters have only recently been
77
investigated, with studies concerning UV-aged NPTs (Liu et al., 2019) and polystyrene NPTs
78
containing different surface functionalities (Dong et al., 2019b).
79
Before investigating the influence of the soil properties, the objective of the present work is to
80
investigate how the properties of NPTs affect their transport or accumulation in soils. Thus, different
81
NPT models were used. All models were composed of polystyrene, since this is the only commercially
82
available nanometer-sized plastic particle available. On the one hand, both commercial and
83
noncommercial polystyrene latex spheres (PSL), PSL COOH and PSL COOH-P, respectively, are
4
synthesized by a bottom-up process (Pessoni et al., 2019). This makes them highly spherical and
85
monodisperse and it allows their surface to be modified by the addition of carboxylate functional
86
groups (COOH), which are common on weathered plastics (Gewert et al., 2015). On the other hand,
87
NPT-P are synthesized from a top-down method, which mimics the environmental mechanism of 88
abrasion (Hadri et al., 2020). They have polymorphic (asymmetrical & irregular) shapes, a
89
polydisperse size distribution, and they may contain some oxidized functional groups. The transport of
90
NPT-P models through a sand column shows that their irregular shape will increase their probability 91
of accumulating in porous media. These results stress the importance of choosing NPT models that
92
have environmentally relevant physicochemical properties.
93
94
2. Methods
95
2.1 Dispersions of nanoplastic models
96
Table 1 presents the different NPT models used in the study. Carboxylated polystyrene latex
97
spheres of 200 nm (PSL COOH 200) were Polybead® Carboxylate Orange Dyed Microspheres 0.20
98
μm purchased from (Polysciences© Warrington USA). These particles contain additives for stabilizing 99
purposes, whose composition and concentration are unknown. To study the effect of particle
100
composition, additive-free particles composed of primary (-P) polystyrene were also used. Soap and
101
metal-free carboxylated polystyrene spheres of 430 nm (PSL COOH 430-P) were produced by
102
emulsion polymerization according to the method described by Pessoni et al.(2019). Finally, NPT
103
models with polymorphic (asymmetrical and irregular) shapes and with an average hydrodynamic
104
diameter of 350 nm or 460 nm (NPT 350-P and NPT 460-P, respectively) were formulated from
105
mechanically crushed PS pellets, according to the method previously described (Hadri et al., 2020).
106
All suspensions were composed of NaCl at a concentration of 5.0 10-3 M with pH fixed at 6.5.
5
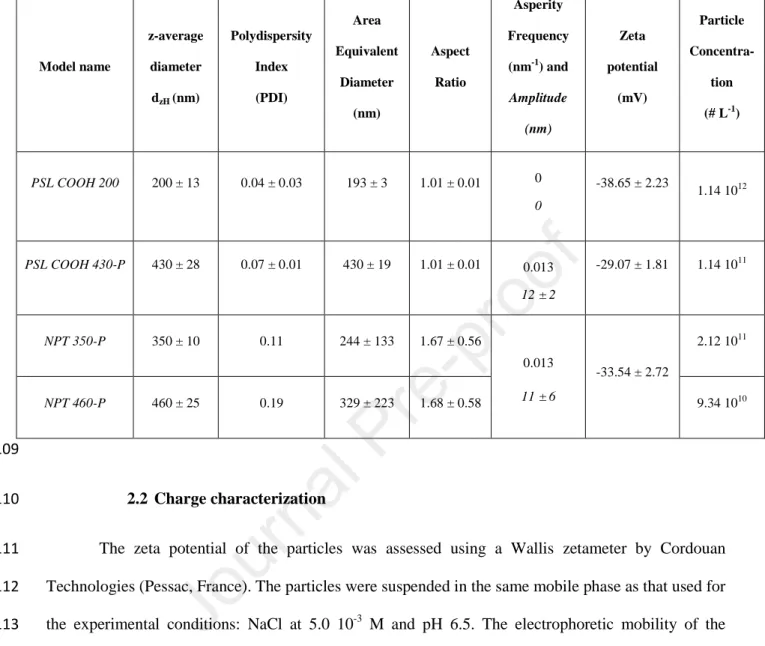
Table 1: Summary of the physicochemical properties of the nanoplastic models studied
108 Model name z-average diameter dzH (nm) Polydispersity Index (PDI) Area Equivalent Diameter (nm) Aspect Ratio Asperity Frequency (nm-1) and Amplitude (nm) Zeta potential (mV) Particle Concentra-tion (# L-1) PSL COOH 200 200 ± 13 0.04 ± 0.03 193 ± 3 1.01 ± 0.01 0 0 -38.65 ± 2.23 1.14 1012 PSL COOH 430-P 430 ± 28 0.07 ± 0.01 430 ± 19 1.01 ± 0.01 0.013 12 ± 2 -29.07 ± 1.81 1.14 1011 NPT 350-P 350 ± 10 0.11 244 ± 133 1.67 ± 0.56 0.013 11 ± 6 -33.54 ± 2.72 2.12 1011 NPT 460-P 460 ± 25 0.19 329 ± 223 1.68 ± 0.58 9.34 1010 109 2.2 Charge characterization 110
The zeta potential of the particles was assessed using a Wallis zetameter by Cordouan
111
Technologies (Pessac, France). The particles were suspended in the same mobile phase as that used for
112
the experimental conditions: NaCl at 5.0 10-3 M and pH 6.5. The electrophoretic mobility of the
113
colloidal particles was converted into a zeta potential by using Smoluchowski’s formula. A zeta
114
potential for sand of -50 mV was chosen according to Vinogradov et al. (2010).
115
2.3 Size characterization
116
Hydrodynamic diameters (dH) were determined by dynamic light scattering (DLS) using a
117
Vasco-Flex particle size analyzer (Cordouan Technologies). The dH of the injected NPT models and
118
the initial sand column signal, as well as 8 mL aliquots of the eluate, were characterized by DLS. Each
119
DLS measurement corresponds to an average of six measurements of 60 seconds each. Each sample
120
was assigned a z-average hydrodynamic diameter (dzH) using the cumulant algorithm. Additionally,
121
the Sparse Bayesian learning (SBL) algorithm provides a multimodal analysis to determine the
6
presence of several dH (see supplemental information, Figure S1). TEM images were obtained by a
123
Jeol 2100 High Resolution Microscope (Figure S2). Data was analyzed with ImageJ software and the
124
NanoDefine plugin to obtain the area equivalent diameters and the aspect ratios (length of major
125
axis/length of minor axis), presented in Table 1 (Verleysen et al., 2019).
126
127
2.4 Transport in porous media
128
Transport and deposition were studied in a lab-scale sand-packed column using a liquid
129
chromatography system (Äkta™ Pure by General Electric Healthcare). This porous media was
130
composed of Fontainebleau sand (type NE34) with a median diameter (d50) of 210 μm and a
131
uniformity index d60/d10 of 1.4. The sand was dry-packed into a borosilicate column (XK 26, GE
132
Healthcare, i.d. = 2.6 cm). The packed bed height varied from 11.2 to 12.7 cm. The porosity was 0.40
133
± 0.01 on average. The eluent (mobile phase) was composed of NaCl at 5.0 10-3 M. The pH value was
134
fixed at 6.5 using NaOH and HCl. The sand was washed with at least 14 pore volumes (PVs) of
135
deionized water and 22 PVs of the eluent. The pore volume was determined by an injection of NaCl at
136
5.0 10-3 M. Complete tracer tests were performed with KBr. All reactants were analytical grade. The
137
particles and tracers were injected during 6 PVs at a fixed rate of 1.57 10-5 m.s-1, followed by at least
138
six pore volumes of the plastic-free suspension at the same ionic strength and pH value.
139
At the outlet, the concentration of the NPT models eluted from the porous media was
140
continuously measured by the UV-Vis spectrophotometer paired to the chromatography system at a
141
wavelength λ = 226 nm, where polystyrene absorption is maximal. Breakthrough curves (BTC) were
142
obtained by plotting the outflowing concentration of the NPT models normalized by the initial
143
concentration as a function of pore volumes eluted. Duplicate experiments were performed for PSL
144
COOH 200 and PSL COOH 430-P. Due to the limited yield of NPT-P dispersions and to the 145
variability in size distributions of different NPT-P batches, duplicates were not performed.
146
7
2.5 Theory
148
2.5.1 Colloid Filtration Theory (CFT)
149
Colloid filtration theory (CFT) is used to separate hydrodynamic processes from surface
150
interactions that are occurring in the sand column. It is summarized by equation (1), which expresses
151
the porous media’s capacity to trap colloids. The single-collector removal efficiency (η) is the product
152
of the single-collector contact efficiency (η0) and the attachment efficiency of the particles (α) (Petosa
153
et al., 2010).
154
= α (1)
155
The single-collector contact efficiency (η0) is the capacity of colloids to be trapped by porous media
156
due only to hydrodynamic mechanisms, without any favorable physicochemical conditions. It depends
157
upon a number of factors, including the diameter of the colloids, the diameter of the sand grains in the
158
porous media, the porosity of the sand column, and the flow rate. It was calculated according to the
159
equation developed by Tufenkji and Elimelech (2004). The attachment efficiency (α) is a function of
160
the physicochemical properties of the colloid dispersion and of the sand grain surfaces, such as ionic
161
strength, surface charge and the Hamaker constant of the system. The attachment efficiency (α) is
162
obtained according to equation (2):
163
= − ( ) ln ( ⁄ ) (2)
164
where d50 is the median diameter of the sand grains, ε and L are the sand column porosity and length,
165
respectively, and (C/C0) is the height of the breakthrough curve.
166
2.5.1 DLVO theory of colloidal stability
167
Surface energetics between particles and an infinite flat plane were modeled by the
Derjaguin-168
Landau-Verwey-Overbeek (DLVO) theory, such as the total energy of interaction Gtot as the sum of
169
the Lifshitz-van der Waals GLW attraction and the repulsion due to the electronic double layer Gel.
170
DLVO theory can be expanded upon and modified to take into account the effect of hydrophobicity,
171
roughness and particle shape, separately. First an extended version of the DLVO theory (XDLVO)
8
was also modeled by adding the Lewis acid-base (hydrophopic) component GAB to the total energy of
173
interaction. Secondly, the effect of particle shape and orientation was studied thanks to the surface
174
element integration (SEI) method, since is what sets apart PSL COOH 430-P and both NPT-P
175
particles.
176
The Lifshitz–van der Waals component GLW of the free energy of interaction between a colloid and a
177
surface is given by:
178
= − [ − !" ] (3)
179
where H is the Hamaker constant for the polystyrene-silica-water system, h is the separation distance
180
between the colloid and the sand, and dp is the radius of the colloid. A Hamaker constant of 1.45 10-20
181
was calculated from Israelachvili (Israelachvili, 2015) for the interaction between quartz, water and
182
polystyrene.
183
The electronic double layer component Gel is given by:
184 $% = &'( )(*++ *-)[../.0 /1 .21. !" 456( 7 ) 456( 7 )+ !"{1 − exp (−2>ℎ)} (4) 185
where ζN and ζS are the surface charges of the plastic colloids and of the sand surface, respectively.
186
The zeta potential was used instead of the surface potential. κ is the double layer thickness, which is
187
determined by the following equation:
188
> = [ A$1
BC∑EFG"G] (5)
189
where e is the charge of the electron; ε is the permittivity of the medium, which is equal to 6.95 10-10
190
C2.J-1.m-1, kB the Boltzmann constant, T the temperature, zi the valency of the ions i, and ni the number
191
of ions i per unit volume.
192
The Lewis acid-base energy of interaction GAB of our system is:
193
HI = &J()KL HIM[( N )/P] (6)
9
where λ is the correlation length, chosen as 1.65 nm, according to Valsesia et al. (2018), and h0 is the
195
minimum distance of separation between the particle and the surface, taken as 0.158 nm. The
acid-196
base potential ΔGAB is expressed as:
197
L HI= −2 QRS
+HI− RSHIT . (RS-HI− RSHI)
with USHIreferring to the polar component of the surface free energy for W = water, S = sand surface
198
and N = NPT model. RSHI is 51.00 mJ.m-2 and RS-HI is 15.00 mJ.m-2 according to Barhoumi et al.
199
(Barhoumi et al., 2010).. The polar component of the free energy was measured according the method
200
of Valsesia et al. (2018) for each of the three types of NPT models. US+HI values of 33.91, 37.47 and
201
31.82 mJ.m-2 were obtained for PSL COOH 200, PSL COOH 430-P and NPT-P, respectively.
202
The DLVO theory was modified by the SEI method described by Wu et al. ( 2013) to understand
203
the effect of NPT-P’s nonspherical shape and their different orientations, described by the angle φ that
204
is formed between the major axis of the particle and the collector surface (Bhattacharjee et al., 2000).
205
The interaction energy between a plane surface (collector) and a curved object (particle) were
206
calculated by integrating this energy over the exact surface geometry of the object. Our particles were
207
considered to be rod-like. The semi-major axis (L) and semi-minor axis (a) were determined according
208
to the aspect ratio and the dzH presented in Table 1.
209 210 211
10
3. Results & Discussion
212 213 214 215 216 217 218 219 220
Figure 1: Breakthrough curves of KCl tracer and nanoplastic models injected continuously for 6 pore volumes at an initial
221
concentration (C0) of 5.0 10-3 g.L-1 in 5.0 10-3 M NaCl and pH 6.5 (error bars = standard deviation, n = 2).
222
Figure 1 illustrates the breakthrough curves (BTC) of the different NPT models after transport
223
through a sand column at a constant flow rate. Reproducible results are obtained with this
224
experimental setup, as shown by the error bars on the duplicate experiments of PSL COOH 200 and
225
PSL COOH 430-P. A KBr salt tracer shows only the effect of transport by advection and dispersion 226
due to the absence of deposition (C/C0 of unity). PSL COOH 200 presents a BTC similar in shape to
227
KBr with 92±5% recovered in column effluent. This result indicates transport through the column with
228
negligible deposition onto the sand. However, 67±1% of PSL COOH 430-P are recovered in column
229
effluent, which indicates some deposition occurred. Finally, both polymorphic PS models (NPT-P) are
230
the most deposited, with only 28% of NPT 350-P, and 10% of NPT 460-P that are recovered in
231
column effluent. These results indicate that an increase in particle size causes an increase in the
232
deposition rate. Indeed, when comparing NPT models of similar shape, larger particles are less
233
recovered in column effluent: PSL COOH 430-P vs PSL COOH 200 and NPT 460-P vs NPT 350-P.
234
The higher transport rate of PSL COOH 200 compared to PSL COOH 430-P may also be due to the
235 1.1 KBr Tracer PSL COOH 200-std PSL COOH 430-P NPT 350-P NPT 460-P 0 1 2 3 4 5 6 7 8 -0.1 0.0 0.1 0.2 0.3 0.4 0.5 0.6 0.7 0.8 0.9 1.0 1.1 C /C 0 Pore Volume
11
presence of surfactants used for commercial PSL COOH-200. Such molecules can enhance
236
nanoparticle transport by decreasing adsorption in the secondary energetic minimum (see DLVO
237
section below) (Tufenkji and Elimelech, 2005). Finally, the absence of a tailing at the end of the BTCs
238
shows that deposited particles did not detach from the porous media (Bradford et al., 2002).
239
Based on the BTCs, it appears that the particle shape strongly increases the deposition rate in
240
the porous media under dynamic conditions. Surprisingly, NPT 350-P is significantly more deposited
241
in porous media than PSL COOH 430-P, although they have a smaller initial hydrodynamic diameter
242
and area equivalent diameter (Table 1). This confirms that the asymmetrical and irregular shape of the
243
NPT model (NPT-P) significantly increases deposition in the porous media. It should be noted that
244
these experiments were performed at equivalent mass concentrations instead of equivalent particle
245
concentrations. This method was chosen to obtain a quality DLS signal at the outlet of the sand
246
column since light scattering is proportional to the particle diameter. However, it creates a bias that
247
favors elution of the smaller, more numerous particles (Table 1) (Bradford and Bettahar, 2006).
248
Despite this, NPT 350-P, which has a higher particle concentration, was more deposited than PSL
249
COOH 430-P. This highlights the fact that an irregular asymmetrical shape has a greater impact on the 250
deposition rate than that of size and particle concentration.
251
To investigate the retention mechanisms of these NPT models, both colloidal filtration theory
252
(CFT) and various Derjaguin-Landau-Verwey-Overbeek (DLVO) theories were studied. According to
253
the CFT, the single-collector contact efficiency (η0) increases as sub-micrometric particle sizes
254
decrease (Tufenkji and Elimelech, 2004). Hence, smaller particles should be more easily retained,
255
which is not the case in the present study. This suggests that nanoplastic models used here have
256
considerable differences in attachment efficiency (α) and non-classical mechanisms of particle
257
collision are operating. The attachment efficiency (α) obtained by CFT, can be used to compare the
258
affinity of particles with sand across different experimental conditions. Caution must be taken in
259
interpreting α since the CFT is meant to study monodisperse and spherical particles and collectors.
260
Since the sand grains are not monodisperse (d60/d10 of 1.4) and nanoplastic models have different
261
degrees of polydispersity (see Table 1), an average α range, namedα, and a range of α were presented
12
in Table 2 with the corresponding heat-maps presented in supplementary information (Figure S3).
263
Anα of 0.0034 ± 0.0005 was obtained for PSL COOH 200, whereas PSL COOH 430-P had anα =
264
0.012 ± 0.0008 (Table 2). These results are in agreement with other studies, such as Bradford et al.
265
(2002), who found that the 450 nm carboxylated PSL attachment efficiency in 10-3 M KCl at pH 6.8
266
varied from α = 0.0037 to α = 0.014 according to the polydispersity and average grain size of the
267
quartz sand (Bradford et al., 2002). Tufenkji and Elimelech (2005) found α values of 0.0058 and 0.014
268
for 320 nm PSL COOH in 20 10-3 M KCl at pH 8. For the polymorphic NPT models, the average
269
attachment efficiency is one order of magnitude greater than that for the spherical models, with α =
270
0.069 for NPT 350-P and 0.14 for NPT 460-P. This large increase in attachment efficiency is more
271
likely to represent different hydrodynamic flow processes than a change in surface affinity. Indeed, the
272
CFT theory is unsuitable to study the flow of nonspherical particles and largely overestimates α (and
273
underestimates η0) when the particle shape deviates from that of a sphere (Salerno et al., 2006).
274
Table 2: Summary of the percent in column effluent and attachment efficiencies (α) for the different nanoplastic models. The
275
attachment efficiencies are based on average particle diameter (dp) and collector diameters (dc) and a range of dp and dc
276
equal to the standard deviation (σ) of the size distributions. (Error bars = standard deviation of the duplicate experiments).
277 Nanoplastic Model Percent in Column Effluent (%) Attachment Efficiency (α)
dp – σ and dc - σ Average dp and dc dp + σ and dc + σ
PSL COOH 200 92 ± 5 2.0 10-3 ± 0.4 10-3 3.4 10-3 ± 0.5 10-3 5.4 10-3 ± 1.1 10-3
PSL COOH 430-P 67 ± 1 6.9 10-3 ± 0.8 10-3 1.2 10-2 ± 0.1 10-2 1.9 10-2 ± 0.2 10-2
NPT 350-P 28 4.0 10-2 6.9 10-2 1.2 10-1
NPT 460-P 10 7.9 10-2 1.4 10-1 2.5 10-1
278
Since the attachment efficiencies (α) obtained by the CFT theory should only reflect surface
279
energetic interactions, they can be compared with the profiles of the interaction energy between the
280
particles and the sand. Total surface energetic interactions (Gtot) are modeled according to DLVO
281
theory by taking the sum of the Lifshitz-van der Waals attraction (GLW) and the repulsion due to the
13
electronic double layer (Gel). An extended version, the XDLVO theory, includes the Lewis acid-base
283
(hydrophobic) interaction energy (GAB). This component has been carefully quantified using the
284
method described by Valsesia et al. (2018). It should be noted, however, that since DLVO and
285
XDLVO theories assume that the particles are spherical, they cannot correctly determine the
286
interaction energy of the asymmetrical and irregularly shaped NPT-Ps (Hotze et al., 2010). To
287
overcome this limitation, a SEI-modified DLVO calculates GLW and Gel between an elongated particle
288
and the sand surface. This modified DLVO does not, however, incorporate the hydrophobic
289
component of the interaction energy. It is important to note that in these experimental conditions,
290
advection prevails over diffusion, with a Peclet number varying from 112 to 240 for PSL COOH 200
291
and NPT 460-P, respectively. In these conditions, particle deposition can occur if the adhesive forces
292
are stronger than the hydrodynamic forces. Therefore, the objective is only to investigate whether the
293
physical and chemical properties of the particles modeled by the different DLVO theories, are
294
correlated to the attachment efficiencies in the sand column and hence a good predictor of adhesive
295
forces. Surface energetic interactions should not be considered an absolute prediction of deposition
296
behavior. If the energy of interaction predicts trends in transport, the most transported particles should
297
have the highest energetic barrier to deposition (ΔGtotmax) and lowest secondary energetic minimum
298
(ΔGtotmin2), where reversible deposition can occur.
299
300 301
14
0
10
20
30
40
50
60
0
100
200
300
In
te
ra
ct
io
n
e
n
er
g
y
(
k
BT
)
Distance of separation (nm)
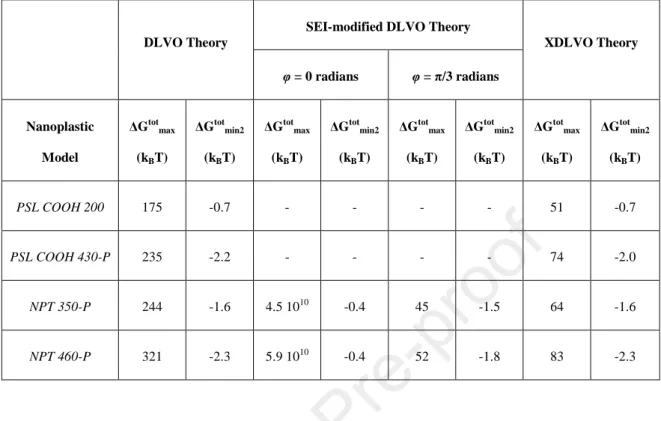
Table 3: Summary of primary maximum (ΔGtotmax) and secondary energetic minimum (ΔG tot
min2) of interaction energies
302
according to DLVO, SEI -modified DLVO and XDLVO theories, for the different nanoplastic models.
303
DLVO Theory
SEI-modified DLVO Theory
XDLVO Theory φ = 0 radians φ = π/3 radians Nanoplastic Model ΔGtot max (kBT) ΔGtot min2 (kBT) ΔGtot max (kBT) ΔGtot min2 (kBT) ΔGtot max (kBT) ΔGtot min2 (kBT) ΔGtot max (kBT) ΔGtot min2 (kBT) PSL COOH 200 175 -0.7 - - - - 51 -0.7 PSL COOH 430-P 235 -2.2 - - - - 74 -2.0 NPT 350-P 244 -1.6 4.5 1010 -0.4 45 -1.5 64 -1.6 NPT 460-P 321 -2.3 5.9 1010 -0.4 52 -1.8 83 -2.3 304
According to DLVO theory, all particles undergo significant repulsion from the sand grains,
305
with ΔGtotmax equal to 175 kBT for PSL COOH 200, 235 kBT for PSL COOH 430-P, 244 kBT for NPT
306
350-P, and 321 kBT for NPT 460-P (Table 3 and full lines in Figure 2a). Based on the energy profiles,
307
no colloid can overcome the energy barrier (ΔGtotmax) and irreversibly deposit in the primary minimum
308
(ΔGtotmin1). The secondary energetic minimum (ΔGtotmin2) occurs between 20 and 60 nm from the sand
309
surface. It varies from as low as -2.3 kBT for NPT 460-P, -2.2 kBT for PSL COOH 430-P, -1.6 kBT for
310
NPT 460-P to -0.7 kBT for PSL COOH 200 (Table 3 and full lines in Figure 2c). For the three larger
311
particles, reversible retention in the secondary energetic minimum can occur since the depth is larger
312
than 1.5 kBT, which is the thermal energy of diffusion (Israelachvili, 2015).
313 314 315 316 317 318 319 320 321 322 323
a
b
0
50
100
B15
10
20
30
40
50
60
-4
-2
0
2
4
In
te
ra
ct
io
n
e
n
er
g
y
(
k
BT
)
Distance of separation (nm)
324 325 326 327 328 329 330 331 332 333 334 335 336 337 338 339Figure 2: Interaction energy, scaled to kBT, between the nanoplastic models and the sand grain collector as a function of
340
distance according to a) DLVO theory (full lines) and SEI -modified DLVO theory (dashed lines) and b) XDLVO theory. The
341
identical data is replotted in c) and d) to highlight the secondary energetic minimum of panels a) and b) respectively.
342
343
By accounting for the polar component of the interaction energy, the XDLVO theory predicts
344
similar global trends but indicates a much lower repulsion of all particles from the sand surface
345
(Figures 2b and 2d). The maximum heights of ΔGtotmax for spherical particles PSL COOH 200 and PSL
346
COOH 430-P are equal to 51 kBT and 74 kBT, respectively. For the asymmetrical and irregularly
347
shaped particles, ΔGtotmax is comparable: 64 kBT and 83 kBT for NPT 350-P and NPT 460-P,
348
respectively (Table 3 and Figure 2b). Based on the height of the energy barriers, still no colloid
349 PSL COOH 200 PSL COOH 430-P NPT 350-P PSL COOH 430-P NPT 350-P NPT 460-P NPT 350-P at φ = π/3 NPT 460-P at φ = π/3
16
deposition should occur in the primary minima. The depth of the secondary energetic minimum
350
(ΔGtotmin2) is unchanged compared to that determined by the DLVO theory (Table 3 and Figure 2d).
351
The dashed lines in Figures 2a and 2c show the minimal interaction energy between the sand
352
surface and the NPT-P models, according to the SEI-modified DLVO theory. This occurs when they
353
form an angle (φ) of π/3 with the collector surface (Gomez-Flores et al., 2019). ΔGtotmax is reduced to
354
45 kBT and 52 kBT for NPT 350-P and NPT 460-P, respectively (Table 3). The interaction energy is
355
maximal at φ = 0 (Table 3 and Figure S4). This is mostly due to the fact the particle surface is closer to
356
the collector (Gomez-Flores et al., 2019). ΔGtotmin2 is only slightly less deep than predicted by DLVO
357
and XDLVO theories (Table 3 and Figure 2c).
358
The high retention rate of the NPT-P particles can be in part attributed to the fact that they
359
may find orientations where there is no energy barrier to irreversible deposition (ΔGtotmin1)
(Gomez-360
Flores et al., 2019). This can be expected to occur when both particle orientation and hydrophobicity
361
are accounted for simultaneously. Furthermore, the magnitude of the total energies of interaction
362
(ΔGtot) of PSL COOH 430-P, NPT 350-P and NPT 460-Ps and the sand surfaces may be overestimated
363
by the all DLVO models due to their surface roughness (Table 1 and Figure S2) (Bhattacharjee et al.,
364
1998; Hoek and Agarwal, 2006). NPT-P particles are characterized by a large range of
orientation-365
dependent interaction energies (Table 3 and S5), which will give them considerable torque. This added
366
torque can provide the particles sufficient kinetic energy to overcome an energy barrier (ΔGtotmax) that
367
is significantly reduced at some orientations Figure 2a (Seymour et al., 2013).
368
However, the DLVO and XDLVO theories are inadequate to predict the deposition of plastic
369
nanoparticles in porous media. On the one hand, the DLVO and XDLVO theories globally
370
underestimate the amount of deposition that particles undergo. This is a well-known effect when
371
studying the transport of particles in unfavorable (repulsive) conditions (Elimelech and O’Melia,
372
1990). On the other hand, the height of the energy barrier is not proportional to the level of repulsion,
373
nor is the depth of the secondary energetic minimum proportional to the level of deposition. For
374
example, PSL COOH 200 is the most transported particle, although it has the lowest energy barrier
375
(ΔGtotmax). This occurs because all interaction energies scale linearly with particle size (Elimelech and
17
O’Melia, 1990). In other words, larger particles should undergo more repulsion and be more
377
transported, especially since all particles present comparable polar components of the surface free
378
energy (γAB) and zeta potentials (ζN). However, contrary to these DLVO and XDLVO predictions,
379
NPT 460-P, which has a higher energy barrier, is more deposited than NPT 350-P. Although a high 380
energy barrier is present, particles may be retained by 1) attachment onto chemical heterogeneities on
381
the colloid and collector surfaces that act as favorable sites (Seymour et al., 2013; Tufenkji and
382
Elimelech, 2005) 2) reversible attachment in the secondary energetic minimum (Tufenkji and
383
Elimelech, 2005) and 3) straining (trapping of particles in pore throats that are too small to allow the
384
passage of particles) (Bradford et al., 2002; McDowell-Boyer et al., 1986). Furthermore, pore
385
geometry creates a variety of speed profiles, such that particles may also be retained in zones with a
386
lower flow velocity where the hydrodynamic forces are lowered (Elimelech and O’Melia, 1990).
387
Indeed, pore geometry plays a dominant role in colloid retention under conditions where a high energy
388
barrier exists (Tong and Johnson, 2006).
389
To determine the extent to which deposition can be attributed to chemical heterogeneity, batch
390
adsorption experiments were conducted. The results, presented in S5, show that none of our plastic
391
nanoparticles are significantly adsorbed onto the sand. While results from batch and column
392
experiments can be difficult to compare when they are not normalized by αV =1, our batch experiments
393
do show that chemical heterogeneity is far from significative (Geitner et al., 2017; Treumann et al.,
394
2014). This points to the importance of straining and adsorption in the secondary energetic minimum.
18 396
Figure 3: z-average hydrodynamic diameters (dzH) of the plastic nanoparticles before and after flowing through the sand
397
column (n=6, error bars= standard deviation).
398
The evolution of the hydrodynamic diameters of the particles injected in and eluted from
399
through the porous media can also indicate what processes occur in the column (Figure 3). The
400
average size and polydispersity of eluted particles were constant during elution. The average
401
hydrodynamic diameters (dzH) of the smaller spheres, PSL COOH 200, do not change significantly
402
(+4%). The larger spherical particles, PSL COOH 430-P, undergo a more pronounced decrease in dzH
403
after flowing through the sand column (-11%). Both spherical particles’ polydispersities do not vary
404
significantly. For the asymmetrical NPT models, the decrease in dzH after elution is globally greater
405
and even more pronounced for the larger particles (-45% for NPT 460-P) compared to that of the
406
smaller particles
407
(-20% for NPT 350-P). The smaller size fraction of irregularly shaped particles, approximately 200 nm
408
in diameter, is most mobile in the sand column. Furthermore, the polydispersity of the samples
409
containing asymmetrical and irregular particles decreases. These changes in size point to a mechanism
410
of physical retention of spherical particles larger than 380 nm and irregularly shaped particles larger
411
than approximately 200 nm. This confirms that large particles are deposited by physical straining in
412
the pores of the sand column, which is unaccounted for by the DLVO theories and underestimated by
19
CFT (Bradford et al., 2002). In similar experimental conditions, Weiss et al. (Weiss et al., 1995) noted
414
a similar effect concerning the transport of 14 different bacterial strains. The bacterial cells recovered
415
in the eluent were not only smaller but also rounder than the cells injected.
416
The deposition rate increases as the particle size increases and as its shape deviates from that
417
of a sphere. In other words, smaller and smoother particles are more easily transported. This can be
418
partially attributed to straining. Straining is expected to start having an effect when the ratio of the
419
particle radius to the median collector radius (dp/d50) exceeds 0.0017 (Bradford et al., 2002). This is
420
satisfied in the case of PSL COOH 430-P (dp/d50 = 0.002). Concerning NPT-Ps, since most particles
421
larger than approximately 200 nm are retained, straining occurs at a lower dp/d50 ratio (Figure 3).
422
Straining of these particles is enhanced because the hydrodynamics of nonspherical particle flow in
423
porous media are more complex than those of spherical particles. In highly repulsive conditions
424
(thousands of kBT), elongated particles and are not more deposited than spherical particles since they
425
can orient their major axis parallel to the flow (Xu et al., 2008). However, in our conditions, where
426
there is less repulsion (10s of kBT) nonspherical particles are increasingly deposited. This is attributed
427
to larger collision frequencies with the porous media (Salerno et al., 2006). The CFT underestimates
428
the single-collector contact efficiency (η0) for spheroidal particles (Salerno et al., 2006). Finally, the
429
NPT-P dispersions are highly polydisperse and as such will contain a higher fraction of large particles 430
that are likely to be retained.
431
As mentioned above, reversible deposition in the secondary energetic minimum is possible for
432
PSL COOH 430-P and both polymorphic particles NPT 350-P and NPT 460-P. The asymmetrical 433
BTC shape of the PSL COOH 430-P is typical of either particle release from the secondary energetic
434
minimum or blocking of the flowing particles by previously deposited particles (Bradford et al., 2002;
435
Bradford and Bettahar, 2006; Redman et al., 2004; Tufenkji and Elimelech, 2005). This was not
436
observed for NPT 350-P and NPT 460-P, whose BTCs instead reach a plateau. It indicates either that
437
the asymmetrical models are not detached and undergoing re-entrainment from the sand or that
438
deposited particles do not block the incoming particles. Colloidal detachment and re-entrainment from
439
the secondary energetic minimum mostly occur by rolling, which is easiest for spherical particles.
20
Despite the fact that nonspherical particles have larger hydrodynamic torques than spherical particles,
441
as particles deviate from an ideal spherical shape, they present a higher moment arm requiring more
442
energy to induce rolling (Bergendahl and Grasso, 2000; Seymour et al., 2013) The flat BTC may also
443
indicate that deposited particles create more favorable sites for deposition by increasing the physical
444
roughness of the porous media (Seymour et al., 2013). Finally, the shape of the NPT-P’s BTCs
445
suggest that reversible deposition not be as dominant a mechanism as straining and deposition in the
446
primary energetic minimum.
447
4. Conclusion
448
This study showed that the physicochemical properties of the NPT models significantly affect
449
their propensity to be transported. The asymmetrical and irregular shape of the environmentally
450
relevant NPT model has a strikingly positive impact on the deposition rate in the sand column
451
compared to that impact of particle size, composition or concentration. The deposition of these models
452
in the porous media may be attributed partially to physical retention, as witnessed by the straining of
453
the larger size fractions. Their deposition is also attributed to an orientation-dependent level of
454
repulsion (ΔGtotmax) which allows the particles to take on the most thermodynamically preferable
455
orientation, and possibly to overcome the energy barrier to irreversible deposition (ΔGtotmax), given
456
sufficient hydodynamic torque. These results point to the importance of choosing environmentally
457
relevant NPT models. Their asymmetrical and irregular shape, which is characteristic of the
458
mechanical abrasion of plastic debris, increases their deposition rate in a sand column by an order of
459
magnitude. It is clear that the relevance of environmental fate studies depends upon the quality of the
460
proxies used (Koelmans, 2019). More particularly, the impact of the NPT composition (polymer type,
461
additives and sorbed contaminants), average size and size distribution as well as NPT shape are crucial
462
parameters to study (Wagner and Reemtsma, 2019).
463
The importance of the physical and chemical properties of the NPT models has been
464
demonstrated here. Further studies are needed on the one hand, to define single-collector contact
465
efficiency (η0) for nonspherical particles and to quantify the amount of deposition that can be
466
attributed to straining, irreversible attachment (in ΔGtotmin1) and reversible attachment (in ΔGtotmin2). On
21
the other hand, more research is needed to implement these results by taking into account the
468
environmental conditions of the porous media (ionic strength, natural organic matter, pH value, and
469
soil composition). Such a complete approach is needed to fully assess the fate of NPTs in freshwater
470
and terrestrial environments.
471
472
Competing Interest Statement
473
The authors declare that they have no competing interests.
474
References
475
Allen, S., Allen, D., Phoenix, V.R., Le Roux, G., Durántez Jiménez, P., Simonneau, A., Binet, S., Galop, 476
D., 2019. Atmospheric transport and deposition of microplastics in a remote mountain 477
catchment. Nature Geoscience. https://doi.org/10.1038/s41561-019-0335-5 478
Bank, M.S., Hansson, S.V., 2019. The Plastic Cycle: A Novel and Holistic Paradigm for the 479
Anthropocene. Environ. Sci. Technol. acs.est.9b02942. 480
https://doi.org/10.1021/acs.est.9b02942 481
Barhoumi, H., Maaref, A., Jaffrezic-Renault, N., 2010. Experimental Study of Thermodynamic Surface 482
Characteristics and pH Sensitivity of Silicon Dioxide and Silicon Nitride. Langmuir 26, 7165– 483
7173. https://doi.org/10.1021/la904251m 484
Bergendahl, J., Grasso, D., 2000. Prediction of colloid detachment in a model porous media: 485
hydrodynamics. Chemical Engineering Science 55, 1523–1532. 486
https://doi.org/10.1016/S0009-2509(99)00422-4 487
Bhattacharjee, S., Chen, J.Y., Elimelech, M., 2000. DLVO interaction energy between spheroidal 488
particles and a flat surface. Colloids and Surfaces A: Physicochemical and Engineering Aspects 489
165, 143–156. https://doi.org/10.1016/S0927-7757(99)00448-3 490
Bhattacharjee, S., Ko, C.-H., Elimelech, M., 1998. DLVO Interaction between Rough Surfaces. 491
Langmuir 14, 3365–3375. https://doi.org/10.1021/la971360b 492
Bradford, S.A., Bettahar, M., 2006. Concentration dependent transport of colloids in saturated 493
porous media. Journal of Contaminant Hydrology 82, 99–117. 494
https://doi.org/10.1016/j.jconhyd.2005.09.006 495
Bradford, S.A., Yates, S.R., Bettahar, M., Simunek, J., 2002. Physical factors affecting the transport 496
and fate of colloids in saturated porous media: FACTORS AFFECTING THE FATE OF COLLOIDS. 497
Water Resources Research 38, 63-1-63–12. https://doi.org/10.1029/2002WR001340 498
Carpenter, E.J., Smith, K.L., 1972. Plastics on the Sargasso Sea Surface. Science 175, 1240–1241. 499
https://doi.org/10.1126/science.175.4027.1240 500
Carr, S.A., Liu, J., Tesoro, A.G., 2016. Transport and fate of microplastic particles in wastewater 501
treatment plants. Water Research 91, 174–182. 502
https://doi.org/10.1016/j.watres.2016.01.002 503
Cozar, A., Echevarria, F., Gonzalez-Gordillo, J.I., Irigoien, X., Ubeda, B., Hernandez-Leon, S., Palma, 504
A.T., Navarro, S., Garcia-de-Lomas, J., Ruiz, A., Fernandez-de-Puelles, M.L., Duarte, C.M., 505
2014. Plastic debris in the open ocean. Proceedings of the National Academy of Sciences 111, 506
10239–10244. https://doi.org/10.1073/pnas.1314705111 507
Dong, Z., Zhang, W., Qiu, Y., Yang, Z., Wang, J., Zhang, Y., 2019a. Cotransport of nanoplastics (NPs) 508
with fullerene (C60) in saturated sand: Effect of NPs/C60 ratio and seawater salinity. Water 509
Research 148, 469–478. https://doi.org/10.1016/j.watres.2018.10.071 510
22
Dong, Z., Zhu, L., Zhang, W., Huang, R., Lv, X., Jing, X., Yang, Z., Wang, J., Qiu, Y., 2019b. Role of 511
surface functionalities of nanoplastics on their transport in seawater-saturated sea sand. 512
Environmental Pollution 255, 113177. https://doi.org/10.1016/j.envpol.2019.113177 513
Elimelech, M., O’Melia, C.R., 1990. Effect of particle size on collision efficiency in the deposition of 514
Brownian particles with electrostatic energy barriers. Langmuir 6, 1153–1163. 515
https://doi.org/10.1021/la00096a023 516
Galloway, T.S., 2015. Micro- and Nano-plastics and Human Health, in: Bergmann, M., Gutow, L., 517
Klages, M. (Eds.), Marine Anthropogenic Litter. Springer International Publishing, Cham, pp. 518
343–366. https://doi.org/10.1007/978-3-319-16510-3_13 519
Geitner, N.K., O’Brien, N.J., Turner, A.A., Cummins, E.J., Wiesner, M.R., 2017. Measuring Nanoparticle 520
Attachment Efficiency in Complex Systems. Environmental Science & Technology 51, 13288– 521
13294. https://doi.org/10.1021/acs.est.7b04612 522
Gewert, B., Plassmann, M.M., MacLeod, M., 2015. Pathways for degradation of plastic polymers 523
floating in the marine environment. Environmental Science: Processes & Impacts 17, 1513– 524
1521. https://doi.org/10.1039/C5EM00207A 525
Gigault, J., Halle, A. ter, Baudrimont, M., Pascal, P.-Y., Gauffre, F., Phi, T.-L., El Hadri, H., Grassl, B., 526
Reynaud, S., 2018. Current opinion: What is a nanoplastic? Environmental Pollution 235, 527
1030–1034. https://doi.org/10.1016/j.envpol.2018.01.024 528
Gigault, J., Pedrono, B., Maxit, B., Halle, A.T., 2016. Marine plastic litter: the unanalyzed nano-529
fraction. Environ. Sci.: Nano 3, 346–350. https://doi.org/10.1039/C6EN00008H 530
Gomez-Flores, A., Bradford, S.A., Wu, L., Kim, H., 2019. Interaction energies for hollow and solid 531
cylinders: Role of aspect ratio and particle orientation. Colloids and Surfaces A: 532
Physicochemical and Engineering Aspects 580, 123781. 533
https://doi.org/10.1016/j.colsurfa.2019.123781 534
Hadri, H.E., Gigault, J., Maxit, B., Grassl, B., Reynaud, S., 2020. Nanoplastic from mechanically 535
degraded primary and secondary microplastics for environmental assessments. NanoImpact 536
100206. https://doi.org/10.1016/j.impact.2019.100206 537
Hartmann, N.B., Hüffer, T., Thompson, R.C., Hassellöv, M., Verschoor, A., Daugaard, A.E., Rist, S., 538
Karlsson, T., Brennholt, N., Cole, M., Herrling, M.P., Hess, M.C., Ivleva, N.P., Lusher, A.L., 539
Wagner, M., 2019. Are We Speaking the Same Language? Recommendations for a Definition 540
and Categorization Framework for Plastic Debris. Environ. Sci. Technol. 53, 1039–1047. 541
https://doi.org/10.1021/acs.est.8b05297 542
He, L., Wu, D., Rong, H., Li, M., Tong, M., Kim, H., 2018. Influence of Nano- and Microplastic Particles 543
on the Transport and Deposition Behaviors of Bacteria in Quartz Sand. Environ. Sci. Technol. 544
acs.est.8b01673. https://doi.org/10.1021/acs.est.8b01673 545
Hiemenz, P.C., Rajagopalan, Raj., 1997. Principles of colloid and surface chemistry. Dekker, New York; 546
Basel; Hong Kong. 547
Hoek, E.M.V., Agarwal, G.K., 2006. Extended DLVO interactions between spherical particles and 548
rough surfaces. Journal of Colloid and Interface Science 298, 50–58. 549
https://doi.org/10.1016/j.jcis.2005.12.031 550
Horton, A.A., Walton, A., Spurgeon, D.J., Lahive, E., Svendsen, C., 2017. Microplastics in freshwater 551
and terrestrial environments: Evaluating the current understanding to identify the 552
knowledge gaps and future research priorities. Science of The Total Environment 586, 127– 553
141. https://doi.org/10.1016/j.scitotenv.2017.01.190 554
Hotze, E.M., Phenrat, T., Lowry, G.V., 2010. Nanoparticle Aggregation: Challenges to Understanding 555
Transport and Reactivity in the Environment. Journal of Environment Quality 39, 1909. 556
https://doi.org/10.2134/jeq2009.0462 557
Hu, E., Shang, S., Fu, Z., Zhao, X., Nan, X., Du, Y., Chen, X., 2020. Cotransport of naphthalene with 558
polystyrene nanoplastics (PSNP) in saturated porous media: Effects of PSNP/naphthalene 559
ratio and ionic strength. Chemosphere 245, 125602. 560
https://doi.org/10.1016/j.chemosphere.2019.125602 561
23
Huerta Lwanga, E., Mendoza Vega, J., Ku Quej, V., Chi, J. de los A., Sanchez del Cid, L., Chi, C., 562
Escalona Segura, G., Gertsen, H., Salánki, T., van der Ploeg, M., Koelmans, A.A., Geissen, V., 563
2017. Field evidence for transfer of plastic debris along a terrestrial food chain. Sci Rep 7, 564
14071. https://doi.org/10.1038/s41598-017-14588-2 565
Israelachvili, J.N., 2015. Intermolecular and surface forces. 566
Jambeck, J.R., Geyer, R., Wilcox, C., Siegler, T.R., Perryman, M., Andrady, A., Narayan, R., Law, K.L., 567
2015. Plastic waste inputs from land into the ocean. Science 347, 768–771. 568
https://doi.org/10.1126/science.1260352 569
Jamieson, A.J., Malkocs, T., Piertney, S.B., Fujii, T., Zhang, Z., 2017. Bioaccumulation of persistent 570
organic pollutants in the deepest ocean fauna. Nat Ecol Evol 1, 51. 571
https://doi.org/10.1038/s41559-016-0051 572
Koelmans, A.A., 2019. Proxies for nanoplastic. Nature Nanotechnology 14, 307–308. 573
https://doi.org/10.1038/s41565-019-0416-z 574
Koelmans, Albert A., Besseling, E., Foekema, E., Kooi, M., Mintenig, S., Ossendorp, B.C., Redondo-575
Hasselerharm, P.E., Verschoor, A., van Wezel, A.P., Scheffer, M., 2017. Risks of Plastic Debris: 576
Unravelling Fact, Opinion, Perception, and Belief. Environ. Sci. Technol. 51, 11513–11519. 577
https://doi.org/10.1021/acs.est.7b02219 578
Koelmans, Albert A, Kooi, M., Law, K.L., van Sebille, E., 2017. All is not lost: deriving a top-down mass 579
budget of plastic at sea. Environmental Research Letters 12, 114028. 580
https://doi.org/10.1088/1748-9326/aa9500 581
Lambert, S., Wagner, M., 2016. Characterisation of nanoplastics during the degradation of 582
polystyrene. Chemosphere 145, 265–268. 583
https://doi.org/10.1016/j.chemosphere.2015.11.078 584
Law, K.L., Moret-Ferguson, S., Maximenko, N.A., Proskurowski, G., Peacock, E.E., Hafner, J., Reddy, 585
C.M., 2010. Plastic Accumulation in the North Atlantic Subtropical Gyre. Science 329, 1185– 586
1188. https://doi.org/10.1126/science.1192321 587
Lecoanet, H.F., Bottero, J.-Y., Wiesner, M.R., 2004. Laboratory Assessment of the Mobility of 588
Nanomaterials in Porous Media. Environmental Science & Technology 38, 5164–5169. 589
https://doi.org/10.1021/es0352303 590
Lehner, R., Weder, C., Petri-Fink, A., Rothen-Rutishauser, B., 2019. Emergence of Nanoplastic in the 591
Environment and Possible Impact on Human Health. Environmental Science & Technology. 592
https://doi.org/10.1021/acs.est.8b05512 593
Liu, J., Zhang, T., Tian, L., Liu, X., Qi, Z., Ma, Y., Ji, R., Chen, W., 2019. Aging Significantly Affects 594
Mobility and Contaminant-mobilizing Ability of Nanoplastics in Saturated Loamy Sand. 595
Environ. Sci. Technol. acs.est.9b00787. https://doi.org/10.1021/acs.est.9b00787 596
McDowell-Boyer, L.M., Hunt, J.R., Sitar, N., 1986. Particle transport through porous media. Water 597
Resour. Res. 22, 1901–1921. https://doi.org/10.1029/WR022i013p01901 598
Ng, E.-L., Huerta Lwanga, E., Eldridge, S.M., Johnston, P., Hu, H.-W., Geissen, V., Chen, D., 2018. An 599
overview of microplastic and nanoplastic pollution in agroecosystems. Science of The Total 600
Environment 627, 1377–1388. https://doi.org/10.1016/j.scitotenv.2018.01.341 601
Obbard, R.W., Sadri, S., Wong, Y.Q., Khitun, A.A., Baker, I., Thompson, R.C., 2014. Global warming 602
releases microplastic legacy frozen in Arctic Sea ice. Earth’s Future 2, 315–320. 603
https://doi.org/10.1002/2014EF000240 604
Pelley, A.J., Tufenkji, N., 2008. Effect of particle size and natural organic matter on the migration of 605
nano- and microscale latex particles in saturated porous media. Journal of Colloid and 606
Interface Science 321, 74–83. https://doi.org/10.1016/j.jcis.2008.01.046 607
Peng, G., Bellerby, R., Zhang, F., Sun, X., Li, D., 2020. The ocean’s ultimate trashcan: Hadal trenches as 608
major depositories for plastic pollution. Water Research 168, 115121. 609
https://doi.org/10.1016/j.watres.2019.115121 610
Pessoni, L., Veclin, C., El Hadri, H., Cugnet, C., Davranche, M., Pierson-Wickmann, A.-C., Gigault, J., 611
Grassl, B., Reynaud, S., 2019. Soap- and metal-free polystyrene latex particles as a 612
nanoplastic model. Environ. Sci.: Nano 6, 2253–2258. https://doi.org/10.1039/C9EN00384C 613
24
Petosa, A.R., Jaisi, D.P., Quevedo, I.R., Elimelech, M., Tufenkji, N., 2010. Aggregation and Deposition 614
of Engineered Nanomaterials in Aquatic Environments: Role of Physicochemical Interactions. 615
Environmental Science & Technology 44, 6532–6549. https://doi.org/10.1021/es100598h 616
Quevedo, I.R., Tufenkji, N., 2012. Mobility of Functionalized Quantum Dots and a Model Polystyrene 617
Nanoparticle in Saturated Quartz Sand and Loamy Sand. Environmental Science & 618
Technology 46, 4449–4457. https://doi.org/10.1021/es2045458 619
Redman, J.A., Walker, S.L., Elimelech, M., 2004. Bacterial Adhesion and Transport in Porous Media: 620
Role of the Secondary Energy Minimum. Environ. Sci. Technol. 38, 1777–1785. 621
https://doi.org/10.1021/es034887l 622
Rillig, M.C., 2012. Microplastic in Terrestrial Ecosystems and the Soil? Environmental Science & 623
Technology 46, 6453–6454. https://doi.org/10.1021/es302011r 624
Salerno, M.B., Flamm, M., Logan, B.E., Velegol, D., 2006. Transport of Rodlike Colloids through 625
Packed Beds. Environ. Sci. Technol. 40, 6336–6340. https://doi.org/10.1021/es0614565 626
Scheurer, M., Bigalke, M., 2018. Microplastics in Swiss Floodplain Soils. Environ. Sci. Technol. 52, 627
3591–3598. https://doi.org/10.1021/acs.est.7b06003 628
Schwarz, A.E., Ligthart, T.N., Boukris, E., van Harmelen, T., 2019. Sources, transport, and 629
accumulation of different types of plastic litter in aquatic environments: A review study. 630
Marine Pollution Bulletin 143, 92–100. https://doi.org/10.1016/j.marpolbul.2019.04.029 631
Seymour, M.B., Chen, G., Su, C., Li, Y., 2013. Transport and Retention of Colloids in Porous Media: 632
Does Shape Really Matter? Environ. Sci. Technol. 130722083052008. 633
https://doi.org/10.1021/es4016124 634
Syngouna, V.I., Chrysikopoulos, C.V., 2013. Cotransport of clay colloids and viruses in water saturated 635
porous media. Colloids and Surfaces A: Physicochemical and Engineering Aspects 416, 56–65. 636
https://doi.org/10.1016/j.colsurfa.2012.10.018 637
Ter Halle, A., Jeanneau, L., Martignac, M., Jardé, E., Pedrono, B., Brach, L., Gigault, J., 2017. 638
Nanoplastic in the North Atlantic Subtropical Gyre. Environmental Science & Technology 51, 639
13689–13697. https://doi.org/10.1021/acs.est.7b03667 640
Tong, M., Johnson, W.P., 2006. Excess Colloid Retention in Porous Media as a Function of Colloid 641
Size, Fluid Velocity, and Grain Angularity. Environ. Sci. Technol. 40, 7725–7731. 642
https://doi.org/10.1021/es061201r 643
Treumann, S., Torkzaban, S., Bradford, S.A., Visalakshan, R.M., Page, D., 2014. An explanation for 644
differences in the process of colloid adsorption in batch and column studies. Journal of 645
Contaminant Hydrology 164, 219–229. https://doi.org/10.1016/j.jconhyd.2014.06.007 646
Tufenkji, N., Elimelech, M., 2005. Breakdown of Colloid Filtration Theory: Role of the Secondary 647
Energy Minimum and Surface Charge Heterogeneities. Langmuir 21, 841–852. 648
https://doi.org/10.1021/la048102g 649
Tufenkji, N., Elimelech, M., 2004. Correlation Equation for Predicting Single-Collector Efficiency in 650
Physicochemical Filtration in Saturated Porous Media. Environmental Science & Technology 651
38, 529–536. https://doi.org/10.1021/es034049r 652
Valsesia, A., Desmet, C., Ojea-Jiménez, I., Oddo, A., Capomaccio, R., Rossi, F., Colpo, P., 2018. Direct 653
quantification of nanoparticle surface hydrophobicity. Commun Chem 1, 53. 654
https://doi.org/10.1038/s42004-018-0054-7 655
van Sebille, E., Wilcox, C., Lebreton, L., Maximenko, N., Hardesty, B.D., van Franeker, J.A., Eriksen, M., 656
Siegel, D., Galgani, F., Law, K.L., 2015. A global inventory of small floating plastic debris. 657
Environmental Research Letters 10, 124006. https://doi.org/10.1088/1748-658
9326/10/12/124006 659
Verleysen, E., Wagner, T., Lipinski, H.-G., Kägi, R., Koeber, R., Boix-Sanfeliu, A., De Temmerman, P.-J., 660
Mast, J., 2019. Evaluation of a TEM based Approach for Size Measurement of Particulate 661
(Nano)materials. Materials 12, 2274. https://doi.org/10.3390/ma12142274 662
Vinogradov, J., Jaafar, M.Z., Jackson, M.D., 2010. Measurement of streaming potential coupling 663
coefficient in sandstones saturated with natural and artificial brines at high salinity. J. 664
Geophys. Res. 115, B12204. https://doi.org/10.1029/2010JB007593 665
25
Wagner, M., Scherer, C., Alvarez-Muñoz, D., Brennholt, N., Bourrain, X., Buchinger, S., Fries, E., 666
Grosbois, C., Klasmeier, J., Marti, T., Rodriguez-Mozaz, S., Urbatzka, R., Vethaak, A.D., 667
Winther-Nielsen, M., Reifferscheid, G., 2014. Microplastics in freshwater ecosystems: what 668
we know and what we need to know. Environmental Sciences Europe 26. 669
https://doi.org/10.1186/s12302-014-0012-7 670
Wagner, S., Reemtsma, T., 2019. Things we know and don’t know about nanoplastic in the 671
environment. Nature Nanotechnology 14, 300–301. https://doi.org/10.1038/s41565-019-672
0424-z 673
Weiss, T.H., Mills, A.L., Hornberger, G.M., Herman, J.S., 1995. Effect of Bacterial Cell Shape on 674
Transport of Bacteria in Porous Media. Environ. Sci. Technol. 29, 1737–1740. 675
https://doi.org/10.1021/es00007a007 676
Wu, J., Jiang, R., Lin, W., Ouyang, G., 2019. Effect of salinity and humic acid on the aggregation and 677
toxicity of polystyrene nanoplastics with different functional groups and charges. 678
Environmental Pollution 245, 836–843. https://doi.org/10.1016/j.envpol.2018.11.055 679
Wu, L., Gao, B., Tian, Y., Muñoz-Carpena, R., Zigler, K.J., 2013. DLVO Interactions of Carbon 680
Nanotubes with Isotropic Planar Surfaces. Langmuir 29, 3976–3988. 681
https://doi.org/10.1021/la3048328 682
Xu, S., Liao, Q., Saiers, J.E., 2008. Straining of nonspherical colloids in saturated porous media. 683
Environ. Sci. Technol. 42, 771–778. https://doi.org/10.1021/es071328w 684