HAL Id: hal-00298887
https://hal.archives-ouvertes.fr/hal-00298887
Submitted on 11 Sep 2007HAL is a multi-disciplinary open access
archive for the deposit and dissemination of sci-entific research documents, whether they are pub-lished or not. The documents may come from teaching and research institutions in France or abroad, or from public or private research centers.
L’archive ouverte pluridisciplinaire HAL, est destinée au dépôt et à la diffusion de documents scientifiques de niveau recherche, publiés ou non, émanant des établissements d’enseignement et de recherche français ou étrangers, des laboratoires publics ou privés.
Impact of changing DOC concentrations on the potential
distribution of acid sensitive biota in a boreal stream
network
H. Laudon, I. Buffam
To cite this version:
H. Laudon, I. Buffam. Impact of changing DOC concentrations on the potential distribution of acid sensitive biota in a boreal stream network. Hydrology and Earth System Sciences Discussions, European Geosciences Union, 2007, 4 (5), pp.3145-3173. �hal-00298887�
HESSD
4, 3145–3173, 2007Impact of changing DOC concentrations
H. Laudon and I. Buffam
Title Page Abstract Introduction Conclusions References Tables Figures ◭ ◮ ◭ ◮ Back Close
Full Screen / Esc
Printer-friendly Version Interactive Discussion
EGU
Hydrol. Earth Syst. Sci. Discuss., 4, 3145–3173, 2007 www.hydrol-earth-syst-sci-discuss.net/4/3145/2007/ © Author(s) 2007. This work is licensed
under a Creative Commons License.
Hydrology and Earth System Sciences Discussions
Papers published in Hydrology and Earth System Sciences Discussions are under open-access review for the journal Hydrology and Earth System Sciences
Impact of changing DOC concentrations
on the potential distribution of acid
sensitive biota in a boreal stream network
H. Laudon1and I. Buffam2
1
Department of Ecology and Environmental Sciences, Ume ˚a University, Ume ˚a, Sweden
2
Department of Forest Ecology, Swedish University of Agricultural Sciences, Ume ˚a, Sweden Received: 2 November 2006 – Accepted: 12 January 2007 – Published: 11 September 2007 Correspondence to: H. Laudon ([email protected])
HESSD
4, 3145–3173, 2007Impact of changing DOC concentrations
H. Laudon and I. Buffam
Title Page Abstract Introduction Conclusions References Tables Figures ◭ ◮ ◭ ◮ Back Close
Full Screen / Esc
Printer-friendly Version Interactive Discussion
EGU
Abstract
DOC concentrations have increased in many surface waters in Europe and North America over the past few decades. As DOC exerts a strong influence on pH this DOC increase could have detrimental effects on acid sensitive biota in many streams and lakes. To investigate the potential implications of changes in the DOC concentration 5
on stream water biota, we have used a mesoscale boreal stream network in northern Sweden as a case study. The network was sampled for stream water chemistry at 60 locations during both winter base flow and spring flood periods, representing the ex-tremes experienced annually in these streams both in terms of discharge and acidity. The effect of changing DOC on pH was modeled for all sampling locations using an 10
organic acid model, with input DOC concentrations for different scenarios adjusted by between –30% and +50% from measured present concentrations. The resulting effect on pH was then used to quantify the proportion of stream length in the catchment with pH below the acid thresholds of pH 5.5 and pH 5.0. The results suggest that a change in stream water DOC during base flow would have only a limited effect on pH and 15
hence on the stream length with pH below the acid thresholds. During the spring flood on the other hand a change in DOC would strongly influence pH and the stream length with pH below the acid thresholds. For example an increase in DOC concentration of 30% at all sites would increase the proportion of stream length with pH below 5.5 from 37% to 65%, and the proportion of stream length with pH below 5.0 would increase 20
from 18% to 27%. The results suggest that in poorly-buffered high DOC waters, even a marginal change in the DOC concentration could impact acid sensitive biota in a large portion of the aquatic landscape.
1 Introduction
The snow melt period is a recurring ecological challenge for aquatic organisms in many 25
hydro-HESSD
4, 3145–3173, 2007Impact of changing DOC concentrations
H. Laudon and I. Buffam
Title Page Abstract Introduction Conclusions References Tables Figures ◭ ◮ ◭ ◮ Back Close
Full Screen / Esc
Printer-friendly Version Interactive Discussion
EGU
chemical changes that profoundly affect aquatic ecosystems due to changes in pH and inorganic aluminium concentrations (Laudon et al., 2005; Simonin et al., 1993). The snow melt period is also susceptible to anthropogenic perturbations to water quality that can further impact the biota of surface waters.
The mean annual temperature in Sweden is expected to increase by 3 to 5◦C during
5
the coming century as a result of the burning of fossil fuels (Kjellstr ¨om, 2004). This increase is predicted to be more prominent in the northern part of the country and biased towards the winter season. Recent predictions also suggest that these north-ern ecosystems are among the regions that will be most affected in terms of surface water hydrology and biogeochemistry (Barnett et al., 2005). Another important impli-10
cation of climate change for northern ecosystems is the expected change in the timing, extent and duration of the snow cover (Ven ¨al ¨ainen et al., 2001). The snow not only provides a major fraction of the annual water budget, but also plays a fundamental role in regulating the winter biogeochemistry of forest soils (Groffman et al., 2001). How the predicted change in winter conditions will affect the water quality of streams, rivers 15
and lakes in the boreal region is presently not well understood.
Besides contributing the largest component of the ion balance in many boreal surface waters, dissolved organic carbon (DOC) is important for complexing and transporting metals (Rember and Trefry, 2004) as well as a carbon and energy source in the aquatic food web (Jansson et al., 2000). In northern Sweden the spring flood DOC concen-20
tration is of particular interest because many surface waters experience a pH decline of one to two pH units driven primarily by a transient increase in DOC during snow melt (Laudon et al., 2001). A change in the DOC concentration during the spring flood could hence affect the pH decline occurring in the region and alter the suitability for acid sensitive organisms to dwell in certain streams in the future.
25
Recent studies in Europe have reported increasing concentrations of DOC in many surface waters. For example, several trend analyses investigations in the UK have shown significantly increasing concentrations the last decades (Evans et al., 2005; Worrall et al., 2004). Similar trends have also been reported from Norway (Hongve et
HESSD
4, 3145–3173, 2007Impact of changing DOC concentrations
H. Laudon and I. Buffam
Title Page Abstract Introduction Conclusions References Tables Figures ◭ ◮ ◭ ◮ Back Close
Full Screen / Esc
Printer-friendly Version Interactive Discussion
EGU
al., 2004) and Finland (Vuorenmaa et al., 2006). Although no single causal mechanism for this wide spread increase in DOC has been identified, several plausible explanations have been proposed, including rising temperatures (Freeman et al., 2001), long-term variability in hydrological conditions (Tranvik and Jansson, 2002) and recovery from acidification (Evans et al., 2005).
5
Long and snow rich winters followed by large snowmelt driven hydrological episodes are defining features of northern boreal regions. A change in winter conditions is likely to affect the spring flood in terms of both runoff and solute export. It has been demon-strated that the DOC concentration in streams in northern Sweden is controlled by the soil solution chemistry of the riparian zone in combination with hillslope hydrol-10
ogy (Bishop et al., 2004). Thus, a change in the condition of the near stream zone or in water table level can be expected to change the DOC concentration in adjacent streams during snow melt. Monitoring and modeling studies from other northern re-gions also suggest that surface water DOC is sensitive to changes in climate, but that the characteristics of the change will vary depending on whether increased tempera-15
ture or change in precipitation is the dominant response to a warmer climate (Clair et al., 1999; Pastor et al., 2003; Schindler, 2001).
As DOC exudes a strong influence on the pH of many boreal surface waters, the objective of this study was to quantify how the acidity status of a mesoscale (67 km2) boreal stream network would be affected by a future change in DOC concentrations. 20
To do this, we modeled the effect of changing DOC concentration (ranging from 30% decrease to 50% increase) on pH at sites distributed throughout the stream network. These data were used to estimate the proportion of the total stream length that would become unsuitable for acid sensitive biota due to changes in DOC concentration, dur-ing both base flow conditions and the sprdur-ing flood.
HESSD
4, 3145–3173, 2007Impact of changing DOC concentrations
H. Laudon and I. Buffam
Title Page Abstract Introduction Conclusions References Tables Figures ◭ ◮ ◭ ◮ Back Close
Full Screen / Esc
Printer-friendly Version Interactive Discussion
EGU
2 Study site
The Krycklan Catchment Study is a multidisciplinary project in the upper 67 km2 of the Krycklan River catchment in northern Sweden (Fig. 1). The catchment includes the Vindeln Experimental Forests (64◦14′N, 19◦ 46′E), where climate data have been
monitored at the Svartberget Research Station since 1980. Annual mean air tem-5
perature is 1◦C with 600 mm annual mean precipitation, of which one-third falls as snow (Ottosson-L ¨ofvenius et al., 2003). Snowcover is present for 171 days on aver-age (1980–1999), and spring snowmelt is the dominant hydrological event of the year, exporting up to 50% of the annual stream flow during a 3–6 week period in April–May. Both stream water chemistry and discharge have been monitored regularly at one of 10
the small streams, Kallk ¨allsb ¨acken for the past 25 years (Bishop et al., 1990). Current acid deposition in the catchment is approximately 2 kg ha−1y−1 each of S-SO2−4 and N-NO−
3.
The Krycklan catchment ranges from 130 to 369 m above sea level. The bedrock consists of gneiss with an up to tens of meters of till overburden. Iron-podzol soils 15
are the most common soil type in the catchment, with organic rich soils in the ripar-ian near stream zones (Bishop et al., 1994). In the lower reaches of the catchment, larger streams have deeply incised channels carving through fine-grained floodplain sediments. Except for patches of sphagnum-dominated peat wetlands, making up 9% of the entire catchment area (and up to 50% in some small sub-catchments), the 20
catchment is forested primarily with mature Scots Pine (Pinus sylvestris) in dry upslope areas and Norway Spruce (Picea abies) in wetter, low-lying areas. Deciduous shrubs and trees, primarily birch (Betula spp.) but also alder (Alnus incana) and willow (Salix spp.), are found in the riparian forest along larger streams. Brown trout (Salmo trutta) and Brook trout (Salvelinus fontinalis) are common in many of the streams.
25
The Krycklan stream network (Fig. 1) from the 1:100 000 scale Swedish topography map (Lantm ¨ateriet, G ¨avle, Sweden) was used for calculations of stream length. Char-acteristics of the 60 subcatchments (Table 1) were based on a flow network (N=1654
HESSD
4, 3145–3173, 2007Impact of changing DOC concentrations
H. Laudon and I. Buffam
Title Page Abstract Introduction Conclusions References Tables Figures ◭ ◮ ◭ ◮ Back Close
Full Screen / Esc
Printer-friendly Version Interactive Discussion
EGU
cells total) for Krycklan developed within IDRISI v. 14 (Clark Labs, Worcester, MA, USE) using gridded elevation data (DEM) with a grid resolution of 50 m. For soil type characteristics a 1:100 000 digital soil coverage map (Geological Survey of Sweden, Uppsala, Sweden) and for land cover type a 1:12 500 scale digital land-cover map was used (Lantm ¨ateriet, G ¨avle, Sweden). From the soils map, the categories silt, glacioflu-5
vial sediment, sand and gravel were lumped to create a “sorted sediment” soil category. From the land cover map, the categories open and arable were lumped to create an “open or arable” land cover category.
3 Field and laboratory measurements
Stream water sampling consisted of grab samples, with multiple rinses of stream water, 10
collected in acid-washed 250 ml high-density polyethylene bottles. Additional samples for pCO2analysis were collected in N2-filled 60 mL glass vials sealed with bromobutyl rubber septa. For each pCO2 sample, a 15-mL aliquot of bubble-free stream water was injected into the glass vial, subsequently acidified to pH 2–3 with 1 drop of 30% ultrapure HCl (0.5% v/v) and stored cold until analysis.
15
Throughout the Krycklan stream network, 60 locations (Fig. 1) were sampled on two separate occasions, during winter base flow and close to peak discharge during spring flood. Samples were collected 5–10 m above and 25–50 m below junctions in the stream network. The junction samples were supplemented with samples from sites near the middle of particularly long (>2 km) stream reaches, and from 15 sites which 20
are part of a long-term monitoring program (Cory et al., 2006; Buffam et al., 2007). The winter base flow sampling occasion was collected from 17–28 February 2005. Discharge during this period was stable at 0.21–0.22 mm day−1 at the reference site,
typical for winter low-flow discharge with a 25-year average January–March flow of 0.18 mm day−1. The spring flood sampling occasion on 22 April 2004 was on the rising 25
limb of the snow melt hydrograph, concurrent with maximum DOC concentration and minimum pH (Buffam et al., 2007). Discharge at the reference site on that day was
HESSD
4, 3145–3173, 2007Impact of changing DOC concentrations
H. Laudon and I. Buffam
Title Page Abstract Introduction Conclusions References Tables Figures ◭ ◮ ◭ ◮ Back Close
Full Screen / Esc
Printer-friendly Version Interactive Discussion
EGU
3.0 mm day−1, while peak flood was reached two weeks later on 4 May with 7.1 mm
day−1 of flow during a rain-on-snow event. Peak spring flow in 2004 was within the typical range of 9.7±3.4 mm day−1 for the 25-year mean of the daily peak spring flow
at the reference site.
All water samples were kept dark and cool after collection until they were subsampled 5
for chemical analyses. pH at field condition was measured at laboratory temperature using a Ross 8102 low-conductivity combination electrode (ThermoOrion) in the labo-ratory immediately after collection. Water samples for DOC analysis were filtered using 0.45 µm MCE membrane filters (spring flood sampling) or left unfiltered (winter base flow sampling) and then frozen until analysis. No measurable difference in filtered and 10
unfiltered DOC concentration was detected in this study or in other inter-comparisons in Swedish surface waters (Ivarsson and Jansson, 1994; K ¨ohler et al., 1999). DOC was measured by combustion and analysis as CO2using a Shimadzu TOC-VCPH anal-yser after acidification and sparging to remove inorganic carbon. Instrument precision based on replicate injections averaged 2% and was always better than 5%.
15
Partial pressure of headspace CO2was analyzed by GC-FID (Perkin Elmer Autosys-tem Gas chromatograph) equipped with a methanizer operating at 375◦C. Separation was carried out on a Haysep N column using He (70 ml min−1) as carrier gas.
Dupli-cate injections of 0.5 mL were performed for all samples, with additional injections as necessary to attain a coefficient of variation of less than 5%. Stream water pCO2was
20
calculated from sample headspace pCO2using temperature-dependant equations for carbonate equilibria (Gelbrecht et al., 1998) and Henry’s Law (Weiss, 1974), together with measured stream water pH and temperature. For three of the spring flood samples the average pCO2of the remaining 57 was used as no analyses were available.
Samples for major cation analyses (K+, Mg2+, Na+, Ca2+) were filtered (0.45 µm 25
MCE membrane filters), preserved with ultrapure HNO−
3 (1 % v/v) and stored cool until
elemental analysis by ICP-OES (inductively-coupled plasma optical emission spec-troscopy) on a Varian Vista Ax Pro instrument. Samples for strong acid anions (SO2−4 and Cl−) were stored at 6◦C (2004 samples) or frozen (2005 samples) until analysis,
HESSD
4, 3145–3173, 2007Impact of changing DOC concentrations
H. Laudon and I. Buffam
Title Page Abstract Introduction Conclusions References Tables Figures ◭ ◮ ◭ ◮ Back Close
Full Screen / Esc
Printer-friendly Version Interactive Discussion
EGU
utilizing a Dionex DX-300 or DX-320 ion chromatograph system. The typical precision in anion and cation analyses based on measurements of certified standards was better than 2%. Analysis of NO−
3 by flow injection analysis on selected samples which had
been preserved by filtration and freezing until analysis (one-third of samples) revealed that concentrations were so low as to contribute insignificantly to the charge balance. 5
4 Calculations
Base cation (BC) concentration was calculated as the sum of K+, Mg2+, Na+and Ca2+ concentrations expressed as µeq L−1 of charge, with the assumption that these
ele-ments were present in their free ionized form. Strong acid anion (SAA) concentration was calculated as the sum of SO2−4 and Cl− expressed as µeq L−1 of charge. Acid 10
neutralizing capacity (ANC) was calculated from the charge balance definition as the difference between strong bases and strong (mineral) acid anions (e.g., Munson and Gherini, 1993), expressed here as molar quantities:
ANC=[K+] + 2[Mg2+] + [Na+] + 2[Ca2+]−[Cl−]−2[SO2−
4 ]=BC−SAA (1)
An alternative way to express ANC is as (Eq. 2); 15
ANC=[HCO−
3] + 2[CO 2−
3 ] + [RCOO−] + [OH−]−[H+]−n[Al
n+] (2)
where HCO−
3is calculated from pCO2 using Henry’s law and the carbonate equilibria
equations. CO2−3 was excluded from the calculation, as pH always was below 7.0 and hence CO2−3 does not affect the pH modeling. RCOO− denotes dissociated organic acid anions, including both the strong and weak acid anions, and is calculated from 20
DOC and pH using an organic acid model presented by Hruska et al. (2003). Aln+ denotes positively charged inorganic monomeric Al-species. As previous studies have shown that the inclusion of Aln+does not significantly improve the agreement between measured and model-predicted pH over the range of Al concentrations, DOC and pH
HESSD
4, 3145–3173, 2007Impact of changing DOC concentrations
H. Laudon and I. Buffam
Title Page Abstract Introduction Conclusions References Tables Figures ◭ ◮ ◭ ◮ Back Close
Full Screen / Esc
Printer-friendly Version Interactive Discussion
EGU
found in these stream water samples (K ¨ohler et al., 2000), Aln+was also excluded from the calculations. H+ can hence be calculated as (Eq. 3):
[H+]=[HCO−
3] + [RCOO−] + [OH−]−BC + SAA (3)
Because HCO−3, RCOO− and OH−are pH dependent Eq. (3) was solved iteratively. The effect of a change in DOC on stream water pH was calculated using Eqs. (4)– 5
(7), where the first step was to model the field proton concentration (H+modeled−field) using measured pCO2, DOC, BC and SAA concentrations (Eq. 4). The effect of a change in DOC concentration on the H+ (H+∆DOC) was then calculated, by adjusting DOC and hence RCOO− accordingly, then re-establishing charge balance while maintaining the
measured concentrations of pCO2, BC, and SAA (Eq. 5). After calculating ∆H+ as the 10
difference between modeled field H+ and the new H+ (H+∆DOC) after DOC adjustment (Eq. 6) the final pH value (pHnew) used in the stream sensitivity analyses was calculated using Eq. (7).
H+modeled−field=[HCO−
3] + [RCOO−] + [OH−]−BC + SAA (4)
H+∆DOC=[HCO−
3]∆DOC+ [RCOO−]∆DOC+ [OH−]∆DOC−BC + SAA (5)
15
∆H+=H+∆DOC−H+modeled−field (6)
pHnew=−log(H+measured+ ∆H+) (7)
This procedure was repeated for all 60 stream sites using both winter base flow and spring flood chemistry as the starting point for changes in DOC ranging from –30% to +50%. The reason for calculating ∆H+, which is than added to the measured 20
H+modeled−field concentration instead of using modeled pH with a DOC change directly, was to minimize the uncertainty in the organic acid modeling. By using the suite of equations (Eq. 4–Eq. 7) much of the uncertainty cancels out.
HESSD
4, 3145–3173, 2007Impact of changing DOC concentrations
H. Laudon and I. Buffam
Title Page Abstract Introduction Conclusions References Tables Figures ◭ ◮ ◭ ◮ Back Close
Full Screen / Esc
Printer-friendly Version Interactive Discussion
EGU
4.1 Stream length
The chemistry of each site was associated with its respective stream segment, both for purposes of illustrative mapping and to express the chemical status of the stream network in terms of proportion of stream length, rather than as proportion of sites. The length of each stream segment was determined by extending from a given site to 5
the halfway point (distance measured along stream) between adjacent sampling sites, both upstream and downstream. In the case of headwater sites, stream segments were extended halfway to the furthest upstream extent of the perennial stream, as indicated on the 1:100 000 scale map. Stream segments were not extended beyond major junctions. The length of the resulting stream segments varied between 68 m and 10
2874 m, with a mean length of 941 m. From this calculation, we estimated that our 60 sampling sites represented a total of 56 km of stream length, out of a total of 96 km in the whole network. For the remainder of the study, stream lengths are expressed as a percentage of total measured stream length, i.e., 56 km.
4.2 pH range of interest for acid sensitive species 15
Toxicity of water quality to fish and aquatic invertebrate populations in acidic systems has been linked to both low pH and elevated inorganic aluminium (Ali). Al toxicity (e.g., Gensemer and Playle, 1999) is frequently the primary cause of acid impacts on biota in low DOC aquatic systems. In aquatic systems such as those covering much of northern Sweden, high DOC concentrations bind aluminium reducing its toxic effects 20
(Laudon et al., 2005; Simonin et al., 1993; Witters et al., 1990). For example, Atlantic salmon are limited by pH with no clear physiological or toxicological response to Al con-centrations in high DOC streams of Nova Scotia, Canada (Lacroix, 1989). In a recent study conducted by the Swedish EPA reviewing all available national lake and stream water quality and biological data, pH rather than Ali was recommended as preferred 25
acidity index. This was because pH was found to correlate as well as or better than Ali to presence/absence of acid-sensitive fish species and stages (Holmgren and
Buf-HESSD
4, 3145–3173, 2007Impact of changing DOC concentrations
H. Laudon and I. Buffam
Title Page Abstract Introduction Conclusions References Tables Figures ◭ ◮ ◭ ◮ Back Close
Full Screen / Esc
Printer-friendly Version Interactive Discussion
EGU
fam, 2005), and better than Ali to the presence/absence of acid-sensitive invertebrate species (F ¨olster et al., 2007). Furthermore these studies suggested that the most crit-ical pH interval for many acid sensitive species generally is between pH 5.5 and 5.0. Based on these results we used two thresholds in this study; pH 5.5 and pH 5.0 to assess the potential change in biological status due to changes in DOC concentration 5
during the spring flood.
5 Results
The sampling conducted during both winter and spring represents a stream length of 56 km out of the total 96 km of stream length in the Krycklan catchment. The gaps in coverage were primarily due to under-sampling of the smallest first order tributaries. 10
This gave a distribution of sample sites with a median of catchment area 3.3 km2 as compared to 1.5 km2for the entire network of potential sampling sites (Table 1). This under-representation of the smallest streams can mainly be attributed to inaccessibility or frozen stream channels during winter sampling. Due to this tendency to under-represent the headwaters there was also an over-under-representation of areas with sorted 15
sediments and open or arable land, which occurred mostly along larger streams in the lower reaches of the catchment. Otherwise, the distributions of subcatchment charac-teristics (soil, land-cover parameters) for the 60 sites replicated well the distribution of potential sampling points from the entire stream network (Table 1). This is of impor-tance because much of the inter-stream variation in stream water chemistry is related 20
to spatial patterns in the terrestrial landscape, in particular the distribution of peat wet-lands (Buffam et al., 2007; Cory et al., 2006)
The average contemporary DOC concentration at base flow was 10.6 mg L−1
(Ta-ble 2) with a standard deviation (σ) of 6.3 mg L−1, and varied largely depending on the
distribution of wetlands (Buffam et al., 2007). During spring flood DOC concentration 25
generally increased to an average of 17.8 mg L−1(σ3.7 mg L−1). Average ANC at base
HESSD
4, 3145–3173, 2007Impact of changing DOC concentrations
H. Laudon and I. Buffam
Title Page Abstract Introduction Conclusions References Tables Figures ◭ ◮ ◭ ◮ Back Close
Full Screen / Esc
Printer-friendly Version Interactive Discussion
EGU
123 µeq L−1 (σ33 µeq L−1). Average pH during base flow and spring flood was 6.28 (σ
0.45 pH units) and 5.49 (σ 0.49 pH units), respectively. During base flow average pCO2 was 2804 ppm (σ2959 ppm) whereas average pCO2during spring flood was 3557 ppm (σ806 ppm). The pCO2 during spring flood averaged almost ten times overpressure compared to atmospheric CO2.
5
The pH model succeeded well in replicating field pH values from measured concen-trations of pCO2, BC, SAA and DOC. During spring flood the root mean square error (RMSE) between measured and modeled pH was 0.15 pH units. At base flow the RMSE was 0.25 pH units.
The modeled response in stream water pH due to changes in DOC concentration 10
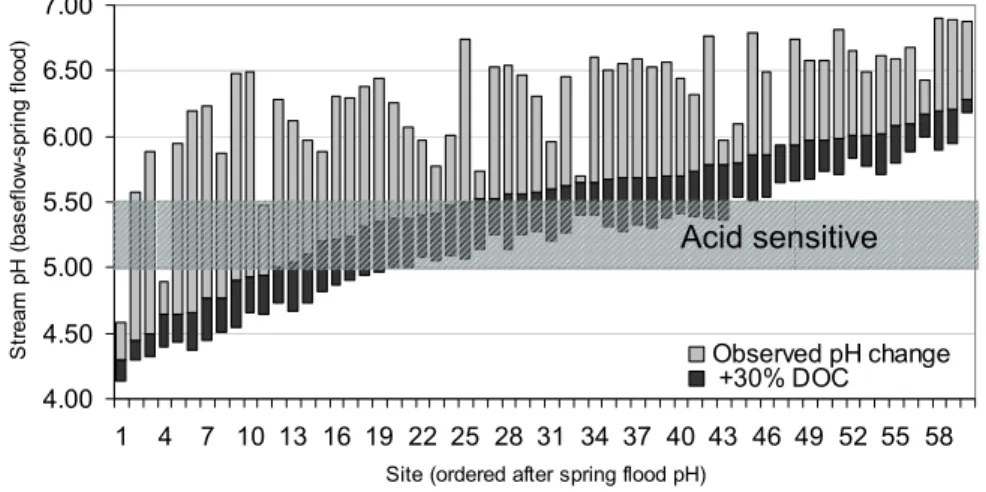
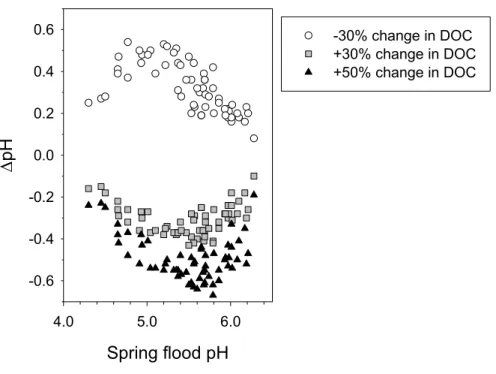
varied between base flow and spring flood. With a 30% increase in DOC concentration the average modeled pH decline during base flow was only 0.11 pH units. The modeled drop during spring flood was much larger, averaging 0.31 pH units (Fig. 2). During spring flood the largest pH effect was observed for samples with a pH between 5 and 6, which dropped on average 0.34 pH units with a 30% increase in DOC (Fig. 3). 15
Streams with a spring flood pH below 5.0 had an average pH decline of 0.25 pH units, whereas streams with a spring flood pH above 6.0 had an average pH decline of 0.22 pH units.
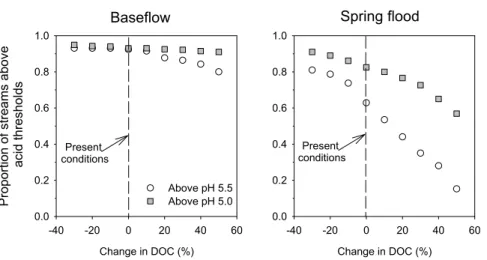
With the present DOC concentration, 92% of the measured stream length experi-enced a pH above 5.5 during base flow conditions while the stream length with a pH 20
above 5.0 was 93%. During spring flood the stream length with pH above 5.5 and 5.0 was 63% and 82% respectively with current DOC concentrations (Fig. 4a). With an increase in DOC concentration by 30% from present conditions (to an average of 13.8 mg L−1(σ 8.1 mg L−1) at base flow and 24.8 mg L−1(σ5.1 mg L−1) at spring flood)
the stream length with pH above 5.5 and 5.0 would decrease to 86% and 92% during 25
base flow and to 35% and 73% during spring flood (Fig. 4b).
Other DOC change scenarios also showed substantial impacts on the proportion of suitable stream length (Fig. 5). If the DOC concentration in all measured streams were decreased by 30% (to an average of 7.4 mg L−1 (σ 4.4 mg L−1) at base flow and
HESSD
4, 3145–3173, 2007Impact of changing DOC concentrations
H. Laudon and I. Buffam
Title Page Abstract Introduction Conclusions References Tables Figures ◭ ◮ ◭ ◮ Back Close
Full Screen / Esc
Printer-friendly Version Interactive Discussion
EGU
12 mg L−1 (σ 2.4 mg L−1) at spring flood) the length of streams above pH 5.5 and 5.0,
respectively would increase slightly to 93% and 95% during base flow and to 81% and 92% during spring flood. At the other extreme, if the DOC concentration increased by 50% from present conditions (to an average of 15.9 mg L−1 (σ 9.4 mg L−1) at base
flow and 26.7 mg L−1 (σ 5.5 mg L−1) at spring flood) the stream length in the Krycklan 5
catchment with a winter base flow pH above 5.5 and 5.0 would be 80% and 92% respectively (Fig. 5). A 50% increase in DOC concentration during spring flood would result in a stream length with pH above 5.5 of only 15%, while 57% would have a spring flood pH above 5.0.
6 Discussion
10
The proportion of stream length sensitive to changes in DOC was seasonally depen-dent. The two sampling occasions used in this study were selected to represent the extreme conditions experienced in Swedish boreal streams, both in terms of discharge and in acid-base chemistry. Late winter base flow in the region is generally well buffered with high ANC and relatively low DOC concentrations (Bishop et al., 2000; Laudon and 15
Bishop, 2002) and pH is therefore not strongly affected by moderate changes in DOC. The amount of stream length that was depressed into or below the acid sensitive range (pH 5.0–5.5) was therefore low independent of the change in DOC in our scenarios. In contrast, during the snow melt period streams in the region experience a large natural increase in DOC concentration which in combination with a dilution of ANC generally 20
results in the minimum annual pH levels (Laudon et al., 2001; Buffam et al., 2007). Based on our modeling results, an additional change in DOC concentration during this period would result in large changes in spring flood pH and hence in the stream length impacted by low pH (Fig. 4b, Fig. 5)
The magnitude of the change in pH during the spring flood was mainly related to 25
the field pH value with no correlation to measured DOC or ANC in the 60 streams. In general the largest pH change was found for streams with spring flood pH between 5
HESSD
4, 3145–3173, 2007Impact of changing DOC concentrations
H. Laudon and I. Buffam
Title Page Abstract Introduction Conclusions References Tables Figures ◭ ◮ ◭ ◮ Back Close
Full Screen / Esc
Printer-friendly Version Interactive Discussion
EGU
and 6 (Fig. 3), with declining effects both above pH 6 and below pH 5, which can be attributed to low buffering capacity of high DOC surface waters in the pH 5 to 6 range (K ¨ohler et al., 1999). This means that streams that already have a pH near ecological pH thresholds also are the systems that will likely experience the largest change in pH if the DOC concentration is affected in the future.
5
The prediction of how a DOC change will affect the stream length available to acid sensitive fish and invertebrate species was based on two simple thresholds in pH: pH 5.5 and pH 5.0. Although these toxicity thresholds were based on a recent study con-ducted by the Swedish EPA where a substantial body of national water quality and biological data were reviewed (Holmgren and Buffam, 2005; F ¨olster et al., 2007), this 10
is admittedly an over-simplification of the ecological response to episodic pH changes. Sensitivity to acidity not only varies between species but also depends on the different development stages of the organisms (McCormick and Leino, 1999; Sayer et al., 1993). Another consequence of a change in climate is therefore on the timing of snowmelt that could result in changes in synchronization between high runoff (and hence low pH) and 15
vulnerable life-stages of fish. As the winter/spring period is an important bottleneck for many stream-dwelling fish-species, with decreasing amount of prey and increased pre-dation (Elliott, 1994), any major change in the environmental conditions during these periods could contribute to first-year recruitment failure in northern waters (McCormick and Leino, 1999). However, the purpose of this study was not to develop new ecological 20
thresholds, but to demonstrate the potential impact of changes in DOC concentration using a simple approach. It is hoped that future studies will expand and improve the complexity of the biological thresholds that can be used for this type of analysis.
A 50% increase in DOC concentration used as an upper limit in this study is within what has been recorded in surface water monitoring in Europe during the last decades. 25
In a recent study of 22 UK upland surface waters the DOC concentration increased on average by 91% the last 15 years (Evans et al., 2005). Similar results have been re-ported in another large study in the UK involving 198 sites, where 77% of the sites increased in concentration with an average increase of 0.17 mg DOC L−1 yr−1
mea-HESSD
4, 3145–3173, 2007Impact of changing DOC concentrations
H. Laudon and I. Buffam
Title Page Abstract Introduction Conclusions References Tables Figures ◭ ◮ ◭ ◮ Back Close
Full Screen / Esc
Printer-friendly Version Interactive Discussion
EGU
sured over an 8 to 42 year time span (Worrall et al., 2004). In Finland a corresponding increase in DOC for 13 lakes was found to average 0.11 mg DOC L−1 yr−1, where the
largest increase of 0.22 mg DOC L−1yr−1 was found in the lake with the highest initial
DOC concentration (Vuorenmaa et al., 2006).
The concentration of organic carbon in surface waters in high latitude regions is 5
expected to be particularly susceptible to changes in climate (Finlay et al., 2006). At the hillslope scale the concentration of DOC in streams is controlled by soil solution chemistry in the near stream zone in combination with hillslope hydrology (Bishop et al., 1994). As the soil DOC increases exponentially towards the soil surface, increased runoff resulting in more superficial flow pathways in the soil will therefore likely increase 10
the concentration of DOC during the spring flood. A more prolonged snow melt period, which is another plausible consequence of warmer winters, may have the opposite effect and decrease the runoff peak and hence lower future DOC concentrations during spring flood.
As the stream DOC concentration is strongly regulated by the riparian zone (Bishop 15
et al., 2004), changes in physical conditions of the near stream soil would also likely alter the available DOC that can be exported to the adjacent stream during the spring flood. One such effect that is driven by changes in the winter climate is an alteration of the spatial and temporal distribution of soil frost (Mellander et al., 2005). A later de-velopment of the snow pack, which is a likely effect of a warmer climate, may result in 20
an increased number of freeze-thaw events or even colder soils in some situations be-cause of longer periods during winter when the soil is not insulated by snow (Stieglitz et al., 2003). How a change in the soil frost distribution will affect the DOC concentrations during the spring flood is however presently not well understood.
One important assumption made in this analysis is that the acid-base character of 25
DOC is constant over time and space. This has been confirmed by several studies in the region (K ¨ohler et al. 1999; Hruska et al., 2001). The reasonable reproduction of field pH from measurements of ANC, pCO2 and DOC in this study, with a RMSE of 0.25 pH units during base flow and 0.15 pH units during spring flood further confirms
HESSD
4, 3145–3173, 2007Impact of changing DOC concentrations
H. Laudon and I. Buffam
Title Page Abstract Introduction Conclusions References Tables Figures ◭ ◮ ◭ ◮ Back Close
Full Screen / Esc
Printer-friendly Version Interactive Discussion
EGU
a relatively consistent DOC character in the region. Furthermore, the potential for biased results due to systematic errors in the acid-base character was minimized by calculating the effect on pH as the difference in H+ (Eq. 6) between modeled field H+ and H+ after DOC adjustment, which should cancel out major systematic errors.
Another important assumption made in this study is that a change in DOC could oc-5
cur with no accompanying change in ANC. From a theoretical perspective, it is likely that an increase in DOC, and therefore in the concentration of RCOO-, would result in a proportional increase in BC and hence in ANC (Kahl et al., 1992). If the change in DOC concentration is caused by an alteration in hydrology of the riparian zone, other spring flood studies in the area suggest that this co-transport should be minimal. Laudon et 10
al. (2001) compared the dilution of BC with the change in the more conservative hydro-logical tracer silica (Si) in a number of streams in northern Sweden, including several of the streams in this study. In a majority of cases a similar or even larger decline during the spring flood was observed in BC compared to Si, despite an up to 200% increase in DOC. Bishop et al. (2004) have also provided a physical explanation for the lack of 15
proportionality between DOC and BC change; whereas the DOC concentration in the near stream zone increases exponentially towards the soil surface, the BC concentra-tion declines in the same direcconcentra-tion. An increased ground water table will hence activate flow paths of higher DOC but lower BC concentrations during episodes, which could further exacerbate the negative influence on pH. A negative correlation between DOC 20
and BC in this study during both base flow (p=0.001) and spring flood (p=0.005) also suggests that despite a theoretical basis for a co-transport large variability in DOC can occur during the spring flood without a corresponding change in ANC.
If, on the other hand, an increase in DOC is caused by a declining acid deposition (Evans et al., 2005), a recovery of ANC could be expected, which would remediate the 25
negative influence on pH. Previous analyses of spring flood episodes in northern Swe-den have however demonstrated that the pulse of acidity generating pH decline over two pH units in many streams, is now derived primarily from an increase in naturally occurring organic acids in conjunction with the dilution of ANC (Bishop et al., 2000;
HESSD
4, 3145–3173, 2007Impact of changing DOC concentrations
H. Laudon and I. Buffam
Title Page Abstract Introduction Conclusions References Tables Figures ◭ ◮ ◭ ◮ Back Close
Full Screen / Esc
Printer-friendly Version Interactive Discussion
EGU
Laudon et al., 2001). As anthropogenic deposition at present only contributes between 0.1 and 0.3 pH units to the spring flood pH decline, little further recovery can be ex-pected in the future (Laudon and Bishop, 2002; Laudon and Hemond, 2002). While the acid-emissions related acidification pressure has been declining, climate change is expected to be an increasing threat to the region’s aquatic resources.
5
A third uncertainty in predicting sensitivity to future changes is how pCO2would be affected. The pCO2 has a large influence on pH during both base flow and spring flood. For example if the pCO2were in equilibrium with the atmosphere, instead of the almost 10 times mean over-pressure measured, the pH during the spring flood would on average for the 60 stream sites be 0.4 pH units higher. Because of a significant pos-10
itive correlation (p=0.004) between DOC and pCO2 suggesting similar source areas,
an increase in DOC could occur together with increased pCO2during the spring flood. This would result in a further depression of pH.
The premise of the modeling exercise in this study was to demonstrate the impact of changes in DOC concentration alone on pH. As variation in DOC concentration is 15
not expected to occur in isolation but instead to be accompanied by variation in other solutes, the causal mechanism behind changes in DOC has considerable implications for the likely impact on pH. If changes in DOC are caused by shifting water tables resulting from changes in temperature or the temporal distribution of precipitation and temperature, for instance, resulting changes in pH are likely to be even more 20
extreme than those predicted in this study. That is because soil flow pathways which favor high DOC concentrations tend to be near-surface and thus low in BC relative to deeper flow pathways. Increases in DOC are thus likely to be accompanied by decreases in BC, further exacerbating changes in pH, and vice versa for decreases in DOC. On the other hand, if current or future changes in DOC are the result of 25
recovery from soil acidification, then the increasing organic acid concentrations will be accompanied by decreases in strong acid anions (e.g. SO2−4 ) and/or increases in BC. This will result in little or no change in pH for a given change in DOC. It is plausible that both mechanisms could be operating in the same systems simultaneously, lending
HESSD
4, 3145–3173, 2007Impact of changing DOC concentrations
H. Laudon and I. Buffam
Title Page Abstract Introduction Conclusions References Tables Figures ◭ ◮ ◭ ◮ Back Close
Full Screen / Esc
Printer-friendly Version Interactive Discussion
EGU
uncertainty to simple prediction of the impact of changing DOC on pH. Regardless, in poorly-buffered high-DOC systems DOC plays an important role in controlling pH, and thus consideration of this factor is important especially given the current trends in DOC concentration across many regions.
5
Edited by: P. Dillon and R. F. Wright
References
Barnett, T. P., Adam, J. C., and Lettenmaier, D. P.: Potential impacts of a warming climate on water availability in snow-dominated regions, Nature, 438, 303–309, 2005.
Bishop, K., Pettersson, C., Allard, B., and Lee, Y. H.: Identification of the Riparian Sources of 10
Aquatic Dissolved Organic-Carbon, Environ. Int., 20, 11–19, 1994.
Bishop, K., Seibert, J., Koher, S., and Laudon, H.: Resolving the Double Paradox of rapidly mobilized old water with highly variable responses in runoff chemistry, Hydrol. Processes, 18, 185–189, 2004.
Bishop, K. H., Grip, H., and O’Neill, A.: The origin of acid runoff in a hillslope during storm 15
events, J. Hydrol., 116, 35–61, 1990.
Bishop, K. H., Laudon, H., and K ¨ohler, S.: Separating the natural and anthropogenic compo-nents of spring flood pH decline: A method for areas that are not chronically acidified, Water Resour. Res., 30, 1873–1889, 2000.
Buffam, I., Laudon, H., Temnerud, J., M ¨orth, C. M., and Bishop, K.: Landscape-scale variability 20
of acidity and dissolved organic carbon during spring flood in a boreal stream network, J. Geophys. Res.-Biogeosci., 112, G01022, doi:10.1029/2006JG000218, 2007.
Clair, T. A., Ehrman, J. M., and Higuchi, K.: Changes in freshwater carbon exports from Cana-dian terrestrial basins to lakes and estuaries under a 2XCO2atmospheric scenario, Global
Biogeochem. Cycles, 13, 1091–1097, 1999. 25
Cory, N., Buffam, I., Laudon, H., Kohler, S., and Bishop, K.: Landscape control of stream water aluminum in a boreal catchment during spring flood, Environ. Sci. Technol., 40, 3494–3500, 2006.
Elliott, J. M.: Quantitative Ecology and the Brown Trout. Oxford University press, Walton Street, Oxford OX2 6DP, pp 286, 1994.
HESSD
4, 3145–3173, 2007Impact of changing DOC concentrations
H. Laudon and I. Buffam
Title Page Abstract Introduction Conclusions References Tables Figures ◭ ◮ ◭ ◮ Back Close
Full Screen / Esc
Printer-friendly Version Interactive Discussion
EGU
Evans, C. D., Monteith, D. T., and Cooper, D. M.: Long-term increases in surface water dis-solved organic carbon: Observations, possible causes and environmental impacts, Environ. Pollut., 137, 55–71, 2005.
Finlay, J., Neff, J., Zimov, S., Davydova, A., and Davydov, S.: Snowmelt dominance of dissolved organic carbon in high-latitude watersheds: Implications for characterization and flux of river 5
DOC, Geophys. Res. Lett., 33(10), 10401, 10.1029/2006GL025754, 2006.
F ¨olster, J., Andr ´en, C., Bishop, K., Buffam, I., Cory, N., Goedkoop, W., Holmgren, K., Johnson, R., Laudon, H., and Wilander, A.: New Environmental Quality Criteria for acidification in lakes in Sweden – an application of studies on the relationship between biota and water chemistry, Water, Air Soil Pollut.: Focus, 7, 331–338, 2007.
10
Freeman, C., Evans, C. D., Monteith, D. T., Reynolds, B., and Fenner, N.: Export of organic carbon from peat soils, Nature, 412, 785–785, 2001.
Gelbrecht, J., Fait, M., Dittrich, M., and Steinberg, C.: Use of GC and equilibrium calculations of CO2 saturation index to indicate whether freshwater bodies in north-eastern Germany are net sources or sinks for atmospheric CO2, Fresenius Journal of Analytical Chemistry, 361, 15
47–53, 1998.
Gensemer, R. W. and Playle, R. C.: The bioavailability and toxicity of aluminum in aquatic envi-ronments, Critical Reviews in Environmental Science and Technology, 29, 315–450, 1999. Groffman, P. M., Driscoll, C. T., Fahey, T. J., Hardy, J. P., Fitzhugh, R. D., and Tierney, G. L.:
Colder soils in a warmer world: A snow manipulation study in a northern hardwood forest 20
ecosystem, Biogeochemistry, 56, 135–150, 2001.
Holmgren, K. and Buffam, I.: Critical values of different acidity indices – as shown by fish communities in Swedish lakes, Verh. Internat. Verein. Limnol., 29, 654–660, 2005.
Hongve, D., Riise, G., and Kristiansen, J. F.: Increased colour and organic acid concentrations in Norwegian forest lakes and drinking water – a result of increased precipitation?, Aquatic 25
Sciences, 66, 231–238, 2004.
Hruska, J., Kohler, S., Laudon, H., and Bishop, K.: Is a universal model of organic acidity possible: Comparison of the acid/base properties of dissolved organic carbon in the boreal and temperate zones, Environ. Sci. Technol., 37, 1726–1730, 2003.
Hruska, J., Laudon, H., Johnson, C. E., Kohler, S., and Bishop, K.: Acid/base character of 30
organic acids in a boreal stream during snowmelt, Water Resour. Res., 37, 1043–1056, 2001.
dis-HESSD
4, 3145–3173, 2007Impact of changing DOC concentrations
H. Laudon and I. Buffam
Title Page Abstract Introduction Conclusions References Tables Figures ◭ ◮ ◭ ◮ Back Close
Full Screen / Esc
Printer-friendly Version Interactive Discussion
EGU
solved Organic-matter in a highly colored stream in the coastal zone of northern Sweden, Archiv Fur Hydrobiologie Issn, 132, 45–55, 1994.
Jansson, M., Bergstrom, A. K., Blomqvist, P., and Drakare, S.: Allochthonous organic carbon and phytoplankton/bacterioplankton production relationships in lakes, Ecology, 81, 3250– 3255, 2000.
5
Kahl, J. S., Norton, S. A., Haines, T. A., Rochette, E. A., Heath, R. H., and Nodvin, S. C.: Mechanisms of episodic acidification in low-order streams in Maine, USA, Environ. Pollut., 78, 37–44, 1992.
Kjellstr ¨om, E.: Recent and future signatures of climate change in Europe, Ambio, 33, 193–198, 2004.
10
K ¨ohler, S., Hruska, J., and Bishop, K.: Influence of organic acid site density on pH modeling of Swedish lakes, Can. J. Fish. Aquatic Sci., 56, 1461–1470, 1999.
K ¨ohler, S., Laudon, H., Wilander, A., and Bishop, K.: Estimating organic acid dissociation in natural surface waters using total alkalinity and TOC, Water Res., 34, 1425–1434, 2000. Lacroix, G. L.: Ecological and Physiological Responses of Atlantic Salmon in Acidic Organic 15
Rivers of Nova Scotia, Canada, Water Air Soil Pollut., 46, 375–386, 1989.
Laudon, H. and Bishop, K. H.: The rapid and extensive recovery from episodic acidification in northern Sweden due to declines in SO42− deposition, Geophys. Res. Lett., 29(12), 1594, doi:10.1029/2001GL014211, 2002.
Laudon, H. and Hemond, H. F.: Recovery of streams from episodic acidification in northern 20
Sweden, Environ. Sci. Technol., 36, 921–928, 2002.
Laudon, H., Poleo, A. B. S., Vollestad, L. A., and Bishop, K.: Survival of brown trout during spring flood in DOC-rich streams in northern Sweden: the effect of present acid deposition and modeled pre-industrial water quality, Environ. Pollut., 135, 121–130, 2005.
Laudon, H., Westling, O., and Bishop, K.: Cause of pH decline in stream water during spring 25
melt runoff in northern Sweden, Can. J. Fish. Aquatic Sci., 57, 1888–1900, 2000.
Laudon, H., Westling, O., L ¨ofgren, S., and Bishop, K.: Modeling preindustrial ANC and pH during the spring flood in northern Sweden, Biogeochemistry, 54, 171–195, 2001.
McCormick, J. H. and Leino, R. L.: Factors contributing to first-year recruitment failure of fishes in acidified waters with some implications for environmental research, Transactions of the 30
American Fisheries Society, 128, 265–277, 1999.
Mellander, P. E., Laudon, H., and Bishop, K.: Modeling variability of snow depths and soil temperatures in Scots pine stands, Agric. Forest Meteorol., 133, 109–118, 2005.
HESSD
4, 3145–3173, 2007Impact of changing DOC concentrations
H. Laudon and I. Buffam
Title Page Abstract Introduction Conclusions References Tables Figures ◭ ◮ ◭ ◮ Back Close
Full Screen / Esc
Printer-friendly Version Interactive Discussion
EGU
Munson, R. K. and Gherini, S. A.: Influence of Organic-Acids on the pH and Acid-Neutralizing Capacity of Adirondack Lakes, Water Resour. Res., 29, 891–899, 1993.
Ottosson-L ¨ofvenius, M. O., Kluge, M., and Lundmark, T.: Snow and soil frost depth in two types of shelterwood and a clear-cut area, Scandinavian J. Forest Res., 18, 54–63, 2003.
Pastor, J., Solin, J., Bridgham, S. D., Updegraff, K., Harth, C., Weishampel, P., and Dewey, B.: 5
Global warming and the export of dissolved organic carbon from boreal peatlands, Oikos, 100, 380–386, 2003.
Rember, R. D. and Trefry, J. H.: Increased concentrations of dissolved trace metals and organic carbon during snowmelt in rivers of the Alaskan Arctic, Geochimica et Cosmochimica Acta, 68, 477–489, 2004.
10
Sayer, M. D. J., Reader, J. P., and Dalziel, T. R. K.: Fresh-Water Acidification – Effects on the Early-Life Stages of Fish, Rev. Fish Biol. Fisheries, 3, 95–132, 1993.
Schindler, D. W.: The cumulative effects of climate warming and other human stresses on Canadian freshwaters in the new millennium, Can. J. Fish. Aquatic Sci., 58, 18–29, 2001. Simonin, H. A., Kretser, W. A., Bath, D. W., Olson, M., and Gallagher, J.: In-situ bioassays of 15
brook trout (Salvelinus-Fontinalis) and blacknose dace (Rhinichthys-Atratulus) in Adirondack streams affected by episodic acidification, Can. J. Fish. Aquatic Sci., 50, 902–912, 1993. Stieglitz, M., Dery, S. J., Romanovsky, V. E., and Osterkamp, T. E.: The role of
snow cover in the warming of arctic permafrost, Geophys. Res. Lett., 30(13), 1721, doi:10.1029/2003GL017337, 2003.
20
Tranvik, L. J. and Jansson, M.: Climate change – Terrestrial export of organic carbon, Nature, 415, 861–862, 2002.
Ven ¨al ¨ainen, A., Tuomenvirta, H., Heikinheimo, M., Kellomaki, S., Peltola, H., Strandman, H., and Vaisanen, H.: Impact of climate change on soil frost under snow cover in a forested landscape, Clim. Res., 17, 63–72, 2001.
25
Vuorenmaa, J., Forsius, M., and Mannio, J.: Increasing trends of total organic carbon concen-trations in small forest lakes in Finland from 1987 to 2003, Sci. Total Environ., 365, 47–65, 2006.
Weiss, R. F.: Carbon dioxide in water and seawater: the solubility of a non-ideal gas, Mar. Chem., 2, 203–215, 1974.
30
Witters, H. E., Van Puymbroeck, S., Vangenechten, J. H. D., and Vanderborght, O. L. J.: The effect of humic substances on the toxicity of aluminium to adult rainbow trout, Oncorhynchus mykiss (Walbaum), J. Fish Biol., 37, 45–53, 1990.
HESSD
4, 3145–3173, 2007Impact of changing DOC concentrations
H. Laudon and I. Buffam
Title Page Abstract Introduction Conclusions References Tables Figures ◭ ◮ ◭ ◮ Back Close
Full Screen / Esc
Printer-friendly Version Interactive Discussion
EGU
Worrall, F., Harriman, R., Evans, C. D., Watts, C. D., Adamson, J., Neal, C., Tipping, E., Burt, T., Grieve, I., Monteith, D., Naden, P. S., Nisbet, T., Reynolds, B., and Stevens, P.: Trends in dissolved organic carbon in UK rivers and lakes, Biogeochemistry, 70, 369–402, 2004.
HESSD
4, 3145–3173, 2007Impact of changing DOC concentrations
H. Laudon and I. Buffam
Title Page Abstract Introduction Conclusions References Tables Figures ◭ ◮ ◭ ◮ Back Close
Full Screen / Esc
Printer-friendly Version Interactive Discussion
EGU
Table 1. Median (and 5th–95th percentiles in parentheses) catchment characteristics for the
stream sites used in the study (N=60 sites) and for all stream cells in the Krycklan catchment (N=1654).
Variable Sampling sites (N=60) All stream cells (N=1654) SOILS (%) Till 62.5 (45.4–95.9) 62.9 (42.9–97.4) Peat 13.5 (0.0–29.8) 12.6 (0.0–32.2) Sediment (sorted) 7.4 (0.0–35.9) 1.4 (0.0–37.0) Thin soils 8.7 (2.6–27.1) 7.7 (0.0–26.6) Exposed rock 0.9 (0.0–4.6) 0.4 (0.0–4.4) LAND COVER (%) Forest 82.3 (58.1–96.6) 83.3 (61.4–100.0) Wetland 12.0 (2.5–28.8) 11.1 (0.0–30.3) Clearcut 2.1 (0.0–10.0) 1.1 (0.0–14.3) Open or arable 0.6 (0.0–3.7) 0.0 (0.0–4.1) Lake 0.1 (0.0–4.1) 0.0 (0.0–4.2) OTHER
Mean catchment slope (%) 9 (6–14) 9 (6–14) Mean catchment altitude (m) 272 (224–295) 277 (215–312) Site altitude (m) 198 (133–263) 218 (146–288) Catchment area (km2) 3.3 (0.2–41.9) 1.5 (0.1–30.5)
HESSD
4, 3145–3173, 2007Impact of changing DOC concentrations
H. Laudon and I. Buffam
Title Page Abstract Introduction Conclusions References Tables Figures ◭ ◮ ◭ ◮ Back Close
Full Screen / Esc
Printer-friendly Version Interactive Discussion
EGU
Table 2. Mean chemistry (standard deviation in parentheses) for the 60 stream sites used
in the study during winter base flow and spring flood. DOC=dissolved organic carbon; RCOO−
=dissociated organic acids (modeled, including both strong and weak component); BC=base cations; SAA=strong acid anions; ANC=acid neutralizing capacity (BC-SAA).
Variable Winter Base Flow Spring Flood pH 6.28 (0.45) 5.49 (0.49) DOC (mg L−1) 10.6 (6.3) 17.8 (3.7) RCOO− (µeq L−1) 83 (41) 118 (15) BC (µeq L−1) 373 (227) 229 (54) SAA (µeq L−1) 148 (117) 106 (33) ANC (µeq L−1) 225 (124) 123 (33) Ca2+ (µeq L−1) 163 (127) 103 (31) K+ (µeq L−1) 20 (15) 20 (11) Mg2+ (µeq L−1) 90 (58) 56 (12) Na+ (µeq L−1) 100 (31) 49 (12) Cl− (µeq L−1) 33 (11) 25 (6) SO2−4 (µeq L−1) 115 (110) 81 (31) HCO− 3 (µeq L −1) 97 (65) 31 (27) pCO2 ppm 2804 (2959) 3557 (806)
HESSD
4, 3145–3173, 2007Impact of changing DOC concentrations
H. Laudon and I. Buffam
Title Page Abstract Introduction Conclusions References Tables Figures ◭ ◮ ◭ ◮ Back Close
Full Screen / Esc
Printer-friendly Version Interactive Discussion
EGU
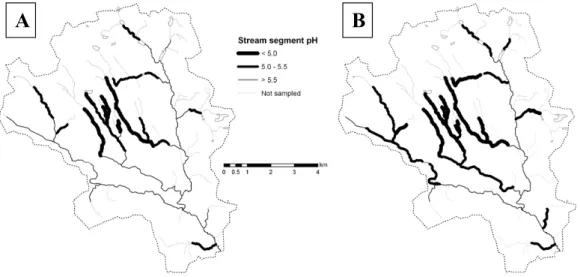
Fig. 1. (A)Location of the Krycklan catchment in Sweden and (B) location of 60 stream
sam-pling sites within the catchment. Map source Lantmteriverket (G ¨avle, Sweden), further details described in text.
HESSD
4, 3145–3173, 2007Impact of changing DOC concentrations
H. Laudon and I. Buffam
Title Page Abstract Introduction Conclusions References Tables Figures ◭ ◮ ◭ ◮ Back Close
Full Screen / Esc
Printer-friendly Version Interactive Discussion EGU 4.00 4.50 5.00 5.50 6.00 6.50 7.00 1 4 7 10 13 16 19 22 25 28 31 34 37 40 43 46 49 52 55 58
Site (ordered after spring flood pH)
S tr e a m p H ( b a s e fl o w -s p ri n g f lo o d ) Observed pH change +30% DOC Acid sensitive
Fig. 2. The decline in pH at 60 stream sites, measured from base flow to spring flood (gray)
and with the further modeled decline due to 30% increase in spring flood DOC (black). The streams are sorted by spring flood pH.
HESSD
4, 3145–3173, 2007Impact of changing DOC concentrations
H. Laudon and I. Buffam
Title Page Abstract Introduction Conclusions References Tables Figures ◭ ◮ ◭ ◮ Back Close
Full Screen / Esc
Printer-friendly Version Interactive Discussion EGU Spring flood pH 4.0 5.0 6.0 ΔpH -0.6 -0.4 -0.2 0.0 0.2 0.4 0.6 -30% change in DOC +30% change in DOC +50% change in DOC
HESSD
4, 3145–3173, 2007Impact of changing DOC concentrations
H. Laudon and I. Buffam
Title Page Abstract Introduction Conclusions References Tables Figures ◭ ◮ ◭ ◮ Back Close
Full Screen / Esc
Printer-friendly Version Interactive Discussion
EGU
B
A
Fig. 4. The proportion of stream length affected by low pH at spring flood (A) during present
HESSD
4, 3145–3173, 2007Impact of changing DOC concentrations
H. Laudon and I. Buffam
Title Page Abstract Introduction Conclusions References Tables Figures ◭ ◮ ◭ ◮ Back Close
Full Screen / Esc
Printer-friendly Version Interactive Discussion EGU Change in DOC (%) -40 -20 0 20 40 60 Pr o p o rt io n o f st re a m s a b o v e a c id t h re s h o ld s 0.0 0.2 0.4 0.6 0.8 1.0 Above pH 5.5 Above pH 5.0 Change in DOC (%) -40 -20 0 20 40 60 0.0 0.2 0.4 0.6 0.8 1.0 Present conditions Present conditions
Baseflow Spring flood
640 641
Fig. 5. The effects on stream length maintaining pH above acid thresholds during base flow