HAL Id: hal-00295285
https://hal.archives-ouvertes.fr/hal-00295285
Submitted on 23 Jun 2003
HAL is a multi-disciplinary open access
archive for the deposit and dissemination of
sci-entific research documents, whether they are
pub-lished or not. The documents may come from
teaching and research institutions in France or
abroad, or from public or private research centers.
L’archive ouverte pluridisciplinaire HAL, est
destinée au dépôt et à la diffusion de documents
scientifiques de niveau recherche, publiés ou non,
émanant des établissements d’enseignement et de
recherche français ou étrangers, des laboratoires
publics ou privés.
MINOS: Comparison of airborne in-situ measurements
with 3D-model results
R. Kormann, H. Fischer, M. de Reus, M. Lawrence, Ch. Brühl, R. von
Kuhlmann, R. Holzinger, J. Williams, J. Lelieveld, C. Warneke, et al.
To cite this version:
R. Kormann, H. Fischer, M. de Reus, M. Lawrence, Ch. Brühl, et al.. Formaldehyde over the
eastern Mediterranean during MINOS: Comparison of airborne in-situ measurements with 3D-model
results. Atmospheric Chemistry and Physics, European Geosciences Union, 2003, 3 (3), pp.851-861.
�hal-00295285�
www.atmos-chem-phys.org/acp/3/851/
Chemistry
and Physics
Formaldehyde over the eastern Mediterranean during MINOS:
Comparison of airborne in-situ measurements with 3D-model
results
R. Kormann1, H. Fischer1, M. de Reus1, M. Lawrence1, Ch. Br ¨uhl1, R. von Kuhlmann1, R. Holzinger1, J. Williams1, J. Lelieveld1, C. Warneke2, J. de Gouw2, J. Heland3, H. Ziereis3, and H. Schlager3
1Max-Planck-Institut f¨ur Chemie, J.J. Becher-Weg 22, 55128 Mainz, Germany 2NOAA Aeronomy Laboratory, 325 Broadway, Boulder, CO, USA
3Institut f¨ur Physik der Atmosph¨are, DLR, Oberpfaffenhofen, 82230 Wessling, Germany
Received: 7 February 2003 – Published in Atmos. Chem. Phys. Discuss.: 10 March 2003 Revised: 16 June 2003 – Accepted: 18 June 2003 – Published: 23 June 2003
Abstract. Formaldehyde (HCHO) is an important
intermedi-ate product in the photochemical degradation of methane and non-methane volatile organic compounds. In August 2001, airborne formaldehyde measurements based on the Hantzsch reaction technique were performed during the Mediterranean INtensive Oxidant Study, MINOS. The detection limit of the instrument was 42 pptv (1σ ) at a time resolution of 180 s (10–90%). The overall uncertainty of the HCHO measure-ments was 30% at a mixing ratio of 300 pptv. In the ma-rine boundary layer over the eastern Mediterranean Sea aver-age HCHO concentrations were of the order of 1500 pptv, in reasonable agreement with results from a three-dimensional global chemical transport model of the lower atmosphere in-cluding non-methane volatile organic compound (NMVOC) chemistry. Above the boundary layer HCHO mixing ratios decreased with increasing altitude to a minimum level of 250 pptv at about 7 km. At higher altitudes (above 7 km) HCHO levels showed a strong dependency on the airmass origin. In airmasses from the North Atlantic/North Ameri-can area HCHO levels were of the order of 300 pptv, a factor of 6 higher than values predicted by the model. Even higher HCHO levels, increasing to values of the order of 600 pptv at 11 km altitude, were observed in easterlies transporting air affected by the Indian monsoon outflow towards the Mediter-ranean basin. Only a small part (∼30 pptv) of the large dis-crepancy between the model results and the measurements of HCHO in the free troposphere could be explained by a strong underestimation of the upper tropospheric acetone concen-tration by up to a factor of ten by the 3D-model. There-fore, the measurement-model difference in the upper tropo-sphere remains unresolved, while the observed dependency of HCHO on airmass origin might indicate that unknown, relatively long-lived NMVOCs – or their reaction
intermedi-Correspondence to: H. Fischer ([email protected])
ates – associated with biomass burning are at least partially responsible for the observed discrepancies.
1 Introduction
Formaldehyde (HCHO) is a major intermediate reaction product in atmospheric photochemistry. Additional sources are direct emissions from incomplete fossil fuel combustion (de Serves, 1994; Sigsby et al., 1987), biomass burning (Lee et al., 1997), industrial processing, and emissions from veg-etation (Carlier et al, 1986, and references therein). It is pro-duced during the photochemical degradation of methane and non-methane volatile organic compounds (NMVOC), with methane chemistry being a dominant source of HCHO in the free troposphere and the remote marine boundary layer (Lowe and Schmidt, 1983). Reactions of HCHO with the hydroxyl radical (OH) and two wavelength dependent pho-tolytic channels (yielding H2+ CO at λ greater than 325 nm
or H + HCO at λ less than 325 nm) are the main loss pro-cesses. Losses through dry deposition or rain may also be significant. Typically the photochemical lifetime of HCHO near the surface in the sunlit atmosphere is of the order of 4 h (Lowe and Schmidt, 1983) decreasing with increasing al-titude due to enhanced photolysis rate. Since HCHO pro-duction and destruction depend on OH radical concentra-tions and the solar photon flux, its concentration can be used as an indicator of photochemical activity and of the role of NMVOC in the background atmosphere (Lowe and Schmidt, 1983). In particular in the upper troposphere, HCHO mea-surements can be used to assess the role of oxygenated hy-drocarbons on the HOxbudget (Crawford et al., 1999).
In the remote marine boundary layer levels of HCHO ex-ceed 100–200 pptv (Zafirou et al., 1980; Lowe and Schmidt,
1983; Arlander et al., 1990; Heikes, 1992; Harris et al., 1992; Zhou et al., 1996; Mackay et al., 1996; Jacob et al., 1996; Ayers et al., 1997; Jaegl´e et al., 2000; Weller et al., 2000; Wagner et al., 2001), and they decrease with increasing al-titude in the free troposphere (Arlander et al., 1995; Jacob et al., 1996; Jaegl´e et al., 2000; Heikes et al., 2001; Fried et al., 2002; Fried et al., 2003). These measurements have been compared to model simulations based on simple steady state expressions (Arlander et al., 1995; Zhou et al., 1996), box models (Liu et al., 1992; Jacob et al., 1996; Ayers et al., 1997; Jaegl´e et al., 2000; Weller et al., 2000; Heikes et al., 2001; Frost et al., 2002; Wagner et al., 2002; Fried et al., 2003), two-dimensional (2D) (Lowe and Schmidt, 1983; Ar-lander et al., 1995), and 3D models (Brasseur et al., 1996; Hauglustaine et al., 1998; von Kuhlmann et al., 2003b). Al-though in some cases the models show good agreement with the HCHO observations, significant discrepancies are found frequently (Lowe and Schmidt, 1993; Liu et al., 1992; Arlan-der et al., 1995; Zhou et al., 1996; Jacob et al., 1996; Ayers et al., 1997; Jaegl´e et al., 2000; Weller et al., 2000; Heikes et al., 2001; Frost et al., 2002). For the marine boundary layer overestimation (Lowe and Schmidt, 1993; Jacob et al., 1996) as well as underestimation (Ayers et al., 1997; Weller et al., 2000) of the HCHO concentrations by models are not well understood. For the middle and upper free troposphere, models tend to systematically underestimate the HCHO con-centrations (Arlander et al., 1995; Hauglustaine et al., 1998; Jaegl´e et al., 2000; Heikes et al., 2001; Frost et al., 2002). More recent studies in the marine boundary layer by Wagner et al. (2001) and in the free troposphere by Fried et al. (2003) achieved very good measurement-model agreement. Here we present airborne in-situ measurements of HCHO and its precursors in the marine boundary layer and free troposphere over the eastern Mediterranean basin. The observations were made during 14 measurement flights of the German research aircraft Falcon (DLR, Oberpfaffenhofen) in August 2001 as part of the Mediterranean Intensive Oxidant Study (MINOS). A summary of the major results of the MINOS campaign can be found in Lelieveld et al. (2002).
In the following section the HCHO instrument is described and characterized in detail, while Sect. 3 describes the ob-servations made during MINOS. In Sect. 4 we present an intercomparison of the observations with predictions by a 3D chemical transport model. Section 5 includes sensitivity studies based on box model calculations with more detailed NMVOC chemistry. The findings of this study are discussed in Sect. 6 and summarized in the final section.
2 Experimental
A commercially available instrument (AERO Laser model AL 4021, Germany), modified for airborne operation, has been used for in-situ HCHO measurements. The instrument is based on the Hantzsch reagent method, initially used in
a colorimetric technique by Nash (1953), following the de-sign described in Kelly and Fortune (1994). In a first step, HCHO is stripped from a flow of 1 L/min (STP) of ambi-ent air into 0.1 N H2SO4(0.45 ml min−1) in a stainless steel
coil, temperature stabilized at 10◦C. The acidity of the strip-ping solution (pH ≈1) maximises the solubility of HCHO, and minimises the dissolution of ambient SO2, a potential
interferent of the detection process. In a second step, the HCHO in solution reacts with 2,4-pentanedione (acetylace-tone) to form C6H8O2 and with ammoniumacetate to form
C5H9NO. Both products combine to form
3,5-diacetyl-1,4-dihydrolutidine (DDL) in the so-called Hantzsch reaction. The reaction sequence takes place in a temperature sta-bilized (65◦C) stainless steel reaction coil. The detection and quantification of DDL is accomplished via fluorescence spectroscopy with a photomultiplier tube (Hamamatsu model H957-01, Japan) at 510 nm after excitation at 400 nm by means of a Hg-lamp (BHK-Inc., USA). The instrument re-sponse time (10%–90%), determined from a step concentra-tion change applied to the inlet, is approx. 180 s, after a delay time of approx. 260 s caused by the stripping and reaction coils.
Similar instruments have been used previously for ground and ship-based (Weller et al., 2000) measurements of HCHO. In several HCHO measurement technique intercomparisons Hantzsch instruments were compared to Differential Optical Absorption Spectroscopy (DOAS) and Tunable Diode Laser Absorption Spectroscopy (TDLAS) measurements, showing good agreement (Macdonald et al., 1999; Cardenas et al., 2000). To operate the instrument on a jet aircraft, the pres-sure decrease of ambient air with increasing altitude has to be accounted for. This was done by means of a constant pressure inlet, that stabilised the inlet pressure of the AL 4021 to 1200 hPa using two chemically inert Teflon mem-brane pumps (KNF Neuberger, model KN 828 KNDC, Ger-many) and a pressure control loop. Sampling of ambient air was accomplished via 1/4” PTFE tubing fed into a forward directed stainless steel inlet tube. The constant pressure in-let guarantees a pressure independent measurement between the boundary layer and the maximum ceiling of the Falcon (13 km, ∼150 hPa).
The in-field calibrations were performed with a 1 µM HCHO liquid-phase standard solution (corresponding to a gas phase concentration of 10 ppbv) before and after each measurement flight to determine the sensitivity of the in-strument. In addition an in-flight calibration was made dur-ing MINOS flight No. 9 on 17 August 2001. An exten-sive laboratory based comparison of the liquid phase cali-bration with gas phase calicali-brations based on a permeation device (KIN-TEK, model HRT, USA) demonstrated good agreement within the combined uncertainties of the liquid and gas-phase calibration standards (10%). The instru-ment background was determined after each calibration by passing ambient air over a built-in Hopcalit (60% MnO2,
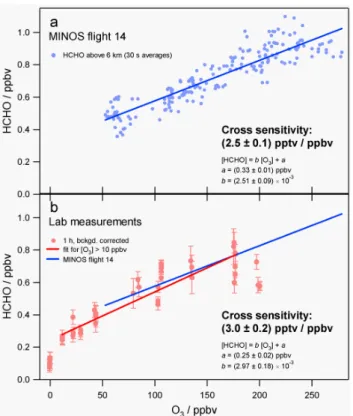
Fig. 1. Scatter plots of HCHO versus O3for MINOS data from the lowermost stratosphere (a) and laboratory based experiments with hydrocarbon-free zero air (b).
measurements were performed on a regular basis during the measurement flights. The precision (1.5% at 10 ppbv) and the detection limit (42 pptv) were determined from the re-producibility (1σ -standard deviation) of the instrument cali-brations and in-flight zero measurements, respectively.
Contrary to HCHO measurement systems based on optical absorption spectroscopy, e.g. DOAS (Platt and Perner, 1980) or TDLAS (Harris et al., 1989; Fried et al.,1997; Wagner et al., 2001), the Hantzsch reaction is not free of interferences, caused by other atmospheric constituents in the gas phase. These may be caused by species that are transferred into so-lution and in addition form photosensitive products that fluo-resce in the same wavelength region as DDL. Cross sensitiv-ity studies in the literature mainly deal with the role of higher aldehydes and ketones in forming alternative pyridines that could exhibit similar fluorescence spectra, or the influence of dissolved amines, competing with the formation of acety-lacetoamine (Dong and Dasgupta, 1987; Dasgupta et al., 1988; Kelly and Fortune, 1994). In general, the interfering species have a lower solubility than HCHO and rather low concentrations in the background atmosphere, promoting an interference-free measurement of HCHO. A further interfer-ing process is the production of methane sulfonic acid from dissolved SO2, which is efficiently suppressed by the use of
an acid stripping solution (Dong and Dasgupta, 1987).
Lower stratospheric measurements during the MINOS campaign indicated a significant increase of the instrument reading above the tropopause, pointing towards an ozone interference in the basic HCHO detection process or sec-ondary HCHO formation in the inlet system. Figure 1a shows measurements obtained in the lowermost stratosphere during MINOS flight No. 14 on 22 August 2001. A sig-nificant positive correlation (r = 0.91) between HCHO and O3 has been observed for O3 concentrations in excess of
100 ppbv. A least square regression fit yields a slope of (2.5 ±0.1) pptv/ppbv. To investigate the nature of this interfer-ence, laboratory studies were performed. Figure 1b shows results from laboratory-based experiments with hydrocarbon free air produced by a catalytic conversion of NMHC to CO2
(Headline filters, model CAP60, Germany) followed by a cryogenic trap (T <180 K). Illumination of the purified zero air with UV light (ansyco GPT) provided variable O3
con-centrations quantified by a UV absorption instrument (envi-ronment s.a., model O3-41M). Similar to the lower strato-spheric observations a linear regression was observed, indi-cating a cross sensitivity of (3.0 ± 0.2) pptv/ppbv, in good agreement with the slope of the stratospheric measurements. Based on these laboratory studies, it is rather unlikely that the observed interference is predominantly due to production of HCHO from residual hydrocarbons in ultra-clean zero air during the O3 production process (Macdonald et al., 1999)
or secondary HCHO production from organic aerosols due to reactions with O3on the inlet walls (Thomas et al., 2001).
Instead, our results indicate a direct cross sensitivity of the Hantzsch reaction itself towards O3, although the detailed
mechanism remains to be resolved. Note that extrapolation of the laboratory regression line to zero O3 concentrations
provides a HCHO concentration of (245 ± 16) pptv, signifi-cantly higher than observations (106 ± 60) pptv, most prob-ably indicating incomplete removal of hydrocarbons in the cold trap, and some contribution of secondary HCHO for-mation during the O3 production process in the laboratory
studies. For the following discussion, all HCHO measure-ments have been corrected for the observed O3interference
using a cross sensitivity of 2.5 pptv/ppbv. In addition, a fur-ther correction was made to account for an observed temper-ature dependency of the instrument of 1.6%/◦C. Including all these measures, we estimate the total uncertainty of the HCHO data to be of the order of 30% at a mixing ratio of 300 pptv.
3 Observations
A detailed discussion of the objectives and the major find-ings of the MINOS campaign can be found in Lelieveld et al. (2002). Fourteen measurement flights were performed in the marine boundary layer and the free troposphere over the Mediterranean basin. The majority (11) of the flights took place over the eastern Mediterranean Sea near Crete,
Table 1. Mean, median, and 1σ standard deviation (STD) for all flights and flights No. 2 and 8 separately as a function of 1 km altitude bins All flights Flight No. 2 Flight No. 8
Altitude Mean Median STD Mean Median STD Mean Median STD 0–1 1306 1107 522 1506 1468 220 1000 978 103 1–2 1177 1133 485 1292 1274 250 976 965 166 2–3 720 666 331 1059 1061 252 701 718 253 3–4 483 499 233 678 622 161 394 423 134 4–5 377 389 204 679 624 207 242 243 96 5–6 251 238 147 617 646 118 293 328 110 6–7 280 260 135 703 730 102 214 161 117 7–8 347 328 135 768 652 212 281 311 52 8–9 315 315 157 782 788 113 270 282 76 9–10 355 399 132 840 806 97 280 318 80 10–11 409 413 195 1062 1069 65 114 126 85 11–12 366 364 144 1276 1333 181 218 216 61
Fig. 2. Altitude profile of measured (blue: individual measure-ments; dark blue: means and 1σ -standard deviations over 1 km alti-tude bins) and modelled HCHO mixing ratios (red). Data measured during Flight No. 2 are plotted in green.
with Heraklion serving as the base for the DLR Falcon air-craft. Formaldehyde was measured during twelve flights per-formed between 1 August 2001 and 22 August 2001. In Fig. 2 the mean profile (± 1σ standard deviation) is plotted
as a function of altitude. The individual measurements (light blue points in Fig. 2) have been binned into 1 km altitude in-tervals (0–1 km, etc) and averaged. The mean, median and standard deviations for the individual altitude bins are listed in Table 1. In general, HCHO concentrations were highest in the marine boundary layer (∼1500 pptv) and decreased with increasing altitude. Lowest concentrations were observed in the middle troposphere at 5–7 km, at mean mixing ratios of the order of 250 pptv.
In the upper troposphere HCHO slightly increased to mean values in excess of 350 pptv at 10–12 km. In particular in the upper troposphere, the mean mixing ratio of HCHO showed a dependency on the airmass origin deduced from backward trajectories (Traub et al., 2003). The lowest mean concen-trations of HCHO of the order of 110 pptv at 10–11 km (Ta-ble 1) were observed during flight No. 8 on 16 August 2001. Backward trajectories indicated an airmass origin over the west Atlantic for this particular flight. The highest mixing ratio in excess of 1 ppbv (Table 1 and green data points in Fig. 2) were observed during flight No. 2 (03 August 2001) in the outflow of the Indian monsoon convection probed above 8 km altitude (Lelieveld et al., 2002; Traub et al., 2003; Scheeren et al., 2003).
The average concentration of HCHO in the marine bound-ary layer (0–1 km) is at least a factor of three higher than measurements in the remote areas of the Atlantic, Pacific or Indian Ocean (Zafirou et al., 1980; Lowe and Schmidt, 1983; Arlander et al., 1990; Heikes, 1992; Harris et al., 1992; Zhou et al., 1996; Mackay et al., 1996; Jacob et al., 1996; Ayers et al., 1997; Jaegl´e et al., 2000; Weller et al., 2000; Wag-ner et al., 2001) and comparable to continental background conditions (Harder et al., 1997; Fischer et al., 2003). This is mainly due to advection of pollution from eastern and west-ern Europe at altitudes below 4 km (Traub et al., 2003). In particular in the outflow of eastern Europe a strong contri-bution from biomass burning has been observed (Traub et
Table 2. Mean, median, 1σ standard deviation (STD), range (all in pptv) and number of data points for altitude bins of 1 km each obtained from observations (all flights except No. 2) and model results. Values at or below the detection limit are labeled DL
Observations MATCH model results
Altitude Mean Median STD Range Mean Median STD Range Number 0–1 1306 1107 522 498–2556 1141 1131 215 574–1670 605 1–2 1177 11336 485 250–2409 672 660 112 364–1056 311 2–3 720 666 331 51–1517 399 404 68 221–589 236 3–4 483 499 233 DL–1260 273 280 41 173–435 260 4–5 377 389 204 DL–905 187 181 33 118–263 113 5–6 251 238 147 DL–877 130 130 19 94–192 277 6–7 280 260 135 DL–823 103 104 15 77–164 128 7–8 347 328 135 DL–792 80 75 17 60–162 154 8–9 315 315 157 DL–741 76 67 27 48–161 211 9–10 355 399 132 49–596 76 60 36 37–150 178 10–11 409 413 195 DL–852 47 41 12 28–87 231 11–12 366 364 144 39–741 36 38 9 22–59 474
al., 2003). In the middle and upper troposphere mean con-centrations over the Mediterranean were on average a fac-tor of two higher than those observed over the tropical Pa-cific (Heikes et al., 2001) and the North and South Atlantic (Arlander et al., 1995; Jaegl´e et al., 2000). Note that these previous HCHO measurements were performed during dif-ferent seasons and at difdif-ferent locations around the globe, which limits their comparability towards the MINOS find-ings. Good agreement is found with HCHO observations in the middle troposphere during the NARE 97 campaign over the North Atlantic in September 1997 (Fried et al., 2002). Fried et al. (2002) report average concentrations of 265 pptv at 4–8 km, comparable to MINOS (Table 1), in particular for flight No. 8.
Observations above 4 km during MINOS flight No. 2 yield HCHO mixing ratios that are approximately a factor of 10 higher than observed in several previous missions (Arlander et al., 1995; Jacob et al., 1996; Jaegl´e et al., 2000; Heikes et al., 2001; Fried et al., 2002). They are comparable, how-ever, to airborne observations of HCHO during the South-ern Oxidants Study in the continental free troposphere over the south-eastern United States in summer 1995 (Lee et al., 1998).
4 Comparison to 3D-model results
Figure 2 includes an average profile deduced from model simulations (red curve), performed with the 3D chemistry transport model MATCH-MPIC (Model of Atmospheric Transport and Chemistry - Max Planck Institute for Chem-istry version) (Lawrence et al., 1999; von Kuhlmann, 2001; von Kuhlmann et al., 2003a). The model is driven by meteo-rological data from the NCEP weather center and includes an extensive non-methane hydrocarbon oxidation mechanism
described in detail by von Kuhlmann (2001). The model res-olution is 2.8◦in the horizontal and includes 42 levels in the
vertical up to about 2 hPa. During MINOS the model was used to provide chemical weather forecasts to assist the flight planning of the Falcon (Lawrence et al., 2003). The average profile (in 1 km altitude bins) was calculated from “virtual flights” through the model domain, following the aircraft tra-jectories of the Falcon missions. Figure 2 shows the average profile and the 1σ -standard deviation, while Table 2 contains detailed information on means, medians, standard deviations and ranges for the individual altitude bins, compared to the corresponding observational data.
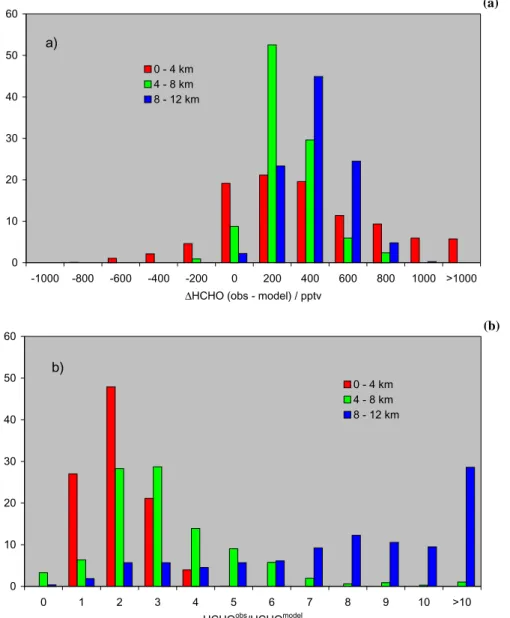
Figure 3 shows the absolute (1HCHO(obs–model) in pptv, Fig. 3a) and relative (HCHOobs/HCHOmodel, Fig. 3b) deviations between observations and model simula-tions for three altitude regimes (0–4 km, 4–8 km, 8–12 km). The relative difference of HCHO in the lower two layers is approx. 200 pptv (less than a factor 3), increasing to 300– 400 pptv (factor of 8) at higher altitudes.
To investigate the causes of the large discrepancy between observations and model results, Fig. 4 shows average pro-files, observations and model outputs, for a number of mea-sured trace gases. While model and measurements largely agree for O3, CO, and NOy, large deviations are obtained
for NO, PAN, CH3OH, and acetone. In particular the
ace-tone concentration is strongly underestimated by MATCH throughout the troposphere (factor of 10). As pointed out by Crawford et al. (1999), acetone photolysis has a strong influence on the HCHO budget in the upper troposphere, so that a model underestimation of acetone might result in an underestimation of HCHO as well.
Significant positive correlations were observed between measured HCHO and acetone and CH3OH, respectively, as
0 10 20 30 40 50 60 -1000 -800 -600 -400 -200 0 200 400 600 800 1000 >1000
∆HCHO (obs - model) / pptv 0 - 4 km 4 - 8 km 8 - 12 km a) (a) 0 10 20 30 40 50 60 0 1 2 3 4 5 6 7 8 9 10 >10 HCHOobs/HCHOmodel
0 - 4 km 4 - 8 km 8 - 12 km b)
(b)
Fig. 3. Histograms (%) of the difference (a) and the ratio (b) between measured and modelled HCHO mixing ratios in three different altitude bins (red: 0–4 km; green: 4–8 km; blue: 8–12 km).
emissions (Fig. 5). This could indicate that a significant HCHO precursor, either acetone or some other species, co-emitted with CO, is not, or not at sufficiently high concentra-tion, represented in MATCH. To check whether the missing acetone in the model can account for the too small HCHO, box model calculations were performed.
5 Sensitivity studies using box model calculations
A time dependent photochemical box model was used to study the role of acetone on the HCHO budget of the up-per troposphere. The box model has been described in detail by Br¨uhl et al. (2000). The model, which includes detailed VOC chemistry scheme, was initialised with average
con-centrations for the upper troposphere observed during the MINOS campaign (200 pptv NOx, 100 pptv PAN, 85 ppbv
CO, and 100 ppbv O3). Sensitivity runs with varied
concen-trations of acetone and CH3OH were made and compared
to a base run (CH4chemistry only). In general, the HCHO
concentration significantly increased with increasing concen-trations of acetone. After a small decrease in the first 48 h the delta HCHO is almost constant for the following 15–20 days, indicating significant secondary HCHO formation in air masses remote from the source region. The relative in-crease of HCHO after 20 days of model simulation is of the order of 28 pptv/ppbv for acetone. This result strongly de-pends on the PAN and NOxbackground mixing ratios. The
effect of CH3OH is largest during the first day of the model
Fig. 4. Altitude profiles of mean observed (blue) and modelled (red) mixing ratios in 1 km altitude bins for various trace gases measured during MINOS. All mixing ratios are given in pptv, except CO, NOy
and O3(ppbv).
Fig. 5. Scatter plots of HCHO versus CO, CH3OH and acetone,
respectively. The colour code refers to different altitude intervals (red: 0–4 km; green: 4–8 km; blue: 8–12 km).
after 20 days, reflecting the shorter photochemical lifetime of CH3OH compared to acetone in the upper troposphere.
Based on this study it may be expected that the 3D-model HCHO would increase by ∼30 pptv, to a value of approx. 70 pptv, after including 1 ppbv of additional acetone. This in-crease is higher than that obtained by Singh et al. (2000) who indicated an acetone sensitivity of 10–15 pptv/ppbv. These box model sensitivity studies clearly indicate that the un-derestimation of acetone, presumably related to an emission deficit, cannot be the sole cause of the strong underestima-tion of HCHO by the MATCH model. To close the budget an equivalent of at least 10 ppbv of an acetone-like HCHO pre-cursor would have to be included. Note that the HCHO mix-ing ratio also depends on the NO mixmix-ing ratio in the upper troposphere, since the reaction of NO with CH3O2governs
the rate of HCHO formation. Since NO is also
underesti-mated in MATCH, the HCHO enhancement in the box model runs is partly due to enhanced NO in the upper troposphere.
6 Discussion
Recent studies of HCHO in the middle and upper free tro-posphere indicate that state-of-the-art model predictions are generally consistently lower than observations. Table 3 com-pares observations and model results during the MINOS campaign (August 2001, Mediterranean basin, model re-sults from 3D CTM with increased acetone concentration) with results from NARE-97 (September 1997, North At-lantic Ocean, model results from box model runs constrained by observations) (Frost et al., 2002), SONEX (October-November 1997, North Atlantic Ocean, model results from box model runs constrained by observations, acetone de-duced from CO observations) (Jaegl´e et al., 2000), PEM-Tropics B (March-April 1999, tropical central Pacific, model results from box model runs constrained by observations) (Heikes et al., 2001) and TROPOZ II (January 1991, trop-ical Atlantic, model results from box model runs constrained by observations, acetone not included). Although differ-ent measuremdiffer-ent techniques, model types and chemistry schemes have been used, Table 3 confirms the tendency of the models to underestimate the concentration of upper tro-pospheric HCHO by a factor of 1.5–5. The observation-model discrepancies are largest for modestly polluted areas (MINOS, NARE, SONEX). Smallest differences between observations and models are achieved for the tropical Pacific (PEM-Tropics B) and Atlantic (TROPOZ-II) areas, respec-tively, where trace gas and aerosol number concentrations are typically factors of 2 to 10 smaller than over the Mediter-ranean (Lelieveld et al., 2002).
Fried et al. (2003) report observations of HCHO ob-tained during a series of TOPSE measurement flights be-tween February and May 2000. They compared in-situ observations of HCHO with box model results and gener-ally found good agreement for background conditions, while data affected by recent pollution showed large observation-model deviations. In addition, they found that for back-ground conditions at very low temperatures (starting around −45◦C), significant and persistent observation-model differ-ences were found during the early deployments at low light levels at high latitudes in the 6–8 km altitude range, some-times with measured HCHO exceeding modelled mixing ra-tios by nearly 400 pptv (median difference 132 pptv or 83%). Taking into account that different measurement techniques have been used for the observations listed in Table 3, it seems unlikely that the reported measurement-model discrepancies are due to instrument artefacts caused by interfering species. Nevertheless, one has to consider that all techniques applied so far require the transfer of ambient air into the HCHO sensor via an inlet system. Laboratory based studies by Thomas et al. (2001) report the formation of HCHO under
Table 3. HCHO observation/model comparisons in the free troposphere (Mixing ratios and differences of mixing ratios are given in pptv) MINOS1 NARE-972 SONEX3 PEM-T B4 TROPOZ-II5
[HCHO] 340 ± 150 230 ± 150 0–270 55 110 Obs/Model ∼5 1.84 ± 0.34 ∼2.1 1.4 1.5
Obs – Model ∼250 ∼140 15
1this study, data above 6 km except from flight 2, model result from MATCH including 1 ppbv of acetone 2(Frost et al., 2002), data between 4-8 km
3(Jaegl´e et al., 2000), data between 8–12 km 4(Heikes et al., 2001), data above 8 km
5(Arlander et al., 1995), data from the tropics (20S-20N), between 6 and 10 km
dry conditions in a reaction of ozone with terminal alkenes serving as a proxy for atmospheric organic aerosols, indicat-ing that in principle aerosol contaminated inlet lines could be responsible for artificial HCHO formation. Although a de-pendency of HCHO on O3concentrations was observed
dur-ing MINOS, laboratory studies indicated that this was most likely not due to secondary HCHO formation in the inlet sys-tem (see Sect. 2). This is in line with observations by Wert et al. (2002), who did not find sampling artefacts in an exten-sive evaluation of an inlet system similar to the one used for the HCHO measurements in the present study.
Although an instrument artefact cannot be completely ruled out, it is more likely that the higher HCHO concen-trations observed in this study, as well as those reported in the literature, point to a missing HCHO source in the middle and upper troposphere. Recent studies (Ayers et al., 1997; Weller et al., 2000; Elrod et al., 2001; Fried et al., 2003) investigated whether direct production of HCHO in the re-action of CH3O2 with HO2, circumventing the production
of CH3OOH, may enhance the production of formaldehyde.
Relying on recent kinetic studies of the temperature depen-dency of the branching ratio between direct HCHO versus CH3OOH formation for this reaction (Elrod et al., 2001),
Fried et al. (2003) came to the conclusion that this pro-cess is not sufficiently important to explain the measurement-model discrepancies. Based on sensitivity studies, they also excluded reaction of CH4with Cl or errors in the HCHO
pho-tolysis rate at low temperatures as being responsible for the model underestimation of HCHO.
The observation of a positive correlation among HCHO and CH3OH, which was also observed in this study,
stimu-lated Jaegl´e et al. (2000) to speculate about the heteroge-neous conversion of methanol to HCHO on cirrus clouds, al-though recent laboratory experiments by Iraci et al. (2002) did not find evidence for such a process. A further poten-tial HCHO production mechanism could be photochemical degradation of unmeasured partially oxidized hydrocarbons. Frost et al. (2002) concluded that additional VOCs with a to-tal reactivity equivalent to 1.3 ppbv CH3OOH, 12 ppbv
ace-tone, or 11 ppbv CH3OH would be needed to account for a
measured-modelled HCHO difference of 184 pptv.
Fig. 6. Altitude profiles of mean and 1σ -standard deviation of HCHO for different airmass origins in the upper troposphere. Red data represent observations from MINOS flights No. 1–5 performed under the influence of the Indian summer monsoon, while the blue data are from flights No. 6–14 (North Atlantic/North American air-mass origin).
Further indirect evidence for the role of additional organic precursors comes from this study. As discussed in Sect. 3 the HCHO level in the upper troposphere is strongly depen-dent on the airmass origin. While the MATCH model re-sults predict low and rather constant values in the upper tro-posphere, Fig. 6 shows that average HCHO mixing ratios in airmasses affected by the Indian summer monsoon (red
curve, Flights No. 1–5) are significantly higher than in air-masses from the North Atlantic/North American area (blue curve, Flights No. 6–14) (Traub et al., 2003; Scheeren et al., 2003). The influence of the monsoon outflow is strongest at the highest altitudes, which is reflected in the increas-ing HCHO levels above 7 km. In an accompanyincreas-ing paper, Scheeren et al. (2003) show that these airmasses are rich in combustion products of biofuel use. In contrast to this ob-servation, the North Atlantic/North American HCHO profile is a nearly constant above 5 km at levels comparable to those observed over the North Atlantic during NARE-97 (Fried et al., 2002; Frost et al., 2002). This could indicate that addi-tional, long-lived VOCs associated with biomass combustion are at least partially responsible for the obtained observation-model discrepancies for HCHO.
7 Summary and conclusions
Airborne formaldehyde measurements based on the Hantzsch reaction technique were performed over the eastern Mediterranean Sea during the MINOS campaign in August 2001. Measured concentrations in the marine boundary layer of the order of 1.3 ppbv are relatively well simulated by a chemistry-transport model (MATCH). At higher altitudes (above 6 km) HCHO levels decreased to 0.34 ppbv, though much higher than predicted by the model (∼0.05 ppbv). In general observed HCHO levels in the upper troposphere were dependent on the airmass origin. Vertical profiles affected by the Indian summer monsoon show minimum concentrations of approx. 300 pptv at 6–7 km, increasing to more than 600 pptv above 11 km, the altitude with the maximum observed monsoon influence. The HCHO profile for airmasses with a North Atlantic/North American origin show nearly constant values with altitude of the order of 280 pptv above 5 km, comparable to those observed over the North Atlantic during NARE-97 (Fried et al., 2002; Frost et al., 2002). Sensitivity studies indicate that the measurement-model disagreement cannot be resolved based on known chemistry and emissions. In particular the observed dependency of HCHO on airmass origin might indicate that unknown, relatively long-lived NMVOCs – or their reaction intermediates – associated with biomass burning in South Asia are at least partially responsible for the HCHO observation-model discrepancies. To resolve this issue additional field and laboratory studies are needed.
Acknowledgement. We gratefully acknowledge the excellent
col-laboration with the pilots and technicians of the DLR Falcon. Ad-ditionally, we like to thank P. Stier and M. Schulz for additional in-field chemical weather forecasts, which proved to be very help-ful in day to day flight planning.
References
Arlander, D. W., Cronn, D. R., Farmer, J. C., Menzias, F. A., and Westberg, H. H.: Gaseous oxygenated hydrocarbons in the re-mote marine troposphere, J. Geophys. Res., 95, 16 391–16 403, 1990.
Arlander, D. W., Br¨uning, D., Schmidt, U., and Ehhalt, D. H.: The tropospheric distribution of formaldehyde during TROPOZ II, J. Atmos. Chem., 22, 251–268, 1995.
Ayers, G. P., Gillett, R. W., Granek, H., de Serves, C., and Cox, R. A.: Formaldehyde production in clean marine air, Geophys. Res. Lett., 24, 401–404, 1997.
Brasseur, G. P., Hauglustaine, D. A., and Walters, S.: Chemical compounds in the remote Pacific troposphere: Comparison be-tween MLOPEX measurements and chemical transport model calculations, J. Geophys. Res., 101, 14 795–14 813, 1996. Br¨uhl, C., P¨oschl, U., Crutzen, P. J., and Steil, B.: Acetone and
PAN in the upper troposphere: Impact on ozone production from aircraft emissions, Atmos. Environm., 34, 3931–3938, 2000. Cardenas, L. M., Brassington, D. J., Allan, B. J., Coe, H., Alicke,
B., Platt, U., Wilson, K. M., Plane, J. M., and Penkett, S. A.: In-tercomparison of formaldehyde measurements in clean and pol-luted atmospheres, J. Atmos. Chem., 37, 53–80, 2000.
Carlier, P., Hannachi, H., and Mouvier, G.: The chemistry of car-bonyl compounds in the atmosphere: A review, Atmos. Envi-ronm., 20, 2079–2099, 1986.
Crawford, J., Davis, D., Olson, J., Chen, G., Liu, S., Gregory, G., Sandholm, S., Heikes, B., Singh, H., and Blake, D.: Assessment of upper tropospheric HOxsources over the tropical Pacific based
on NASA GTE/PEM data: Net effect on HOx and other
pho-tochemical parameters, J. Geophys. Res., 104, 16 255–16 273, 1999.
Dasgupta, P. K., Dong, S., Hwang, H., Yang, H.-C., and Genfa, Z.: Continuous liquid-phase fluorometry coupled to a diffu-sion scrubber for the real-time determination of atmospheric formaldehyde, hydrogen peroxide and sulfur dioxide, Atmos. Environm., 22, 949–963, 1988.
de Serves, C.: Gas phase formaldehyde and peroxide measurements in the Arctic atmosphere, J. Geophys. Res., 99, 25 391–25 398, 1994.
Dong, S., and Dasgupta, P. K.: Fast fluorometric flow injection anal-ysis of formaldehyde in atmospheric water, Environ. Sci. Techn., 21, 581–588, 1987.
Elrod, M. J., Ranschaert, D. L., and Schneider, N. J.: Direct ki-netic study of the temperature dependence of the CH2O branch-ing channel for the CH3O2+ HO2reaction, Int. J. Chem. Kinet.,
33, 363–376, 2001.
Fischer, H., Kormann, R., Kl¨upfel, T., Gurk, Ch., K¨onigstedt, R., Parchatka, U., M¨uhle, J., Rhee, T. S., Brenninkmeijer, C. A. M., Bonasoni, P., and Stohl, A.: Ozone production and trace gas cor-relations during the June 2000 MINATROC intensive measure-ment campaign at Mt. Cimone, Atmos. Chem. Phys., 3, 725–738, 2002.
Fried, A., Sewell, S., Henry, B., Wert, B. P., Gilpin, T., and Drum-mond, J. R.: Tunable diode laser absorption spectrometer for ground-based measurements of formaldehyde, J. Geophys. Res., 102, 6253–6266, 1997.
Fried, A., Lee, Y.-N., Frost, G., Wert, B., Henry, B., Drummond, J., H¨ubler, G., and Jobson, T.: Airborne CH2O measurements over the North Atlantic during the 1997 NARE campaign:
In-strument comparisons and distributions, J. Geophys. Res., 107, D4, 10.1029/2000JD000260, 2002.
Fried, A., Wang, Y., Cantrell, C., Wert, B., Walega, J., Ridley, B., Atlas, E., Shetter, R., Lefer, B., Coffey, M.T., Hannigan, J., Blake, D., Blake, N., Meinardi, S., Talbot, B., Dibb, J. Scheuer, E., Wingenter, O., Snow, J., Heikes, B., and Ehhalt, D.: Tunable diode laser measurements of formaldehyde during the TOPSE 2000 study: Distributions, trends and model comparisons, J. Geophys. Res., 108, D4, 9365, doi: 10.1029/2002JD002208, 2003.
Frost, G. J., Fried, A., Lee, Y.-N., Wert, B., Henry, B., Drummond, J. R., Evans, M. J., Fehsenfeld, F. C., Goldan, P. D., Holloway, J. S., H¨ubler, G., Jakoubek, R., Jobson, B. T., Knapp, K., Kuster, W. C., Roberts, J., Rudolph, J., Ryerson, T. B., Stohl, A., Stroud, C., Sueper, D. T., Trainer, M., and Williams, J.: Comparison of box model calculations and measurements of formaldehyde from the 1997 North Atlantic Regional Experiment, J. Geophys. Res., 107, D8, 10.1029/2001JD000896, 2002.
Harder, J. W., Fried, A., Sewell, S., and Henry, B.: Comparison of tunable diode laser and lon-path ultraviolet/visible spectroscopic measurements of ambient formaldehyde concentrations during the 1993 OH Photochemistry Experiment, J. Geophy. Res., 102, 6267–6282, 1997.
Harris, G. W., Mackay, G. I., Iguchi, T., Mayne, L. K., and Schiff, H. I.: Measurements of formaldehyde in the troposphere by tun-able diode laser absorption spectroscopy, J. Atmos. Chem., 8, 119–137, 1989.
Harris, G. W., Klemp, D., Zenker, T., Burrows, J. P., and Mathieu, B.: Tunable diode laser measurements of trace gases during the 1988 Polarstern cruise and intercomparison with other methods, J. Atmos. Chem., 15, 315–326, 1992.
Hauglustaine, D. A., Brasseur, G. P., Walters, S., Rasch, P. J., M¨uller, J.-F., Emmons, L. K., and Carroll, M. A.: MOZART, a global chemical transport model of ozone and related chemical tracers: 2. Model results and evaluation, J. Geophys. Res., 103, 28 291–28 335, 1998.
Heikes, B. G.: Formaldehyde and hydroperoxides at Mauna Loa Observatory, J. Geophys. Res., 97, 18 0010–18 013, 1992. Heikes, B., Snow, J., Egli, P., O’Sullivan, D., Crawford, J., Olson,
J., Chen, G., Davis, D., Blake, N., and Blake, D.: Formaldehyde over the central Pacific during PEM-Tropics B, J. Geophys. Res., 106, 32 717–32 731, 2001.
Iraci, L. T., Essin, A. M., and Golden, D. M.: Solubility of methanol in low-temperature aqueous sulfuric acid and implications for at-mospheric particle composition, J. Phys. Chem. A, 106, 4054– 4060, 2002.
Jacob, D. J., Heikes, B. G., Fan, S.-M., Logan, J. A., Mauzerall, D. L., Bradshaw, J. D., Singh, H. B., Gregory, G. L., Talbot, R. W., Blake, D. R., and Sachse, G. W.: Origin of ozone and NOxin the tropical troposphere: A photochemical analysis of
aircraft observations over the South Atlantic basin, J. Geophys. Res., 101, 24 235–24 250, 1996.
Jaegl´e, L., Jacob, D. J., Brune, W. H., Faloona, I., Tan, D., Heikes, B. G., Kondo, Y., Sachse, G. W., Anderson, B., Gregory, G. L., Singh, H. B., Pueschel, R., Ferry, G., Blake, D. R., and Shet-ter, R. E.: Photochemistry of HOx in the upper troposphere at
northern midlatitudes, J.Geophys. Res., 3877–3892, 2000. Kelly, T. J., and Fortune, C. R.: Continuous monitoring of gaseous
formaldehyde using an improved fluorescence approach, Intern.
J. Environ. Anal. Chem., 54, 249–263, 1994.
Lawrence, M. G., Crutzen, P. J., Rasch, P. J., Eaton, B. E., and Mahowald, N. M.: A model for studies of tropospheric photo-chemistry: Description, global distributions, and evaluation, J. Geophys. Res., 104, 26 245–26 277, 1999.
Lawrence, M. G., Rasch, P. J., von Kuhlmann, R., Williams, J., Fis-cher, H., de Reus, M., Lelieveld, J., Crutzen, P.J., Schultz, M., Stier, P., Huntrieser, H., Heland, J., Stohl, A., Forster, C., Elbern, H., Jakobs, H., and Dickerson, R. R.: Global chemical weather forecasts for field campaign planning: Predictions and observa-tions of large-scale features during MINOS, CONTRACE, and INDOEX, Atmos. Chem. Phys., 3, 267–289, 2002.
Lee, M., Heikes, B. G., Jacob, D. J., Sachse, G., and Anderson, B.: Hydrogen peroxide, organic peroxides, and formaldehyde as primary pollutants from biomass burning, J. Geophys. Res., 102, 1301–1309, 1997.
Lee, Y.-N., Zhou, X., Kleinmann, L. I., Nunnermacker, L. J., Springston, S. R., Daum, P. H., Newman, L., Keigley, W. G., Holdren, M. W., Spicer, C. W., Young, Y., Fu, B., Parrish, D. D., Holloway, J., Williams, J., Roberts, J. M., Ryerson, T. B., and Fehsenfeld, F. C.: Atmospheric chemistry and distribution of formaldehyde and several multioxygenated carbonyl compounds during the 1995 Nashville/Middle Tennessee Ozone Study, J. Geophys. Res., 103, 22 449–22 462, 1998.
Lelieveld, J., Berresheim, H., Borrmann, S., Crutzen, P. J., Den-tener, F. J., Fischer, H., Feichter, J., Flatau, P., Heland, J., Holzinger, R., Kormann, R., Lawrence, M., Levin, Z., Markow-icz, K., Mihalopoulos, N., Minikin, A., Ramanathan, V., de Reus, M., Roelofs, G. J., Scheeren, H. A., Sciare, J., Schlager, H., Schultz, M., Siegmund, P., Steil, B., Stephanou, E., Stier, P., Traub, M., Williams, J., and Ziereis, H.: Global air pollution crossroads over the Mediterranean, Science, 298, 794–799, 2002. Liu, S. C., Trainer, M., Carroll, M. A., H¨ubler, G., Montzka, D. D., Norton, R. B., Ridley, B. A., Walega, J. G., Atlas, E. L., Heikes, B. G., Huebert, B. J., and Warren, W.: A study of the photo-chemistry and ozone budget during the Mauna Loa Observatory Experiment, J. Geophys. Res., 97, 10 463–10 471, 1992. Lowe, D. C. and Schmidt, U.: Formaldehyde (HCHO)
measure-ments in the nonurban atmosphere, J. Geophys. Res., 88, 10 844– 10 858, 1983.
Macdonald, A. M., Wiebe, H. A., Li, S. M., Dryfhout-Clark, H., Asalian, K., Lu, G., Wang, D., Schiller, C. L., Harris, G. W., Sumner, A. L., and Shepson, P. B.: Results of a formaldehyde intercomparison study in Ontario, Report Nr. ACSD-99-001, At-mospheric Environment Service, Ontario, Canada, 1999. Mackay, G. I., Karecki, D. R., and Schiff, H. I.: Tunable diode laser
absorption measurements of H2O2and HCHO during the Mauna
Loa Photochemistry Experiment, J. Geophys. Res., 101, 14 721– 14 728, 1996.
Nash, T.: The colorimetric estimation of formaldehyde by means of the Hantzsch reaction, Biochemistry, 55, 416–421, 1953. Platt, U. and Perner, D.: Direct measurements of atmospheric
CH2O, HNO2, O3, NO2, and SO2by differential optical absorp-tion in the near UV, J. Geophys. Res., 85, 7453–7458, 1980. Scheeren, H. A., Lelieveld, J., Roelofs, G.-J., Williams, J.,
Fis-cher, H., de Reus, M., de Gouw, J. A., Warneke, C., Holzinger, R., Schlager, H., Kl¨upfel, T., Bolder, M., van der Veen, C., and Lawrence, M.: The impact of monsoon outflow from South-East Asia in the upper troposphere over the eastern Mediterranean,
Atmos. Chem. Phys. Discuss., 3, 2285–2330, 2003.
Sigsby, J. E., Tejada, S., Ray, W., Lang, M., and Duncan, J. W.: Volatile organic compounds emissions from 46 in-use passenger cars, Environm. Sci. Technol., 21, 466–475, 1987.
Singh, H. B., Chen, Y., Tabazadeh, A., Fukui, Y., Yantosca, R., Ja-cob, D., Arnold, F., Wohlfrom, K., Atlas, E., Flocke, F., Blake, D., Blake, N., Heikes, B., Snow, J., Talbot, R., Gregory, G., Sachse, G., Vay, S., and Kondo, Y.: Distribution and fate of selected oxygenated organic species in the lower troposphere and lower stratosphere over the Atlantic, J. Geophys. Res., 105, 3795–3805, 2000.
Thomas, E. R., Frost, G. J., and Rudich, Y.: Reactive uptake of ozone by proxies for organic aerosols: Surface-bound and gas-phase products, J. Geophys. Res., 106, 3045–3056, 2001. Traub, M., Fischer, H., de Reus, M., Kormann, R., Heland, J.,
Ziereis, H., Schlager, H., Holzinger, R., Williams, J., Warneke, C., de Gouw, J., and Lelieveld, J.: Chemical characteristics as-signed to trajectory clusters during the MINOS campaign, At-mos. Chem. Phys., 3, 459–468, 2003.
von Kuhlmann, R.: Photochemistry of tropospheric ozone, its pre-cursors and the hydroxyl radical: A 3D-modeling study con-sidering non-methane hydrocarbons, Ph.D. thesis, University of Mainz, Mainz, Germany, 2001.
von Kuhlmann, R., Lawrence, M. G., Crutzen, P. J., and Rasch, P. J.: A model for studies of tropospheric ozone and non-methane hydrocarbons: Model description and ozone results, J. Geophys. Res., in press, 2003a.
von Kuhlmann, R., Lawrence, M. G., Crutzen, P. J., and Rasch, P. J.: A model for studies of tropospheric ozone and non-methane hy-drocarbons: Model evaluation of ozone related species, J. Geo-phys. Res., submitted, 2003b.
Wagner, V., Schiller, C., and Fischer, H.: Formaldehyde measure-ments in the marine boundary layer of the Indian Ocean during the 1999 INDOEX cruise of the R/V Ronald H. Brown, J. Geo-phys. Res., 106, 28 529–28 538, 2001.
Wagner, V., von Glasow, R., Fischer, H., and Crutzen, P. J.: Are CH2O measurements in the marine boundary layer suitable for testing the current understanding of CH4
pho-tooxidation?: A model study, J. Geophys. Res., 107, D3, 10.1029/2001JD000722, 2002.
Weller, R. O., Schrems, O., Boddenberg, A., G¨ab, S., and Gautrois, M.: Meridional distribution of hydroperoxides and formalde-hyde in the marine boundary layer of the Atlantic (48◦N–35◦S) measured during the Albatross campaign, J. Geophys. Res., 105, 14 401–14 412, 2000.
Wert, B. P., Fried, A., Henry, B., and Cartier, S.: Evaluation of inlets used for the airborne measurement of formaldehyde, J. Geophys. Res., 107, D13, 10.1029/2001JD001072, 2002.
Zafirou, O. C., Alford, J., Herrera, M., Peltzer, E. T., Gagosian, R. B., and Liu, S. C.: Formaldehyde in remote marine air and rain: Flux measurements and estimates, Geophys. Res. Lett., 7, 341– 344, 1980.
Zhou, X., Lee, Y.-N., Newman, L., Chen, X., and Mopper, K.: Tro-pospheric formaldehyde concentration at the Mauna Loa Obser-vatory during the Mauna Loa Photochemistry Experiment 2, J. Geophys. Res., 101, 14 711–14 719, 1996.