102 CANADIAN COUNSELLOR, VOL. 2, No. 2, APRIL, 1968, 102-108 L. I. MASSON
Department of Educational Psychology, The University of Calgary.
JOHN W. GOUGH
Counselor, Forest Lawn High School, Calgary.
SELF-CONCEPT OF ADOLESCENTS IN A JUNIOR
A C A D E M I C V O C A T I O N A L S C H O O L A N D I N A R E G U L A R J U N I O R H I G H S C H O O L
This study was designed to investigate a developing self-concept as it applies to two adolescent groups. These two groups were Grade IX students in a
Regular Junior High School and similar age and level students in a Junior Academic Vocational School. The definitions of these groups are peculiar to the Calgary, Alberta, Public School System.
Theoretically the study may be dually based, partly upon Airport's classi-cal and definitive study in 1937, with which most personality theorists are agreed in that the self or personality is shaped in large part by the environ-ment. The study is also partly based upon the fact that various learning theor-ists maintain that environmental influence results from feedback from one's environment. If these statements are true, then the self-concept development of adolescents in the Junior Academic Vocational program should show some differences to that of the Regular Junior High group.
The suspected justification for such a claim emanates from the fact that the writers have on occasion observed Regular Junior High students taunting their Junior Academic Vocational counterparts with derisive comments such as, to use the vernacular, "retards" or "dumbies." Cole and Hall (1964) state that one of the deepest of adolescent needs is to be supported and approved by his peers. If this is the case, then one could hypothesize that the self-concept of the Junior Academic Vocational students should be somewhat different from that of the students in the Regular Junior High program. The purpose of this study was to investigate this difference.
According to Lecky (1945) an individual's concept of himself achieves a rather high degree of organization during the course of his development and comes to resist change, once self-differentiation and self-definition have taken place. As yet it is not known by what age the process of self-definition reaches stability, but Taylor (1955) leads us to believe that the concept of self remains relatively stable, even over extended periods of time in young adults.
There are a number of theoretical and partially supported statements in the literature about the storms and stresses of certain aspects of adolescent development, particularly by Hall (1904), but the fate of the self-concept in adolescence is still a matter for considerable speculation. The studies that examine individual differences in the self-concepts of adolescents from a number of vantage points represent an inroad into the area of individual self-concept development. One of these vantage points is investigated by Q-methodology.
CONSEILLER CANADIEN, VOL. 2, No. 2, AVRIL, 1968 ]Q3 The Q-methodology originated with Stephenson (1953) in California in
1949. Block (1961), a student of Stephenson, has emerged as an authority on Q-methodology and provides a readable and extensive account of how Q-methodology might best be employed.
Q-sort technique is based upon a set of statements which have been previously decided upon. This set of statements constitutes the entire vocabu-lary that the sorter is permitted to use. Stephenson ( 1953) says that the items are put in an order of representativeness for the individual, those most char-acteristic of him being given high scores, while those least charchar-acteristic are scored low.
The two major advantages of the Q-method are that it provides a con-venient means of objectifying and standardizing personality responses and that it allows a standard vocalulary which is hopefully interpreted by most people in the same way.
The major disadvantages are that the language involved may be inade-quate for conveying the feelings of the sorter and that the forced-choice tech-nique may discard possible important information about the variance and range of response. Cronbach and Gleser originated this argument in 1954. A number of studies have shown that the Q-methodology is readily adaptable to the examination of the self-concept. Strong (1962) mentions that the Q-sort is an effective measure of self-concept and ideal self-concept for a wide range of people.
Storey (1967) used a Q-sort of his own design to measure self-concept in accelerates and decelerates, with considerable success. This study was used as a model for the present one.
EXPERIMENTAL DESIGN
1. The Tools of the Experiment. The Q-Tags used in this experiment were developed by Storey at The University of Calgary. Content cards were developed primarily from the Minnesota Multiphasic Personality Inventory, and also the Q-Bat developed by Oldridge at The University of British Co-lumbia.
Item and factor analysis reduced the original items to a final form con-taining fifty-four items evenly distributed among six factors: affective, asser-tive, effecasser-tive, hostility, reverie, and social. There are no definitions given to these factors, and the authors make no claims to assess personality beyond them.
A rank order type of correlation coefficient is obtained by use of the "I am" form which is normally administered first, followed by the second form containing "I wish I were" statements, adapted from the first form.
2. The Sample. The sample included 120 students, 60 from each school (30 boys and 30 girls). This sample was reduced by absences and incorrectly marked papers to 104. This number included 46 students from a Junior Aca-demic Vocational school and 58 from a Regular Junior High school.
3. Organization and Treatment of the Data. For the sake of clarity the organization and treatment of the data are best reported in a step-by-step manner.
a. The tests were administered and scored, and correlation coefficients were calculated between the i and w forms of the test for each indi-vidual.
104 CANADIAN COUNSELLOR, VOL. 2, No. 2, APRIL, 1968
b. Individual correlation coefficients for the two forms of the test were then converted to Z scores using Fisher's Z(r) transformation. These Z(r) scores were then averaged and mean correlation coefficients emerged for the various groups. These mean correlation coefficients were then tested for inter-group difference using a t test.
c. An IBM card for every individual was punched with each of the separate factors of the "I am" form being recorded.
d. The IBM cards were fed into the IBM 360/30, yielding means, standard deviations, and correlation matrices for the whole group as well as for four distinct groups.
e. Using the data obtained from the foregoing procedure the IBM 360/30 yielded an analysis of variance.
f. Using the means and standard deviations, t tests of means were cal-culated to compare the differences between the groups.
RESULTS
1. Coefficients of correlation. Coefficients of correlation having been computed for each individual as well as between factors for each group, it was possible to compare group differences as well as the relationship between the various factors for each sub-group. The individual's correlation coeffic-ient on the two forms of the test was converted to a Z score using Fisher's Z(r) transformation. These Z scores were averaged and a mean correlation for the group was obtained, as well as means for boys and girls as groups. Mean correlations were then computed for the Junior Academic Vocational and the Regular Junior High group. These correlation coefficients were compared by testing for the significance of difference between Z(r) means.
Table I shows the t values derived from these comparisons, and Tables II, III, IV, V, and VI show the correlation matrices between factors for each of the sub-groups.
TABLE I
r's OF MEAN Z(r) SCORES BETWEEN GROUPS MS Girls MS Boys JAV Girls JAV Boys MS Girls
MS Boys .478 —
JAV Girls .981 .495 —
JAV Boys .703 .269 .170 —
TABLE II
GROUP: TOTAL COMBINED GROUP OF 104 STUDENTS
aff. as. eff. ho. rev. soc.
aff. 1.00 as. —.32** 1.00 eff. —.28** .23* 1.00 ho. .02 .47** .39** 1.00 rev. .04 39** .47** .13 1.00 soc. .17 —.06 —'.01 —.36** —.13 1.00 * sig. > .05 ** sig. > .01
CONSEILLER CANADIEN, VOL. 2, No. 2, AVRIL, 1968 I Q J TABLE III
GROUP: A: REGULAR JUNIOR HIGH BOYS N=25
aff. as. eff. ho. rev. soc.
aff. 1.00 as. —.32 1.00 eff. —.38 .18 1.00 ho. .11 —.66** —.39* 1.00 rev. .45* —.50** —.62** .30 1.00 soc. —.05 .17 .24 —.51** —.20 1.00 * sig. > .05 ** sig. > .01 TABLE IV
GROUP: B: REGULAR JUNIOR HIGH GIRLS N= =33
aff. as. eff. ho. rev. soc.
aff. 1.00 as. —.43** 1.00 eff. —.42** .32 1.00 ho. .06 —.30 44** 1.00 rev. .01 .49** —!30 —.05 1.00 soc. —.31 — ! l 3 —.13 —.05 —.17 1.00 * sig. > .05 ** sig. > .01 TABLE V
GROUP: C: JUNIOR ACADEMIC VOCATIONAL BOYS N=21
aff. as. eff. ho. rev. soc.
aff. 1.00 as. —.44* 1.00 eff. .20 .28 1.00 ho. —.19 —.52* —.64** 1.00 rev. —.10 —.33 —.72** .74** 1.00 soc. .20 —.47* —.24 —.04 —.17 1.00 * sig. > .05 ** sig. > .01 TABLE VI
GROUP: D: JUNIOR ACADEMIC VOCATIONAL GIRLS N=25
aff. as. eff. ho. rev. soc.
aff. 1.00 as. —.18 1.00 eff. .05 .03 1.00 ho. —.09 —.08 —.09 1.00 rev. —.17 —.11 —.39* —.48* 1.00 soc. —.28 —.33 —.03 —.50** .19 1.00 * sig. > .05 ** sig. > .01
2. Group factor means. The means of the six factors were computed for four groups; the Regular Junior High boys and girls and the Junior Aca-demic Vocational boys and girls. These means were then subjected to two-way analysis of variance, the results of which are shown in Table VII.
Jflg CANADIAN COUNSELLOR, VOL. 2, No. 2, APRIL, 1968 TABLE VII ANALYSIS OF VARIANCE
Source of Variation Sums of Squares df Mean Square Rows 1.47 Columns 805.45 Interaction 132.10 3 5 15 0.49 161.09 8.81 Total 939.02 23
F-Ratio for Row Effects = Row/Interaction = 0.06 F-Ratio for Column Effects = Column/Interaction =
•Significant at .01 level.
18.29*
It is obvious from the data in Table VII that the F-ratio for column/ interaction is highly significant. This means that there is an existing differ-ence between the columns as related to the interaction effects for both groups and columns. After reaching this conclusion, it was necessary to test the columns for difference by means of a t test.
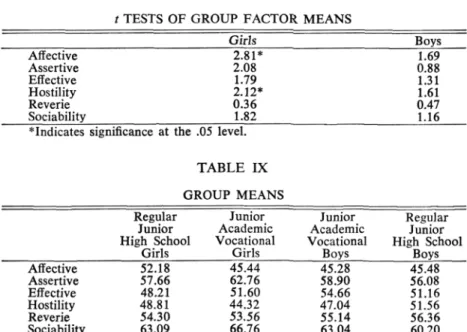
Convention would dictate that a group of boys be tested against boys and girls against girls because of the marked difference between the sexes at adolescence. Table VIII of group factor means is the result of the afomentioned t tests. The significant t tests are shown with an asterisk. By re-ferring to Table IX one is able to determine the direction of the differences; for example the Regular Junior High school girls show a significantly higher mean on affective and hostility than do the Junior Academic Vocational girls. In addition the Junior Academic Vocational girls show a higher level of ex-pressed assertiveness than does the other group.
TABLE VIII
t TESTS OF GROUP FACTOR MEANS
Girls Boys Affective 2.81* 1.69 Assertive 2.08 0.88 Effective 1.79 1.31 Hostility 2.12* 1.61 Reverie 0.36 0.47 Sociability 1.82 1.16
* Indicates significance at the .05 level. TABLE IX GROUP MEANS
Regular Junior Junior Regular Junior Academic Academic Junior High School Vocational Vocational High School
Girls Girls Boys Boys
Affective 52.18 45.44 45.28 45.48 Assertive 57.66 62.76 58.90 56.08 Effective 48.21 51.60 54.66 51.16 Hostility 48.81 44.32 47.04 51.56 Reverie 54.30 53.56 55.14 56.36 Sociability 63.09 66.76 63.04 60.20
CONSEILLER CANADIEN, VOL. 2, No. 2, AVRIL, 1968 ^QJ DISCUSSION
The high negative correlations in Table I might certainly be expected, since they compare hostility and reverie on the one hand and assertive and effective on the other, these factors tending to be mutually exclusive.
In the correlation matrix of the total group in Table II, there is one significantly positive correlation, between assertive and effective. Since the titles of the scales show some similarity, this correlation is not surprising.
A comparison of the correlation matrices of Tables III and V shows two significantly positive correlations, between reverie and affective, and between reverie and hostility, the latter being the single most significant cor-relation in all matrices. The conclusion which might be drawn is that the Regular Junior High School boys are involved in emotional day-dreams, while the Junior Academic Vocational boys engage in hostile day-dreams. Both groups show a highly significant negative correlation between effective and reverie, which implies that these day-dreamers do not see themselves as effective.
Table VI shows a positive reverie—sociability correlation, the Junior Academic Vocational girls being the only group which exhibits this char-acteristic. It might be reasoned that the Junior Academic Vocational girls who are inclined to reverie are sociable daydreamers, which is quite the opposite of the Junior Academic Vocational boys with their hostile day-dreams.
The remainder of the correlations on the five tables are negligible and can be disregarded.
Tables VIII and IX are related to t tests of group factor means. The compared groups of girls show the only significant results. The Regular Junior High School girls are significantly more affective and hostile than are the Junior Academic Vocational girls. The Junior Academic Vocational girls are significantly more effective than the Regular Junior High School girls. It is important to remember that these are relative measures and do not imply any absolute values. Norms are not yet sufficiently developed to allow norm comparisons, but since the sample of both groups is of reasonable size some inferences from the foregoing comparisons could be drawn.
The self-concept of the two groups examined was by no means fully revealed by this experiment, but significant differences were noted in a few areas, and although these differences may only be characteristic of the specific groups examined, further extensive research may validate the following findings:
A. Reverie—Regular Junior High School boys were found to be emo-tional in their day-dreams, while Junior Academic Vocaemo-tional boys were markedly hostile in their day-dreams. The Junior Academic Vocational girls are inclined to be sociable day-dreamers while the Regular Junior High School girls exhibit no marked correlation with reverie.
B. Hostility and Emotion—The Regular Junior High School girls were found to be significantly more hostile and emotional than the Junior Aca-demic Vocational girls.
C. Effective—The Junior Academic Vocational girls see themselves as being effective significantly more than do the Regular Junior High School girls.
JQJ CANADIAN COUNSELLOR, VOL. 2, No. 2, APRIL, 1968
Further research might take the form of testing similar groups with a Q-sort and a personality inventory—thus, possibly some light might be shed on the present findings as well as other areas of the adolescent self-concept.
The major hypothesis of this paper was to test the differences in self-concept between Junior Academic Vocational students and those of students in a Regular Junior High School.
Within the limitations of the study, differences were indicated and these now lead to further research to be undertaken in the course of the coming year.
REFERENCES
Allport1 G. W. Personality: A psychological interpretation. New York: Holt, 1937.
Block, J. The Q-sort method in personality assessment and psychiatric research. Springfield, 111.: Charles C Thomas, 1961.
Cole, L., & Hall, I. N. Psychology of adolescence. (6th ed.) New York: Holt Rinehart & Winston, 1964.
Cronbach, L. J., & Gleser, G. C. Review of W. J. Stephenson, The study of be-haviour: Q-technique and its methodology. Psychometrika, 1954, 19, 327-330. Hall, G. S. Adolescence. Vol. 1, New York: Appleton-Century-Crofts, 1904. Lecky, P. Self-consistency: A theory of personality. New York: Island Press,
1945.
Oldridge, B. "Q-Behavior Analysis Test," Card Distribution Board, unpublished, University of British Columbia.
Stephenson, W. J. The study of behaviour: Q-technique and its methodology. Chicago: University of Chicago Press, 1953.
Storey, A. G. Acceleration, deceleration and self concepts. The Alberta Journal of Educational Research, 1967, 13, 135-142.
Strong, D. J. A factor analytic study of several measures of self concept. Journal of Counseling Psychology, 1962, 9, 64-70.
Taylor, D. M. Changes in the self concept without psychotherapy. Journal of Consulting Psychology, 1955,19, 205-209.