HAL Id: hal-00299044
https://hal.archives-ouvertes.fr/hal-00299044
Submitted on 1 Jan 2003
HAL is a multi-disciplinary open access
archive for the deposit and dissemination of
sci-entific research documents, whether they are
pub-lished or not. The documents may come from
teaching and research institutions in France or
abroad, or from public or private research centers.
L’archive ouverte pluridisciplinaire HAL, est
destinée au dépôt et à la diffusion de documents
scientifiques de niveau recherche, publiés ou non,
émanant des établissements d’enseignement et de
recherche français ou étrangers, des laboratoires
publics ou privés.
New study of the 1755 earthquake source based on
multi-channel seismic survey data and tsunami modeling
M. A. Baptista, J. M. Miranda, F. Chierici, N. Zitellini
To cite this version:
M. A. Baptista, J. M. Miranda, F. Chierici, N. Zitellini. New study of the 1755 earthquake source
based on multi-channel seismic survey data and tsunami modeling. Natural Hazards and Earth System
Science, Copernicus Publications on behalf of the European Geosciences Union, 2003, 3 (5),
pp.333-340. �hal-00299044�
Natural Hazards and Earth System Sciences (2003) 3: 333–340
© European Geosciences Union 2003
Natural Hazards
and Earth
System Sciences
New study of the 1755 earthquake source based on multi-channel
seismic survey data and tsunami modeling
M. A. Baptista1, 2, J. M. Miranda2, F. Chierici3, 4, and N. Zitellini3
1Instituto Superior de Engenharia de Lisboa, Rua Conselheiro Emdio Navarro, 1, 1900-049 Lisboa, Portugal
2Centro de Geofisica da Universidade de Lisboa, Rua Ernesto de Vasconcelos, Faculdade de Ciˆencias Ed. C8, 6◦, 1700 Lisboa, Portugal
3Instituto di Geologia Marina, Via Gobetti, 101, Bologna 40100, Italy 4Istituto di Radioastronomia – Sez. di Matera, Contrada Terlecchia, Matera
Received: 8 October 2002 – Revised: 5 February 2003 – Accepted: 7 February 2003
Abstract. In the last years, large effort has been done to carry out multi-channel seismic reflection surveys (MCS) in SW Iberia to locate the active tectonic structures that could be re-lated to the generation of the 1755 Lisbon earthquake and the tsunami. The outcome of these researches led to the iden-tification of a large, compressive tectonic structure, named Marquˆes de Pombal thrust that, alone can account for only half the seismic energy released by the 1755 event. However, these investigations have shown the presence of additional tectonic structures active along the continental margin of SW Iberia that are here evaluated to model the tsunami waves ob-served along the coasts of Iberia, Morocco and Central At-lantic. In this paper we present a new reappraisal of the 1755 source, proposing a possible composite source, including the Marquˆes de Pombal thrust fault and the Guadalquivir Bank. The test of the source is achieved through numerical mod-elling of the tsunami all over the North Atlantic area. The results presented now incorporate data from the geophysi-cal cruises and the historigeophysi-cal observation along the European coasts and also from the Western Indies. The results of this study will, hopefully, improve the seismic risk assessment and evaluation in the Portuguese territory, Spain, Morocco and Central/North Atlantic.
1 Introduction
On 1 November 1755 the city of Lisbon was struck by an earthquake which magnitude was evaluated as close to 8.7 (Richter, 1958; Johnston, 1996) and its MSK epicentre inten-sity was XI-XII. The highest intensities were observed in Lis-bon area and along the Algarve (south Portuguese Coast). It was felt all over Europe, north Morocco and Madeira Island. The tsunami that followed the earthquake was observed all over the North Atlantic coasts from Cornwall (UK) to North Morocco; several authors report significant run up heights in
Correspondence to: M. A. Baptista
the West Indies (Lander and Lockridge, 1989; Lander et al., 2002; Mader, 2001), in addition coeval sources refer the ob-servation of a significant flux and reflux of the waters (Wat-son, 1756; Supplem. Gentlemen’s Magazine, 1755).
Several authors investigated the source of the Lisbon earthquake, using either macroseismic data (Martinez So-lares, 1979; Levret, 1991), average tsunami amplitudes (Abe, 1979), or scale comparisons with the 28 February 1969 event (Johnston, 1996); all these studies were based on the assump-tion that the 1755 earthquake source was located south of the Gorringe Bank, in the Horseshoe Abyssal Plain (cf. Fig. 1), close to the 1969 earthquake and tsunami source (Heinrich et al., 1994; Gjevik et al., 1997), and most probably related with the bank build up (Fukao, 1973). A different approach was considered by Baptista et al. (1998a, b) throughout the systematic study of the historical records of the 1755 tsunami wave heights observed along the Iberian and Morocco coasts. (Baptista et al., 1998b), based on hydrodynamic modelling, concluded for a different source position, located, closer to the SW Portuguese continental margin.
Independently, Zitellini et al. (1999), based on the out-come of a regional MCS survey performed in 1992 (AR92 lines, Fig. 1), identified a very large active, compressive, tec-tonic structure located 100 km offshore SW Cape S˜ao Vi-cente which was proposed as a good candidate for the gen-eration of the 1775 event. This localisation was compatible with Baptista et al. (1998b) numerical modelling. Results on hydrodynamic modelling using the MPTF segment as a sin-gle source and 20 m slip along the fault plane (Baptista et al., 2000) showed that the synthetic wave heights are underes-timated overall Iberia shore, Madeira Islands and Morocco. Successively, based on the result of the previous MCS sur-vey, a second MCS campaign was performed (Zitellini et al., 2001) in the area located between the Gorringe Bank, the SW Iberian coast and the Gulf of Cadiz (BIGSETS lines in Fig. 1). The results of this new data acquisition allowed to determine the lateral extend of the structure, called Marquˆes de Pombal Thrust by Zitellini et al. (2001) and to locate, pre-viously undetected, active tectonic structures (Zitellini et al.,
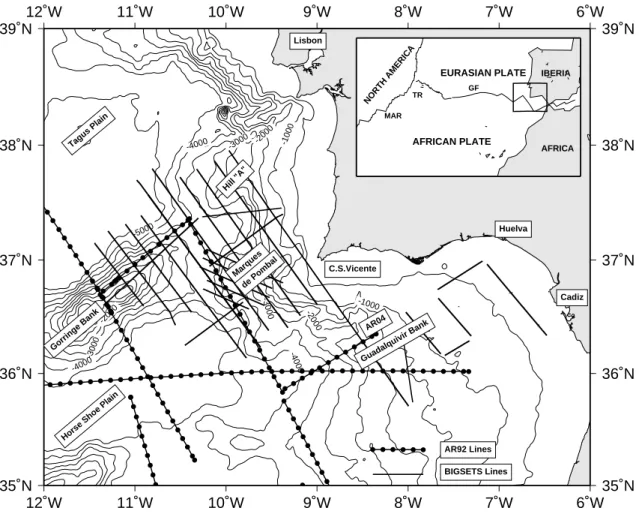
334 New study of the 1755 earthquake source -5000 -4000 -4000 -4000 -3000 -3000 -3000 -2000 -2000 -2000 -1000 -1000 -1000 12˚W 12˚W 11˚W 11˚W 10˚W 10˚W 9˚W 9˚W 8˚W 8˚W 7˚W 7˚W 6˚W 6˚W 35˚N 35˚N 36˚N 36˚N 37˚N 37˚N 38˚N 38˚N 39˚N 39˚N Gorringe Bank Tagus Plain AR04
Horse Shoe Plain
Cadiz C.S.Vicente Lisbon Huelva Guadalquivir Bank Marques de Pombal Hill "A" AR92 Lines BIGSETS Lines AFRICAN PLATE EURASIAN PLATE NORTH AMERICA MAR GF TR IBERIA AFRICA
Fig. 1. MCS reflection profiles AR92 and BIGSETS.
2001; Zitellini et al., 2003). The aim of the present study is to test, through numerical modelling of the tsunami all over the North Atlantic area, a possible composite source deduced from MCS data. We extend previous studies, integrating in-formation from southern United Kingdom (UK), as well as run up observations from West Indies. We also discuss the observed and computed macro-seismic intensities to evalu-ate the likelihood of the proposed tectonic sources.
2 The 1755 Lisbon tsunami data
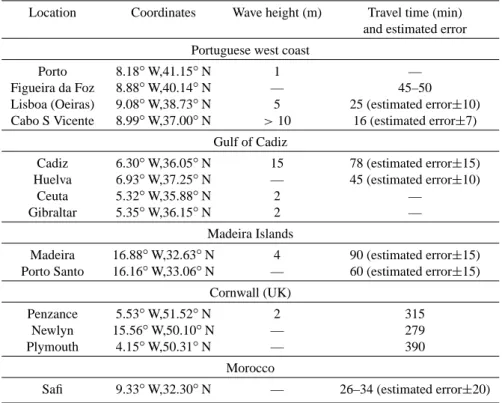
The evaluation of observed wave heights and travel times along the Iberian coast, Morocco, Madeira Islands and United Kingdom (south coast) was obtained by Baptista et al. (1998a) through detailed study of coeval Portuguese, Spanish and English reports. Most significant results are summarised in Table 1.
The UK coeval reports of the fellows of the Royal Soci-ety of London, refer the observation of the tsunami in Corn-wall and Southeast England, for example: “A little after two o’clock [...]” the sea was observed to advance suddenly at the Mount Pier [...] (Borlase, 1756); “A little after two o’clock [...] the sea was observed to advance suddenly at the Mount Pier [...] Penzance pier lies three miles west of Mount and
the reflux was first observed here 45 Minutes after two [...]” (Borlase, 1756) “a mile southeast of Plymouth [...] the tide had made a very extraordinary out...almost immediately after high water (about 4 pm) [...]” (Huxham, 1756). Concerning the wave heights the only reliable value found in those doc-uments is 2.1 m in Penzance. The other descriptions being somewhat contradictory.
Data from Portugal, Spain, Morocco and UK are summa-rized in Table 1.
The Supplement of the Gentlemen’s Magazine (1755) re-ports the observation of the flux and reflux in Antigua (West Indies): “[...] About the time of the earthquake at Lisbon there was such a sea without the bar of Antigua as had not been known in the memory of man, and after it all the wa-ter at the wharfs, which used to be six feet was not two inches”[...], and Barbados: “[...] On 1 November, about two in the afternoon the sea ebbed and flowed in a most surpris-ing manner; it ran over the wharfs into the houses, and the old bridge brought up numbers of fish of several sorts”[...]; Watson (1756) reported the occurrence of the 1755 tsunami in the Barbados Island: “[...] the tide rose here 12 feet per-pendicular and returned immediately: the same at Barbados [...] it began at half an hour after three [...] and flowed every five minutes five feet perpendicular [...]”. On the same letter
New study of the 1755 earthquake source 335
Table 1. Tsunami arrival times and wave heights used in this study
Location Coordinates Wave height (m) Travel time (min) and estimated error Portuguese west coast
Porto 8.18◦W,41.15◦N 1 —
Figueira da Foz 8.88◦W,40.14◦N — 45–50
Lisboa (Oeiras) 9.08◦W,38.73◦N 5 25 (estimated error±10) Cabo S Vicente 8.99◦W,37.00◦N >10 16 (estimated error±7)
Gulf of Cadiz
Cadiz 6.30◦W,36.05◦N 15 78 (estimated error±15) Huelva 6.93◦W,37.25◦N — 45 (estimated error±10)
Ceuta 5.32◦W,35.88◦N 2 —
Gibraltar 5.35◦W,36.15◦N 2 —
Madeira Islands
Madeira 16.88◦W,32.63◦N 4 90 (estimated error±15) Porto Santo 16.16◦W,33.06◦N — 60 (estimated error±15)
Cornwall (UK)
Penzance 5.53◦W,51.52◦N 2 315
Newlyn 15.56◦W,50.10◦N — 279
Plymouth 4.15◦W,50.31◦N — 390
Morocco
Safi 9.33◦W,32.30◦N — 26–34 (estimated error±20)
Table 2. 1755 Tsunami run up amplitudes in the West Indies used
in this study
Observation point Run up (m) Antigua (61.80◦W,17.05◦N) 3.7 Barbados (57.62◦W,13.08◦N) 1.5 Barbados Carlisle Bay 0.8 Dominica (61.33◦W,15.42◦N) 3.7 Saba (63.23◦W,17.63◦N) 6.4 St Martin (63.07◦W,18.07◦N) 4.5
he says [...] “Since I wrote this I have taken a more particular account of the flux and reflux above mentioned from an ob-serving man of this Island who remarked that here it began at half an hour after three in the afternoon... and flowed ev-ery five minutes, five feet perpendicular till as much after six without any violent disturbance on the surface of the water [...]”. A report published in 1895 in the Barbados Avocate journal (Shepherd, Pers. Commun., 2001.) refers the 1755 event: “[...] The water flowed in and out the harbour with such a force ... and caused the fish to float on its surface and drove many of them up on dry land [...]”.
The travel time presented by Baptista et al. (1998a) and Mader (2001) is 472 min. Lander and Lockridge (1989), Lander et al. (2002) and Mader (2001) present similar run up values for the West Indies (see Table 2).
As we had no access to Caribbean coeve reports the data
presented in this study is a summary from Lander and Lock-ridge (1989), Lander et al. (2002) and Mader (2001). Ac-cording to Mader (2001) local bathymetric effects can pro-duce large run up heights.
Shepherd (2001) presents a systematic review of the West Indies historic data, concerning the 1755 event, concluding that the average amplitude in the area may be evaluated as 2–3 m and that no damage or casualties were reported.
3 Investigation of the tectonic source
The first MCS profiles were carried out in 1992 (AR92 lines) (Sartori et al., 1994; Zitellini, 1999). One of the major results of the above investigations was the discovery of compressive tectonic structures of regional significance related to Europe-Africa plate convergence. These studies have shown that the most intensively deformed region encompasses the Gorringe Ridge, the Ampere and Coral Patch sea mounts, the northern part of Seine plain, the SW continental margin of Iberia and the area of the Gulf of Cadiz (Sartori et al., 1994). The defor-mation is active, neogenic in age, and is mainly expressed as long-wavelength (ten to tens of km), large amplitude, folds in the sediment cover. One of the AR92 lines crossed a large tectonic which was thought to be the source area of the 1755 Lisbon Earthquake (Zitellini et al., 1999). This struc-ture was successively called Marquˆes de Pombal by Zitellini et al. (2001).
The following MCS survey (BIGSETS line, Fig. 2) showed, beside Gorringe Bank and Marquˆes de Pombal, the
336 New study of the 1755 earthquake source Figure 2: AR04 line, across the Guadalquivir Bank.
Fig. 2. AR04 line, across the Guadalquivir Bank.
presence of other active compressive tectonic structures of regional significance: Horseshoe Fault (HS), Guadalquivir Bank (GB) and a large hill of tectonic origin located at 37.7◦N 10◦W (hill “A” in Fig. 1). The general trend of the folds and of the seamounts is NE-SW in the oceanic areas while the structural trend rotates to N 20◦E at the “Marquˆes de Pombal” and almost E-W at the Guadalquivir Bank. The folds are associated to reverse-thrust faults in the underlying basement (blind faults) but faults rarely breach the seafloor. All these structures share active tectonic uplift due to con-traction and relevant lateral continuity (Zitellini et al., 2001, 2003). Among these, the Marquˆes de Pombal was considered by Zitellini et al. as a potentially candidate to be considered at least a segment of the 1755 source.
One major result of BIGSETS survey is that there are no other major large contractional features besides the one pre-viously found and the tectonic hill located at 37.7◦N, 10◦W too close to Lisbon to justify the travel times observed dur-ing the 1755 event. As discussed by Zitellini et al. (2001), the Marquˆes de Pombal alone is unable to account for the seis-mic energy released and for the large tsunami that propagated in the whole North Atlantic. They suggested that a second thrust fault, located Southward of Cabe San Vicente, may rupture simultaneously with the Marquˆes de Pombal (see Fig. 3 in Zitellini et al., 2001) acting as a sort of “pop up”. The resulting estimated released energy is of the same order of magnitude of the 1755 Lisbon Earthquake (Mw = 8.3), still half of the energy estimated for the 8.7 magnitude event of 1755. In this paper we follow Zitellini et al. (2001) sug-gestion of composite rupture areas related to a “pop up like” structure. We envisage an extension of the rupture area in the Gulf of Cadiz that encompasses the Guadalquivir Bank (GB) and accounts for the size of the rupture area required by the 1755 Event. The Guadalquivir Bank is shown in MCS line AR04 (Fig. 2). Here we can observe the folding of the most recent reflectors caused by reverse, blind faults, that bounds the Bank. The displacement of 1.0 s. TWT (two way time) of the Middle Miocene chaotic body underline the shorten-ing of this sector with a southward main direction of trans-port. Because of its regional significance, location,
consider-0 0 0 4 4 8 8 12 -12º -12º -11º -11º -10º -10º -9º -9º -8º -8º -7º -7º -6º -6º 35º 35º 36º 36º 37º 37º 38º 38º 39º 39º 40º 40º -12º -12º -11º -11º -10º -10º -9º -9º -8º -8º -7º -7º -6º -6º 35º 35º 36º 36º 37º 37º 38º 38º 39º 39º 40º 40º
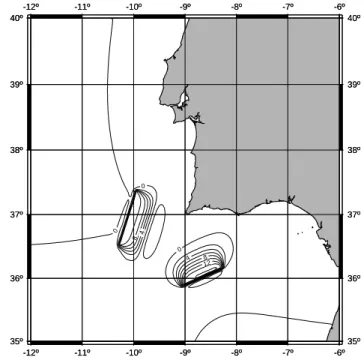
Fig. 3. Initial Displacement for source candidate MPTF+GB,
ex-pressed in meter.
able shortening, vertical up-lift and evidence of present day tectonic activity we consider the Guadalquivir Bank as the possible South, Southeastward extension of the rupture area related to the 1755 event.
4 The tsunami source area
Empirical relations between magnitude and source area, and between magnitude and fault slip (Wells and Copper-smith, 1994), suggest that an earthquake with magnitude 8.5 (that we can consider a bare minimum for the 1755 earthquake magnitude) corresponds to a slip ranging from 11.6 m to 17.3 m and a rupture area between 17 579 km2and 29 682 km2. Johnston (1996) based on scaling of isoseismal areas with the 1969 earthquake point to a slip of approxi-mately 12 m over a 200 km by 80 km rupture area.
The composite source studied here (MPTF/GB) corre-sponds to consider the rupture area formed by two segments, one following the MP thrust and the other southern flank of the Guadalquivir Bank. The ocean bottom deformation was computed using Mansinha and Smiley (1971) equations for the half space elastic approach. The initial displacement of the water surface is assumed to be equal to the sea bottom deformation, as the dimensions of the fault area are much larger than the water depth. The initial deformation is shown in Fig. 3.
5 Hydrodynamic modelling
The simulations of tsunami propagation use a shallow water non-linear model based on SWAN code (Mader, 1988, 2001).
New study of the 1755 earthquake source 337
Table 3. Synthetic Wave Heights and Travel Times for the MPTF/GB source
Location Coordinates Depth Computed wave Computed travel of virtual of virtual height (m) time (min) tide gauge tide gauge (m) maximum 1st peak
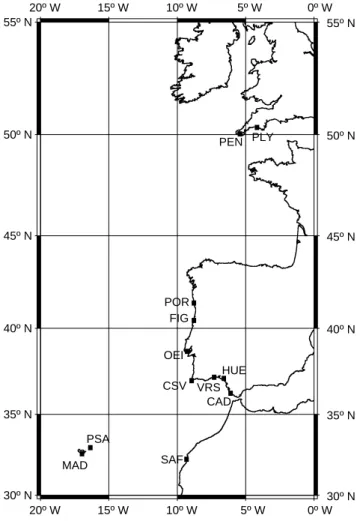
Porto 8.95◦W,41.15◦N 7.7 1.05 90 Figueira da Foz 8.88◦W, 40.14◦N 23.4 0.90 86 Lisboa (Oeiras) 9.32◦W, 38.68◦N 3.9 4.28 35 Cabo S Vicente 8.98◦W, 37.00◦N 27.8 12.10 19 Cadiz 6.30◦W, 36.45◦N 12.8 4.78 (2nd) 58 Huelva 6.93◦W, 37.23◦N 2.2 2.56 83 Madeira 16.78◦W, 32.68◦N 35.8 3.60 (2nd) 83 Porto Santo 16.28◦W, 33.05◦N 128.5 2.63 (7th) 67 Safi 9.33◦W, 32.30◦N 11.3 1.14 94 Penzance 5.56◦W, 50.03◦N 32.0 0.60 268 Plymouth 4.18◦W, 50.33◦N 3.3 0.24 (2nd) 332 Barbados 59.40◦W, 13.10◦N 177.0 0.20 473 Antigua 61.80◦W, 17.00◦N 60.0 0.24 474 20º W 20º W 15º W 15º W 10º W 10º W 5º W 5º W 0º W 0º W 30º N 35º N 40º N 45º N 50º N 55º N POR FIG OEI CSV VRS CAD HUE SAF PSA MAD PEN PLY 30º N 35º N 40º N 45º N 50º N 55º N
Fig. 4. Observations points used in this study for the North Atlantic
area.
This model solves the non-linear long wave equations of the fluid flow, using an explicit in time finite difference scheme
(see Mader, 1988). Calculation was preformed in geograph-ical coordinates. The bathymetric grid was obtained from Smith and Sandwell (1997) and the grid resolution used in the calculations is 0.025 degrees for the Iberian offshore and United Kingdom and 0.1 degree resolution for the Caribbean region.
Figure 4 shows the “observations points” used in this study. Each “virtual tide gauge” was slightly moved to the closest grid node with a depth not less then 10 m. Synthetic mareograms are presented in Fig. 5 for Cornwall and West Indies. In Table 3 we present the computed wave heights and travel times for a set of locations were we have historical observations.
In what concerns the synthetic travel times, obtained with this source, we can conclude that the results are acceptable for most locations with exceptions in Huelva and Safi. In both places our simulation produce very late arrivals. In order to investigate the result obtained in Huelva we used a virtual tide gauge located at Vila Real de Santo Antonio (VRS) a few kilometres from Huelva but outside the estuary (see Fig. 2 for location). Here the synthetic travel time and wave height are compatible with Huelva historical reports. We may conclude that the location of our virtual tide gauge for Huelva is too much up estuary and that tsunami propaga-tion suffers a strong delay due to low water depth. The lack of historical data from VRS does not permit further conclu-sions.
On the contrary the longer travel time obtained for Safi cannot be explained by this modelled source: if the historical report concerning Safi will be found reliable we should in-voke an ad hoc phenomenon or hypothesize a southward ex-tension of the source. We must also underline that the satel-lite derived bathymetric grid used in the model is presently below the resolution needed for the shallow water approxi-mation (250 m grid stepping).
338 New study of the 1755 earthquake source
Figure 5. a: Synthetic tsunamis (a) UK (b) West Indies.
0 50 100 150 200 250 300 350 400 -0,7 -0,6 -0,5 -0,4 -0,3 -0,2 -0,1 0,0 0,1 0,2 0,3 0,4 0,5 0,6 0,7 Wa ve H ei gh t ( m ) Time (minutes) Plymouth Penzance 0 100 200 300 400 500 600 -0,3 -0,2 -0,1 0,0 0,1 0,2 0,3 W av e H ei g ht ( m ) Time (minutes) Barbados Antigua
Fig. 5. Synthetic tsunamis (a) UK (pen – Penzance; plym –
Ply-mouth) (b) West Indies (Barb – Barbados, Ant – Antigua).
times and observed ones, for distant locations, may have been produced by the excessive smoothing of the sea floor rough-ness caused by this lack of resolution.
The mean effect of an increasing roughness of the sea floor should result in longer travel times and higher wave height.
Notwithstanding the wave heights produced with this source are still underestimated especially in Cadiz where the reported wave height is about 15 m. Baptista et al. (1998) conclude that historical reports may present an overestima-tion of the wave height; although that may be an acceptable explanation we must also conclude that some local bathy-metric effects influence strongly the wave heights observed. That problem may be investigated using a much finer grid in this area, but that’s beyond the scope of the present study
6 Synthetic isoseismal map
The 1755 isoseismal map was obtained by Baptista (1998), with a compilation of macroseismic data for the Iberian Peninsula. The Portuguese data set was compiled with the
Figure 6: Synthetic tsunamis for Huelva (hue) and Vila Real Sto Antonio (vrs)
0 50 100 150 200 250 300 350 -6 -5 -4 -3 -2 -1 0 1 2 3 4 5 6 W a ve He ight (m) Time (minutes) hue vrs
Fig. 6. Synthetic tsunamis for Huelva (hue) and Vila Real Sto
An-tonio (vrs).
values published by Pereira de Sousa (1919) and with data in-ferred from the reading and interpretation of coeval sources, e.g. Arq. Min. Reino (1756). The Spanish data was, from the IGN (Instituto Geogr´afico Nacional, Madrid) obtained by digitisation of macroseismic intensity and the corresponding geographical coordinates (Mezcua, pers. comm.). The final data set for the Iberian Peninsula includes 821 data points.
The attenuation law used for the 1755 earthquake was ob-tained by Baptista (1998) and Baptista and Miranda (2001). Distances between each point and the source were calculated to the nearest border of the source, considered as a set of two plane polygons. Comparison between the observed and predicted isoseismal map is shown in Fig. 7.
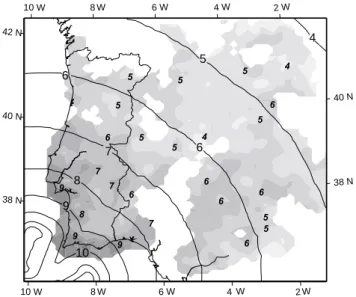
If we compare the observed and the synthetic intensities produced by the MPTF/GB model we can conclude that the fit is quite good, even in what concerns the “L-shaped” iso-seismals near the SW Portuguese coasts.
7 Discussion and conclusions
In this work we used the results from geophysical cruises made in recent years across the SW Portuguese margin to design a (preliminary) tectonic source and to test it against available historical information covering not only the Euro-pean coasts but also data from the West Indies. Tsunami data were carefully re-analysed and a final set is presented.
The size of the proposed tectonic source is mainly con-strained by the MCS reflection profiles. The fault parameters of the two source segments are the following: MPTF seg-ment: 105 km long, 55 km wide, dip angle 24◦, strike 21.7◦, slip 20 m; GB segment: 96 km long, 55 km wide, dip 45◦, strike 70◦, slip 20 m. The slip used, is comparable with aver-age values deduced by Wells and Coppersmith (1994) and by Johnston (1996). However, due to the inferred fault dimen-sions, this value is needed, not only to reproduce the wave
New study of the 1755 earthquake source 339 8 W 8 W 6 W 6 W 4 W 4 W 2 W 2 W 10 W 10 W 38 N 38 N 40 N 40 N 42 N 7 7 6 5 4 8 9 10 6 6 6 6 6 5 5 5 5 6 4 5 5 5 5 4 5 6 6 7 7 7 8 9 9 9
Fig. 7. Synthetic Isoseismal map for the MPTF/GB source.
heights observed in the nearest locations (SW Iberia), but also to account for the seismic moment of an 8.7 earthquake. Previous studies on investigation of the tectonic source of the 1755 Lisbon earthquake and tsunami have already tested the MPTF as a single source candidate (Lisbon, Septem-ber, 2000). The present study includes new historical data from UK and Caribbean regions, new hydrodynamic simu-lations considering the MPTF and the Guadalquivir Bank as a composite source. This study includes the evaluation of a large quantity of multi-channel seismic data acquired in the SW Iberian margin very recently, here used to constrain the source.
The need of a large source area has been demonstrated pre-viously (e.g. Johnston, 1996); the fact that MPTF is not suffi-cient to release the needed energy was also already discussed by Zitellini et al. (2001). The proposed composite source agrees with MCS data, with energy considerations, both for the earthquake and the tsunami, and produce a quite good fit of the isoseismal distribution (Fig. 5). The assumption of simultaneous rupture of MPTF and Guadalquivir Bank im-plies the presence of an accommodation surface connecting the faults at depth. This decollement surface was inferred at 16–18 km depth, nearby the MTPF, by Zitellini et al. (2001) based on deep penetrating MCS data and hypocentral earth-quake distribution. The analysis of the synthetic mareograms displayed in Fig. 4 and the comparison of the wave height and arrival times of Tables 1, 2 and 3 shows a good agree-ment between the model and the observation for the most of the localities of SW Iberia, Madeira and Porto Santo, with the relevant exception of the wave height in Cadiz and the arrival time in Safi. The proposed source produce lower wave height and shorter arrival time in UK than observed and very low wave heights in Caribbean area. The distribution of seismic activity in the Gulf of Cadiz suggests a probable extension of the proposed source toward Guadalquivir.
In what concerns Cornwall area and West Indies, that are
here modelled for the first time, synthetic wave heights are smaller and quite imperceptible. This fact may be due to in-sufficient source dimension and lack of detailed bathymetry for those areas. The calculation of run up amplification fac-tors may enhance in 30% the wave heights (Mader, 2001).
New efforts for a better identification of the tectonic source of the 1755 Lisbon earthquake must be directed to a better understanding of the geodynamic puzzle that corresponds to the Africa Eurasia plate boundary south of Iberia and proba-bly a larger source area (and a smaller slip?) must be identi-fied to be able to reproduce the faraway seismic and tsunami data.
Acknowledgements. We acknowledge Dr. C. Mader (Int. Tsunami
Society) for making available the last version of SWAN model and suggestions for modeling and Dr. J. Shepherd (University Of West Indies) for the historical information and comments on data on the West Indies. This work was partially funded by PDCTM/P/MAR/15264/1999 MATESPRO project from the Por-tuguese Science and Technology Foundation. Istituto Geologia Ma-rina contribution No. 1322.
References
Abe, K.: Size of great earthquakes of 1837–1974 inferred from tsunami data, J. Geophys. Res., 84, 1561–1568, 1979.
Arq. Min. Reino: Arquivos do Minist´erio do Reino: Inqu´erito do Marquˆes de Pombal, Mac¸o n◦638, Arquivo Nacional da Torre do Tombo, Lisboa, Portugal, 1756.
Baptista, M. A.: G´enese, Propagac¸˜ao e Impacto de Tsunamis na Costa Portuguesa, PhD thesis, University of Lisbon, 1998. Baptista, M. A., Heitor, S., and Mendes Victor, L.: The 1755 Lisbon
tsunami; Evaluation of the tsunami parameters, J. of Geodynam-ics, 25, n◦2, 143–157, Pergamon Press, 1998.
Baptista, M. A., Miranda, P. M., Miranda, J. M., and Mendes Victor, L.: Constrains on the source of the 1755 Lisbon tsunami inferred from numerical modelling of historical data. J. of Geodynamics, 25, n◦2, 159–174, Pergamon Press, 1998.
Baptista, M. A. and Miranda, J. M.: The Attenuation Laws for the 1755 Lisbon earthquake and its consequences for seismic haz-ard evaluation in Portugal. Abstracts of the IAGA-IASPEI Joint Scientific Assembly, Hanoi, Vietnam, 2001.
Baptista, M. A., Miranda, J. M., Matias, L., Ribeiro, A., and BIGSETS Team: The Thrust of Marquˆes de Pombal, a possible source of the 1755 Lisbon tsunami, XXVII Assembly of the Eu-ropean Seismological Commission, Lisbon, 10–15 September, 2000.
Borlase: Philos. Trans. Of the Royal Soc. of London, vol. XLIX, part II, 668–670, 1756.
Fukao, Y.: Thrust Faulting at a Lithosphere Plate Boundary – The Portugal Earthquake of 1969, Earth and Planet. Science Letters, 18, 205–216. 1973.
Gjevik, B., Pederson, G., Dybesland, E., Miranda, P. M., Baptista, M. A., Heinrich, P., and Massinon, B.: Modelling tsunamis from earthquake sources near Gorringe Bank southwest of Portugal, J. Geophys. Res., 102, C13, 27 931–27 949, 1997.
Heinrich, Ph., Baptista M. A., and Miranda, P.: Numerical simula-tion of 1969 tsunami along the Portuguese Coasts, Preliminary results, Sc. Tsunami Hazards, 12, 1, 1994.
340 New study of the 1755 earthquake source Huxham: Philos. Trans. Of the Royal Soc. of London, vol. XLIX,
part II, 668–670, 1756.
Johnston, A. C.: Seismic moment assessment of earthquakes in stable continental regions – III, New Madrid 1811–1812, Charleston 1886 and Lisbon, 1755, Geophys. J. Int., 126, 314– 344. 1996.
Lander, J. F. and Lockridge, P. A.: United States tsunamis (includ-ing US possessions) 1690–1988, Boulder: National Geophysical Data Center, 1989.
Lander, J. F., Whiteside, L. S., and Lockridge, P. A.: Brief history of Tsunamis in the Caribbean Sea. Sc. Of Tsunami Hazards, 20, 2, 57–94, 2002.
Levret, A.: The effects of the November 1, 1755 Lisbon Earthquake in Morocco, Tectonophysics, 193, 83–94, 1991.
Mader, C.: Numerical modelling of water waves, Los Alamos Se-ries in Basic and Applied Sciences, 206, 1988.
Mader, C.: Modelling the 1755 Lisbon tsunami, Sc. of Tsunami Hazards, 19, 93–116. 2001.
Mansinha, L. and Smylie, D. E.: The Displacement Field of In-clined Faults, BSSA, 61, 1433–1440, 1971.
Martinez Solares, J. M., Lopez Arroyo, A., and Mezcua, J.: Isoseis-mal map of the 1755 Lisbon Earthquake obtained from Spanish data, Tectonophysics, 56–3, 301–313, 1979.
Mendonc¸a, J. M.: Hist´oria Universal dos Terramotos que tem havido no mundo de que ha noticia, desde a sua creac¸˜ao at´e ao s´eculo presente, 255, Biblioteca Nacional de Lisboa, Portugal, 1758.
Pereira de Sousa, F. L.: O terramoto do 1◦ de Novembro de 1755 em Portugal, um estudo demogr´afico, vols. I e II. Servic¸os
Geol´ogicos de Portugal, 1919.
Richter, C. F.: Elementary Sismology, W. H. Freeman & Co., San Francisco, CA, 1958.
Sartori, R., Torelli, L., Zitellini, N., Peis, D., and Lodolo, E.: The eastern segment of the Azores-Gibraltar Line (Central-Eastern Atlantic): an oceanic plate boundary with diffuse compressional deformations, Geology, 22, 555–559, 1994.
Shepherd, J. B.: Tsunami Hazard in the Caribbean. Workshop on volcanic and seismic hazards in the eastern Caribbean, 28 May– 1 June 2001.
Smith, W. H. F. and Sandwell, D. T.: Global seafloor topography from satellite altimetry and ship depth soundings, Science, 277, 1957–1962, 26 September 1997, Suppl. to the Gentleman’s Mag-azine, 587–594, 1755.
Watson: Philos. Trans. Of the Royal Soc. of London, vol. XLIX, part II, pp 660–670, for the year 1756.
Wells, D. L. and Coppersmith, K. J.: New Empirical Relationships among magnitude, rupture area and surface displacement, Bull. Seism. Soc. of America, 84, 4, 974–1002. 1994.
Zitellini, N., Chierici, F., Sartori, R., and Torelli, L.: The tectonic source of the 1755 Lisbon Earthquake, Annali di Geofisica, 42, 1, 49–55. 1999.
Zitellini, N., Mendes Victor, L. A., Cordoba, J. D., et al.: Source of 1755 Lisbon Earthquake and tsunami Investigated, EOS, 82, 26, 2001.
Zitellini, N., Rovere, M., Terrinha, P., Matias, L., and Bigsets Team: (d) Neogene through Quaternary tectonic reactivation of SW Iberian massive margin, Special Issue of Pageof on “Azores-Tunisia Geodynamics”, accepted for publication, 2003.