HAL Id: hal-00301168
https://hal.archives-ouvertes.fr/hal-00301168
Submitted on 19 Mar 2004HAL is a multi-disciplinary open access
archive for the deposit and dissemination of sci-entific research documents, whether they are pub-lished or not. The documents may come from teaching and research institutions in France or abroad, or from public or private research centers.
L’archive ouverte pluridisciplinaire HAL, est destinée au dépôt et à la diffusion de documents scientifiques de niveau recherche, publiés ou non, émanant des établissements d’enseignement et de recherche français ou étrangers, des laboratoires publics ou privés.
Circumpolar transport and air-surface exchange of
atmospheric mercury at Ny-Ålesund (79° N), Svalbard,
spring 2002
J. Sommar, I. Wängberg, T. Berg, K. Gårdfeldt, J. Munthe, A. Richter, A.
Urba, F. Wittrock, W. H. Schroeder
To cite this version:
J. Sommar, I. Wängberg, T. Berg, K. Gårdfeldt, J. Munthe, et al.. Circumpolar transport and air-surface exchange of atmospheric mercury at Ny-Ålesund (79° N), Svalbard, spring 2002. Atmospheric Chemistry and Physics Discussions, European Geosciences Union, 2004, 4 (2), pp.1727-1771. �hal-00301168�
ACPD
4, 1727–1771, 2004 Circumpolar transport and air-surface exchange of atmospheric mercury J. Sommar et al. Title Page Abstract Introduction Conclusions References Tables Figures J I J I Back Close Full Screen / EscPrint Version Interactive Discussion
Atmos. Chem. Phys. Discuss., 4, 1727–1771, 2004 www.atmos-chem-phys.org/acpd/4/1727/
SRef-ID: 1680-7375/acpd/2004-4-1727 © European Geosciences Union 2004
Atmospheric Chemistry and Physics Discussions
Circumpolar transport and air-surface
exchange of atmospheric mercury at
Ny- ˚
Alesund (79
◦
N), Svalbard, spring 2002
J. Sommar1, I. W ¨angberg2, T. Berg3, K. G ˚ardfeldt1, J. Munthe2, A. Richter4, A. Urba5, F. Wittrock4, and W. H. Schroeder6
1
Department of Chemistry, G ¨oteborg University, Kemiv ¨agen 4, 41296 G ¨oteborg, Sweden
2
IVL Swedish Environmental Research Institute, P.O. Box 47086, 40258 G ¨oteborg, Sweden
3
Norwegian Institute for Air Research (NILU), P.O. Box 100, 2027 Kjeller, Norway
4
Institute of Environmental Physics, University of Bremen, NW1, Otto-Hahn-Allee 1, 28359 Bremen, Germany
5
Ecological Spectroscopy Laboratory, Institute of Physics, Gostauto 12, 2600 Vilnius, Lithuania
6Environmental Canada: Meteorological Service of Canada, 4905 Dufferin Street, Toronto,
Canada
Received: 27 October 2003 – Accepted: 3 March 2004 – Published: 19 March 2004 Correspondence to: J. Sommar (sommar@chem.gu.se)
ACPD
4, 1727–1771, 2004 Circumpolar transport and air-surface exchange of atmospheric mercury J. Sommar et al. Title Page Abstract Introduction Conclusions References Tables Figures J I J I Back Close Full Screen / EscPrint Version Interactive Discussion
Abstract
Mercury in different environmental compartments has been measured at Ny- ˚Alesund (78◦540N, 11◦530E) during an intensive campaign, 17 April to 14 May 2002. Time-resolved speciated determination of mercury in the atmosphere and snow was con-ducted at the Norwegian research station at the Zeppelin mountain, 474 m above the
5
sea level, and at the Italian research facility Dirigibile Italia, 12 m above the sea level. Total Gaseous Mercury (TGM) was present in the range <0.1 to 2.2 ng m−3during the campaign. Three mercury depletion events, identified as periods with decreased TGM concentrations, were observed. At the lower altitude, TGM concentrations following such events were found to exhibit both higher magnitude and larger variability in
com-10
parison to results from the Zeppelin station. Oxidised mercury species in air and fall-out with snow as well as mercury attached to particles were also measured and their con-centrations were found to be anti-correlated with TGM in air. The strongest modulation was observed for total mercury concentration (Hg-tot) in snow (range 1.5–76.5 ng L−1). Solid evidence for photo-stimulated emissions of Hg0(g) from the snow pack in
conjunc-15
tion to depletion events were obtained from gradient measurements as well as from flux chamber measurements. Steep diurnal concentration variations of Hg0(aq) in surface seawater were also found to concur with changing solar radiation. The concentration of Hg0(aq) in seawater was found to be in the range 12.2–70.4 pg L−1, which corre-sponds to supersaturation. Hence, the seawater surface constituted a source emitting
20
elemental mercury. The concentrations of the transient mercury forms RGM (Reactive Gaseous Mercury) and PM (Particulate Mercury) respectively and BrO column densi-ties detected using a zenith and off-axis sky viewing DOAS instrument were very low except for a few individual samples during the major depletion event. An evaluation of trajectories for selected events and comparisons with BrO vertical column densities
25
obtained by the GOME (Global Ozone Monitoring Experiment) instrument aboard the earth remote sensing satellite ESR-2 indicates that the air masses exhibiting low Hg0 concentrations originated from areas with high BrO densities. It was concluded that the
ACPD
4, 1727–1771, 2004 Circumpolar transport and air-surface exchange of atmospheric mercury J. Sommar et al. Title Page Abstract Introduction Conclusions References Tables Figures J I J I Back Close Full Screen / EscPrint Version Interactive Discussion
observed depletion events at Ny- ˚Alesund were a results of transport from areas with high photochemical activity around the polar region.
1. Introduction
Among the metals emitted to the atmosphere from natural, industrial and combustion processes, highly toxic mercury is unique as being mainly released in its gaseous
5
elemental state (Hereafter, assigned Hg0(g) or Gaseous Elemental Mercury, GEM). The semi-volatility of other environmentally relevant mercury compounds (e.g. HgCl2, CH3HgCl) further underlines the atmophilic character of mercury. The latter oxidative state of mercury (e.g. mercuric compounds alternatively denoted HgII) has moderate residence times and a higher affinity to condensed phases. The apparently passive
10
pollutant Hg0(g) is distributed on a global scale, exhibiting intra-hemispherical and ver-tical uniformity with a gradient of ∼25% over the inter-hemispherical convergence zone (Schroeder and Munthe, 1998). Monitoring of mercury at global atmospheric watch mid-latitude stations does not currently reveal any consistent trend in tropospheric mer-cury load and a weak seasonality (Munthe and Palm, 2003). The seasonal cycle of
15
boundary-layer airborne mercury in Polar Regions is however distinctly different from that observed at mid-latitude background sites (Ebinghaus et al., 2002) which has led to a considerable interest during the last 5 years. As tropospheric transport is a major channel for the distribution of mercury (Brosset, 1982; Lindqvist and Rodhe, 1985), the high level of mercury contamination present in the Arctic environment suggests
20
an enhanced atmospheric sink strength here (e.g. due to the depositional mechanism and/or by the fractional composition of airborne mercury). The possibility that mer-cury undergoes “global distillation” (Goldberg, 1975) was suggested by Lantzy and MacKenzie (1979) and was further investigated by Mackay et al. (1995). For mer-cury, temperature-driven processes have however been suggested to be less important
25
(Lindberg et al., 2002).
ACPD
4, 1727–1771, 2004 Circumpolar transport and air-surface exchange of atmospheric mercury J. Sommar et al. Title Page Abstract Introduction Conclusions References Tables Figures J I J I Back Close Full Screen / EscPrint Version Interactive Discussion
during and after polar sunrise (Barrie et al., 1988). These events cannot be explained by changing meteorology alone and occur when the atmosphere is in a chemically perturbed condition. The main chemical mechanism of the ODEs is believed to be a halogen-catalysed process. Volatile Br(I) species can be absorbed by fresh, partly frozen sea salt particles at low temperature (<253 K) more efficiently than to
aque-5
ous droplets. Ensuing are hydrolytic dark reactions such as hypobrominous-halide disproportionation to volatile diatomic elemental or inter-halogens, which can undergo photo dissociation (Adams et al., 2002). Formation of Br2is normally prevalent for rea-sons of thermo-chemical equilibria (Air-water distribution and aqueous complexation) and furthermore its actinic absorption extends out to longer wavelengths than Cl2and
10
BrCl. The relative importance of the Br2photo-dissociation channel for the production of free halogen atoms is thus increased at high solar zenith angles. The multi-phase environment required for a “bromine explosion” (Ravishankara and Longfellow, 1999; Wennberg, 1999) suggests elevated concentrations especially close to relevant frozen surfaces, such as “frost flowers” (Rankin et al., 2002). Ozone is under such
circum-15
stances destroyed:
Br(g)+ O3(g) → BrO(g)+ O2(g) (1)
During daytime, the self-reaction BrO+ BrO is competitive to photolysis only at high BrO levels. The latter processes reform Br(g) with unity quantum yield while photolysis and possible cross reactions (e.g. BrO+ Aldehydes/HO2) to various extent produce
20
reservoir compounds. As long as ozone is not completely depleted, most Br atoms react with ozone sustaining the BrO level to a certain extent.
Simultaneously with the modulation of the atmospheric ozone content, many other trace substances, among these Hg0(g) vary considerably indicating the influence of reactive halogen species (Schroeder et al., 1998). Hg0 depletions (GEMDEs) cannot
25
be quantitatively explained by the action of atomic chlorine in the gas-phase even if the reaction rate is set at diffusion-controlled limit (Sommar, 2001). A recent determination of the Hg+Cl reaction yielded a rate of (1.0±0.2)×10−11cm3s−1 which corresponds to 10% of the diffusion controlled limit (Ariya et al., 2002). Concerning the reaction
ACPD
4, 1727–1771, 2004 Circumpolar transport and air-surface exchange of atmospheric mercury J. Sommar et al. Title Page Abstract Introduction Conclusions References Tables Figures J I J I Back Close Full Screen / EscPrint Version Interactive Discussion
Hg0(g)+BrO(g), H¨onninger (2002) estimated the lower limit for the reaction rate from field experiments to kHg+BrO≥3.7×10⁻¹⁴cm3s−1. Raofie and Ariya (2003) report further constraints on kHg+BrO≤1 ×10⁻¹³cm3s−1. Boudries and Bottenheim (2000) postulated from hydrocarbon “clock” measurements that BrO radicals (x=1) rather than bromine atoms (x=0) oxidise atomic mercury to form molecular mercury products according to
5
reaction (2).
Hg0(g)+ BrOx(g) → Products (2)
Assuming prompt formation of HgO(g), reaction (2, x=1) appears improbable using thermo-chemical arguments (Shepler and Peterson, 2003; Sommar, 2001; Tosell, 2003). However, insertion product complexes like HgBrO are strongly bound and
there-10
fore feasible products (Balabanov and Peterson, 2003). Based on relative rate deter-minations of the homogeneous gas-phase reaction between Hg0+Br the following rate coefficient, k=(3.2±0.5)×10−12cm3s−1 was obtained (Ariya et al., 2002) and the au-thors proposed that this reaction may explain Arctic GEMDEs. In Malcolm et al. (2003) typical oxidation rates of Hg0(g) in the MBL have been listed for a large number of
15
oxidants also including BrO and ClO using previously unpublished kinetic data from Batelle Inc. The importance of the Hg0(g)+ClO(g) reaction in the perturbed Polar at-mosphere and elsewhere suggested by Stutz et al. (2002) have less support in Malcolm et al. (2003). Likewise a theoretical prediction of the homogeneous rate coefficient for the reaction Hg0+ClO→HgO+Cl at elevated temperatures (400◦K<T<1800◦K; 1 atm)
20
by Xu et al. (2003) resulted in a relatively low value of ∼5×10⁻¹⁹cm3s−1at 273◦K (Ar-rhenius form: k∼2.29×10⁻¹² exp(−4183/T) cm3s−1). Hg0(g) is currently categorised into the families of compounds (e.g. C2H2and ozone) modulated by bromine species as a key oxidant during depletions (Bottenheim et al., 2002; Lindberg et al., 2002). Although exhibiting disparate physico-chemical properties, the uniform temporal
be-25
haviour of GEM and O3(g) in connection with depletions in the surface layer is striking. We are aware that during the Antarctic summer, a persistence in elevated concentra-tions of molecular divalent oxidative state mercury products in the gaseous phase
(usu-ACPD
4, 1727–1771, 2004 Circumpolar transport and air-surface exchange of atmospheric mercury J. Sommar et al. Title Page Abstract Introduction Conclusions References Tables Figures J I J I Back Close Full Screen / EscPrint Version Interactive Discussion
ally denoted RGM; for a discussion see Schroeder et al., 2003) has been reported and suggested to be controlled by HOx classes rather than reactive halogenated species (Sprovieri et al., 2002; Temme et al., 2003).
GEMDEs have been observed to occur annually often repetitively throughout mar-itime circumpolar stations: Alert, Ellesmere Island (Schroeder et al., 1998), Barrow,
5
Alaska (Lindberg et al., 2002), Nord, Greenland (Skov et al., 2002), Neumayer, Queen Maud’s Land (Ebinghaus et al., 2002), Ny- ˚Alesund, Spitzbergen (Berg et al., 2003), Terra Nova Bay, Victoria Land (Sprovieri et al., 2002) and apparently in the Siberian Arctic (Golubeva et al., 2003; Steffen and Schroeder, 2002). At sub-polar latitudes, H ¨onninger (2002) in co-laboration with Poissant and co-workers presents
measure-10
ments of GEMDEs at 55◦N surrounded by seawater ice in Hudson Bay. Stutz et al. (2002) propose that GEMDEs take place over saline dry lakes in mid-latitudes. The observations made throughout the Arctic and Antarctica suggest that GEMDEs occur over large spatial scales and can thus be considered as analogues to ozone holes.
The atmosphere-surface partitioning behaviour appears however to be more
com-15
plex possibly involving physico-chemical controls at the interface. While gradients of ozone are present in surface air/interstitial snow air suggesting a sink mechanism at the boundary between air, ice and water, a reversible red-ox balance may well be in control for mercury in snow which will strongly adjust its mobility. HgII deposited as a result of Hg0depletion events is chemically (photo)labile toward reduction in the snow, hence to
20
certain extent transformed into Hg0(aq) and ventilated to the atmosphere (Lalonde et al., 2002; Schroeder et al., 2003; Steffen et al., 2002). Moreover, GEMDEs correspond to short lived polar night ODEs that have been speculated to derive from local-driven chemistry (Foster et al., 2001). Since air-surface exchange and redox processes oc-curring in the condensed phase seem to be of prime importance, models describing
25
only gas-phase processes cannot be used to evaluate atmospheric mercury budgets over snow-covered surfaces.
Being a high priority toxic element with diametrically opposite physico-chemical prop-erties of the environmentally relevant oxidative states (e.g. Hg0/HgII), efforts to estimate
ACPD
4, 1727–1771, 2004 Circumpolar transport and air-surface exchange of atmospheric mercury J. Sommar et al. Title Page Abstract Introduction Conclusions References Tables Figures J I J I Back Close Full Screen / EscPrint Version Interactive Discussion
its atmospheric mass balance (e.g. perform speciation/fractionation of airborne mer-cury in the field) during GEMDEs are of crucial importance. When comparing results of measurements of airborne mercury species during GEMDEs at different stations, it is evident that a closure of airborne mercury mass balance is not achieved. This is concordant with the strong tendency of RGM or mercury attached to existing particles
5
(PM) to undergo physical removal during transport. In terms of quantity and composi-tion, the transient mercury groups discussed above tend in Hg0(g)-depleted air masses to be site specific (Lindberg et al., 2002; Lu et al., 2003; Steffen et al., 2002; Temme et al., 2003). In some cases, the air masses are almost truly free from mercury while frequently the transient products are detected at elevated mixing ratios composing up
10
to ∼90% of the Total Gaseous Mercury (hereafter abridged TGM, for a definition see below) load present in background air.
In this paper, we report and discuss results from the Norwegian high Arctic. The research area at Ny- ˚Alesund is located about 1300 km from the North Pole (cf. Fig. 1) and was established for long-term monitoring of airborne mercury in 1994. In 2000
15
high-time resolution measurement were started that allowed the identification of mer-cury depletion events (Berg et al., 2001; Berg et al., 2003). In addition, sampling of mercury in various other environmental compartments has been undertaken (Berg et al., 2001). Pongratz and Heumann (1998) have performed studies of the methy-lated mercury species (e.g. monomethylmercury, CH3HgX: hereafter Methyl-Hg and
20
dimethylmercury: (CH3)2Hg) produced in the sea by different macro algae. They pro-posed that biogenic very toxic (CH3)2Hg can be released from the sea surface and contribute to the polar atmospheric load of mercury (Pongratz and Heumann, 1999). Observations of important ozone destruction halogen catalysts XO over this location have been made during ODEs since 1995 for a series of consecutive years (X=Cl; e.g.
25
Tuckermann et al., 1997; X=Br; e.g. M¨uller et al., 2002; X=I, e.g. Wittrock et al., 2000) in the range up to a few ten ppt. ODEs at Ny- ˚Alesund coincide with elevated mixing ratios of XO essentially only for X=Br. The role of X=Cl is much less clear and X=I apparently lacking correlation. The corresponding integrated concentrations of atomic
ACPD
4, 1727–1771, 2004 Circumpolar transport and air-surface exchange of atmospheric mercury J. Sommar et al. Title Page Abstract Introduction Conclusions References Tables Figures J I J I Back Close Full Screen / EscPrint Version Interactive Discussion
halogens have been estimated during ODEs (Cl∼1010s cm−3 and Br∼1012s cm−3) us-ing hydrocarbon “clock” measurements (Ramacher et al., 1999; Solberg et al., 1996). In a recent historical survey of the temporal and spatial occurrence of ODEs, Tarasick and Bottenheim (2002) report the incidence of ODEs an order of magnitude lower at Ny- ˚Alesund (together with e.g. Neumayer) compared to Alert. It has been suggested
5
that the relative low frequency of ODEs at Ny- ˚Alesund is to some extent related to its local topography and the presence of open oceanic water (Lorenzen-Schmidt et al., 1998).
The purpose of this study was to provide further quantitative information on mercury in different environmental compartments including air, snow and seawater during polar
10
spring and extend the database of GEMDEs. To contribute to the knowledge, we have conducted time-resolved speciated determination of mercury in the atmosphere and snow at two altitudes. At the sea level, we focused on collecting data for gas-transfer calculations over snow and sea surfaces. In addition, this paper includes an analysis of meteorological and BrO data obtained by using multiple remote platforms
(ground-15
based as well as satellite-based) and an assessment of how these factors influence the evolution of signatures in various samples collected during the campaign. Informa-tion needs/data gaps recognized at the first internaInforma-tional Arctic atmospheric mercury research workshop 26–28 August 2002 will be addressed and discussed (Schroeder et al., 2003).
20
2. Experimental section
2.1. Sampling location
Experiments were performed during an intensive campaign (17 April to 14 May 2002) in the presence of 24-h daylight at three locations within the Ny- ˚Alesund International Research and Monitoring Facility. This establishment (78.9◦N, 11.9◦E) is situated at
25
ACPD
4, 1727–1771, 2004 Circumpolar transport and air-surface exchange of atmospheric mercury J. Sommar et al. Title Page Abstract Introduction Conclusions References Tables Figures J I J I Back Close Full Screen / EscPrint Version Interactive Discussion
high Arctic (Fig. 1) and is partly surrounded by mountains with peaks of 1000–1500 m altitude. It is situated about 15 km from the northern-most Barents Sea. An offshoot of the waning Gulf Current (West Spitzbergen current) causes ice-free conditions along the west coast of Spitzbergen during the entire year. Sea ice was in-turn dominant north of a border approximately demarcated by latitude ∼80◦N and longitude ∼10◦E
5
(Fig. 1). When covered by ice, the local climate is however modulated to be more continental by the adjacent fjord. In connection with low-lying cloud cover, the presence of distant open water was discernible by noticeably darker skies over water. General large-scale circulation is steered by the Iceland low and the high-pressure systems over Greenland and the Arctic Ocean, forcing warm and humid air from the North
10
Atlantic ocean along cyclone tracks to the Barents sea. The large differences in air temperature between air masses of Arctic or Atlantic origin cause large fluctuation in weather conditions at Ny- ˚Alesund. Positive phases of the North Atlantic and Arctic oscillations have recently created warming anomalies of circumpolar continental areas that partly are compensated by cooling over the northern North Atlantic. An overall
15
descending tendency in the thickness and area extent of sea-ice is observed e.g. in the Arctic Ocean’s Atlantic layer. Owing to positive feedbacks, greenhouse warming has been proposed to be amplified in the Arctic yielding seasonally increased precipitation. Samples of airborne mercury and mercury in snow were taken at the Global At-mospheric Watch monitoring observatory operated by the Norwegian Institute for Air
20
Research (NILU) at Zeppelinfjellet (474-m a.s.l). From the Zeppelin mountain Station (ZS, 78◦5404200N, 11◦5503000E), there is a steep downhill slope to the north towards the settlement situated at 2-km distance. South of ZS is also a slope whereas there are higher mountain peaks in the east and west. This channels the local wind into either of the upslope directions, north-northwest and south-southeast (Beine et al., 2001).
25
The station is typically positioned well above frequent ground inversion of the fjord val-ley (Braathen et al., 1990). Air and snow sampling were also carried out downhill at 12-m a.s.l close to the Italian Consiglio Nazionale delle Ricerche (CNR) Base Arctica “Dirigibile Italia” (DI). The air sampling at this location comprised vertical gradient
mea-ACPD
4, 1727–1771, 2004 Circumpolar transport and air-surface exchange of atmospheric mercury J. Sommar et al. Title Page Abstract Introduction Conclusions References Tables Figures J I J I Back Close Full Screen / EscPrint Version Interactive Discussion
surements at two heights and flux chamber measurements on the snow surface. The extensive snow pack in the experimental area is seasonal (usually melted by end of June) and has maritime characterisation with numerous layers of aged snow. Surface seawater samples were collected in Kongfjorden close to or offshore the settlement when manageable by jolly boat.
5
2.1.1. Sampling and analytical protocols 2.1.2. Airborne mercury
Ambient TGM
Ambient air point samples were collected and analysed with automised
instru-10
ments. In addition to the stationary Tekran (Model 2537A) gas-phase mercury vapour analyser at Zeppelin, two other Tekran (Model 2537A) instruments were employed to measure TGM. The abbreviation TGM refers to gaseous elemental mercury (GEM) and small contributions of other gaseous mercury species (<1% at ambient conditions) that may pass through the sampling line and be detected as Hg0 (Schroeder et al.,
15
1995; Temme et al., 2003). The TGM measurements were made according to the well-established method with a 0.45 µm front particle filter. The stationary instrument was also equipped with a heated sampling line.
Prior to moving to other sampling sites the instruments were calibrated using manual injections of known amounts of Hg0(g) from a Tekran 2505 mercury vapour
20
source. The nominal settings of each Tekran’s internal permeation tube were verified within a few %. The internal calibration systems were further used on a daily basis for calibration during the campaign. The instruments were operated in continuous mode at 1.5 L min−1 sample flow rate and with 5 min sampling intervals. The detector response to standards automatically invoked from the internal permeation source showed a
25
high degree of stability from calibration to calibration. Succeeding this exercise, the instruments were in-turn intercalibrated for ambient air with their respective inlet tubes
ACPD
4, 1727–1771, 2004 Circumpolar transport and air-surface exchange of atmospheric mercury J. Sommar et al. Title Page Abstract Introduction Conclusions References Tables Figures J I J I Back Close Full Screen / EscPrint Version Interactive Discussion
during ∼40 h, spanning over a concentration range from <0.1 ng m−3 to ambient background.
Transient mercury fractions RGM and PM
5
RGM and PM were sampled by collection on KCl-coated denuders (Landis et al., 2002; W ¨angberg et al., 2003a; Xiao et al., 1997) and on filters (Berg et al., 2001; W ¨angberg et al., 2003b), respectively. An automated unit using sequential sampling of RGM and fine PM (nominal cut-off 3 µm, f-PM) was mounted on the roof of the Zeppelin station ∼2 m above ground and connected through a heated line to a Tekran
10
2357A analyser. The transient mercury forms were concentrated and analysed with 1.5-hour time step after thermal conversion to Hg0(g), enabling separate quantification after transfer to the Tekran instrument. The temperatures and flows through the sampling components in quartz were controlled by a set of furnaces, pumps and fans programmed by a Set point Programmer. The programme was triggered by a
15
signal from a Tekran 1120 Standard Addition Controller. Special attention was payed the reduction of the partitioning of mercury to the walls of the sampling inlet (Ariya et al., 2002; Landis et al., 2002; Sommar et al., 1997) by treating the surfaces with a perhalogenated carbon product. Based on 3σ of the sample blank, the Detection Limit (DL) of RGM and f-PM was estimated to be ∼2 and ∼5 pg m−3, respectively.
20
The fraction of f-PM was typically below the DL and this result will not further be commented. Manual denuders for RGM sampling with lower time resolution were also used. Two manual denuders were used in parallel. The denuders were contained in protective housings thermostatted to 40◦C during sampling. The two sampling systems were identical except that one of the samplers was equipped with Teflon grid
25
inlet. Manual RGM sampling was conducted at ZS in the beginning of the campaign and later moved to DI. Total PM (TPM) was collected at ZS using glass fibre filters according to Berg et al. (2001). Each filter sample was exposed during 1–3 days. All concentrations given are dimensioned to resemble mass of Hg0m−3 at STP (0◦C and
ACPD
4, 1727–1771, 2004 Circumpolar transport and air-surface exchange of atmospheric mercury J. Sommar et al. Title Page Abstract Introduction Conclusions References Tables Figures J I J I Back Close Full Screen / EscPrint Version Interactive Discussion
1013 hPa). Time reported is in UTC (Co-ordinated Universal Time). 2.1.3. Tropospheric BrO
Daily averaged BrO Vertical Column Densities obtained from the GOME instrument were used to interpret the mercury observations. The GOME is a UV/VIS double monochromator spectrometer with a spectral range of 240–793 nm and a resolution
5
of 0.2 nm (λ<400 nm) and 0.4 nm (λ>400 nm), respectively. The instrument operates onboard ERS-2, which is on a sun-synchronous orbit since April 1995 (Burrows et al., 1999). BrO columns are retrieved from the measured radiances using the well-known Differential Optical Absorption Spectroscopy (DOAS) technique. Details on the BrO re-trieval can be found in Richter et al. (1998). Ground-based zenith sky UV/VIS – DOAS
10
measurements are also continuously performed at Ny- ˚Alesund (Wittrock et al., 1996). Since March 2002, the instrument has been upgraded to observe not only the zenith-sky, but also directions close to the horizon. By combining zenith-sky and horizon measurements, some information on the vertical distribution can be retrieved, and the sensitivity to boundary layer BrO explosions is much enhanced (Wittrock et al., 2003).
15
Unfortunately, the instrument was not operational on 22 April, thereby missing part of the large depletion event observed during the campaign.
2.1.4. Mercury in snow
Surface-snow samples were collected on a daily basis and brought indoors where they were allowed to melt into acid cleaned 125 ml volume Teflon bottles. Each sample was
20
preserved by adding 0.5 ml HCl (Merck, Suprapur). All samples were analysed for total mercury (Hg-tot; Bloom and Crecelius, 1983) and a few for methyl-Hg (Lee et al., 1994) 2.1.5. Mercury in seawater
Surface seawater samples from Kongsfjorden were collected from a small boat or from a landing using an acid cleaned Teflon bottle of 1.3 L volume. The bottle consisted
ACPD
4, 1727–1771, 2004 Circumpolar transport and air-surface exchange of atmospheric mercury J. Sommar et al. Title Page Abstract Introduction Conclusions References Tables Figures J I J I Back Close Full Screen / EscPrint Version Interactive Discussion
of a 1.0 m long tube with 4 cm inner diameter. The container was equipped with a glass frit in the bottom and had two functions, both sample collector and impinger. Each water sample was immediately transported to the nearby laboratory where 0.5 L of the sample was extracted for Dissolved Gaseous Mercury (hereafter denoted: DGM ≈Hg0(aq)) during 60 min using purified inert gas (0.3 L min−1). The extracted elemental
5
mercury was collected on an Au-trap connected to the outlet at the top of the tube. The Au-trap was heated to 40◦C to avoid condensation of moisture. The Au traps were analysed using the standard dual amalgamation and CVAFS detection technique. Detailed information about the procedure, its efficiency and reproducibility is found in G ˚ardfeldt et al. (2002).
10
In some cases part of the seawater were transferred into 125 ml volume acid cleaned Teflon bottles before DGM extraction. The samples were preserved with HCl (see Sect. 2.2.3.) and transferred to IVL in Sweden for analysis of Hg-tot.
2.1.6. Methods for mercury flux estimations Gas-exchange model
15
A gas-exchange model (Wanninkhof, 1992) was used to estimate mercury eva-sion fluxes from the sea. The model requires TGM and DGM concentrations and water temperature and wind speed as the input parameters. Further parameterisation was made following the principles reported in G ˚ardfeldt et al. (2003).
20
Vertical gradient measurements and flux chamber measurements of TGM
Vertical gradient concentration measurements of TGM were performed at 20 and 180 cm above the snow surface. A teflonised three-way magnetic valve synchronised
25
with the instrument’s preconcentration cycle was used enabling periodic alternate sampling from each level with a Tekran 2537A instrument.
gra-ACPD
4, 1727–1771, 2004 Circumpolar transport and air-surface exchange of atmospheric mercury J. Sommar et al. Title Page Abstract Introduction Conclusions References Tables Figures J I J I Back Close Full Screen / EscPrint Version Interactive Discussion
dient measurements. The dynamic flux chamber (DFC) was made of FEP Teflon after a prototype from Oak Ridge National Laboratories (Kim and Lindberg, 1995). An exter-nal aluminium frame supported the rectangular, open-bottom chamber 60×20×20 cm3. The flux was estimated using Eq. (3):
F=Qx(Cout−Cin)/A (3)
5
where Q is the total airflow rate pulled trough the chamber by means of a pump con-nected to the chamber wall. The inlet air enters 20 cm above the snow surface trough a port opposite to the pump side of the chamber. A is the snow surface covered by the chamber. Cout and Ci n corresponds to the Hg concentration leaving and entering into the chamber, respectively. These two concentrations were measured in sequence
10
using one Tekran 2537A operating in continuous mode with sampling intervals of 5 minutes. The measurements were initiated by a blank check where the chamber was placed on a FEP Teflon film. After some time when sufficiently low Cout-Ci n values were obtained the measurement was started by putting the chamber on a flat snow plot. The blank procedure was repeated twice during the measurements after which
15
the chamber was relocated on a fresh snow surface. The temperature in the ambient surface snow as well as that within the DFC was probed with embedded thermocou-ples in the snow. The sensors were connected to a mini meteorological logger (Skye Datahog 2 type SDL 5360).
2.1.7. Meteorological parameters
20
Meteorological parameters and surface ozone at ZS were measured by NILU (ac-cessible via the Norwegian Institute for Air Research, seehttp://www.nilu.no/niluweb/
services/zeppelin/). Extensive sets of meteorological data collected adjacent to DI and vertical profiles of ozone and temperature above Ny- ˚Alesund were kindly provided by the German Alfred-Wegener Institute for Polar and Marine Research. The temporal
25
behaviour of TGM and ozone were investigated by calculating (∆[X]/∆t) ratios. Rela-tive removal rates were calculated using Eq. (4), where [X]1denotes the concentration
ACPD
4, 1727–1771, 2004 Circumpolar transport and air-surface exchange of atmospheric mercury J. Sommar et al. Title Page Abstract Introduction Conclusions References Tables Figures J I J I Back Close Full Screen / EscPrint Version Interactive Discussion of TGM at time t1etc. ∆ log[X] ∆t = log([X]2/[X]1) t2−t1 (4)
Back trajectories were obtained using the Hybrid single-particle lagrangian integrated trajectory (HYSPLIT) model. The calculations were made interactively using the FNL meteorological datasets, which is provided on the web by Air Resources Laboratory,
5
National Oceanic & Atmospheric Administration after permission (http://www.arl.noaa.
gov/ready/hysplit4.html). The stability of the back trajectories was verified by expanding the starting area or by calculating at different ending heights.
3. Results and discussion
3.1. Variability of local point ozone and local vertically resolved point TGM
observa-10
tions
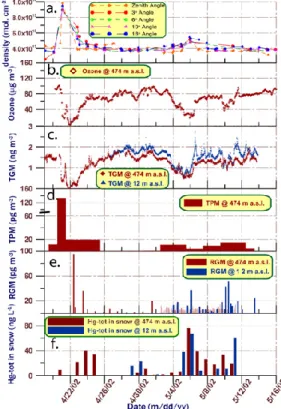
Time-series of TGM measured at two altitudes are shown in Fig. 2c. Two depletion events (GEMDEs) are clearly depicted. The first and major episode was only measured from ZS, while the following GEMDEs were sampled at both ZS and DI. TGM dropped to undetectable levels in the first and major event and below 0.5 and 0.9 ng m−3,
respec-15
tively, during two minor events. The major depletion is characterised by a very fast de-crease in TGM; within 24 h the concentration changed from ∼1.6 ng m−3to <10 pg m−3. It is obvious that there also exist other significant spike-dip-like features in the TGM record in-between depletions. During the period between the polar sunrise 2002 and the start of the campaign, no major GEMDE was recorded with the stationary
instru-20
ment at Zeppelinfjellet. As shown in Fig. 3a, the corresponding probability distribution of TGM is strongly left-skewed by events of low GEM influencing the arithmetical mean concentration (1.15 ng m−3). The annual TGM mean at the site is 1.4–1.5 ng m−3 as
ACPD
4, 1727–1771, 2004 Circumpolar transport and air-surface exchange of atmospheric mercury J. Sommar et al. Title Page Abstract Introduction Conclusions References Tables Figures J I J I Back Close Full Screen / EscPrint Version Interactive Discussion
derived from measurements made during recent years (Berg et al., 2001; Berg et al., 2003).
In addition to TGM, ozone was also measured at ZS. The complete ozone concentration-time series is shown in Fig. 2b while Fig. 4a displays the data confined to the major ODEs. The TGM and ozone data sets were compared as 709 paired
5
hourly mean values. They were found to be correlated with maximum positive cross-correlation (R>0.9) for a time lag of <1 h. For ambient air data measured by two au-tonomous instruments, the correlation is very high, but a similar resemblance has been obtained at other polar sites (Schroeder et al., 1997; Temme et al., 2003). By solely including the depletion periods even higher positive 1-h correlation coefficient was
ob-10
tained (R∼0.98). The Zeppelin station is situated over or at least at the top of the marine boundary layer. The time series of the TGM measurements at 12 m a.s.l. and 474 m a.s.l. are altogether highly correlated as one can anticipate. Conversely to invariant gradients generally observed during GEMDE’s, considerable concentration difference between the stations was often observed successive to depletions (Fig. 2c). During
15
the period 6–8 May the TGM values at DI exhibit a more than fivefold higher variance in comparison to that of ZS. The substantially larger variability in TGM data from DI is illustrated in Fig. 3, where the diurnal variation in TGM at DI and ZS is depicted in a Box and Whiskers diagram. The mean, the upper and lower 95% confidence intervals and extremes are shown for 15 min per bin diurnally integrated samples. The assembled
20
data for DI shows a further distinct maximum around noon, which is influenced by a few days of TGM concentration peaks well above 2.0 ng m−3. Usually no time lag in the concentration variations was monitored. However during the observed depletions, the recovery phase appear to start earlier at the sea level. The vertical spatial gradient in TGM and its temporal development is likely to be due to re-emission of mercury from
25
the snow surface, an effect that is enhanced by restricted mixing of air on a microm-eteorological scale. Similar seasonal and altitudinal ozone measurements have been performed by Lorenzen-Schmidt et al. (1998). In contrast to TGM, there is no evidence for emission from the snow-pack to the atmosphere concerning ozone.
ACPD
4, 1727–1771, 2004 Circumpolar transport and air-surface exchange of atmospheric mercury J. Sommar et al. Title Page Abstract Introduction Conclusions References Tables Figures J I J I Back Close Full Screen / EscPrint Version Interactive Discussion
3.2. Compositional change of mercury during and after incidence of GEM depletions 3.2.1. Airborne transient mercury fractions
Concentration-time series of RGM at two altitudes and TPM at ZS are shown in Fig. 2e and d, respectively. The concentrations measured were in the range <2–95 pg m−3 for RGM and <1–140 pg m−3for TPM. Except for a few samples during GEMDEs the
con-5
centrations of these fractions generally were very low (median mixing ratios present in the sub-ppq (parts-per 1015)). The highest values were measured in connection to the first depletion. The sum of RGM and TPM corresponds to 16% of the TGM loss inferred. During GEMDEs year 2000, elevated levels of RGM and TPM also were observed in ozone-depleted air masses received at ZS. The corresponding
concen-10
trations extended to 12 and 47 pg m−3, respectively, but corresponded only to up to a few percent of TGM normally present in ambient air. The previous measurements also showed that RGM and TPM generally are low at ZS with concentrations often below 10 pg m−3(Berg et al., 2001; Berg et al., 2003; Lu et al., 2003).
Within the week of 6 to 12 May, during the two minor GEM depletion events, matching
15
RGM measurements at two altitudes were undertaken. The RGM measured at the higher altitude showed a modest variability around typical background concentrations while the parallel variance was significantly (F-test, P <0.01) larger at DI and the anti-correlation with TGM during GEMDEs more substantial.
3.2.2. Mercury in snow and seawater
20
The result from mercury analysis of snow samples, collected at two altitudes (ZS and DI), is shown in Fig. 2f. While Methyl-Hg was consistently undetectable (<0.06 ng L−1) during the period, time series of total mercury (Hg-tot) presents a moderate maximum during the major GEMDE and becomes highly episodic during the minor events with peaks as high as 77 ng L−1. The strong peaks during the period 5 to 11 May are related
25
ACPD
4, 1727–1771, 2004 Circumpolar transport and air-surface exchange of atmospheric mercury J. Sommar et al. Title Page Abstract Introduction Conclusions References Tables Figures J I J I Back Close Full Screen / EscPrint Version Interactive Discussion
in conjunction to snowfall, which started in the late afternoon of 5 May. Two snow samples were collected that day, as shown in Fig. 2f. The ZS sample was collected before the snowfall started and contained small amounts of mercury. The DI sample was collected approximately one hour after the snowfall started and contained high amounts of mercury (∼15-fold increase). Hence, this observation clearly indicates that
5
the mercury arrived with the snow.
Some surface water samples from Kongsfjorden were collected during May 10-11 and analysed for Hg-tot. Quite high Hg-tot arithmetic mean concentrations were de-termined (2.1±1.5 (1σ) ng L−1, n=5). This value can be compared with 0.8 ng L−1 as reported as the corresponding mean for filtered water samples (0.45 µm pore size)
10
collected at the same site during summer (Pongratz and Heumann, 1998). It is likely that the high concentrations observed here are due to deposition of snow enriched in mercury originating from GEMDEs. Only a few other Hg-tot data for Arctic waters have been published (Coquery et al., 1995, “Arctic coastal waters of northern Siberia”).
Surface water samples for analysis of dissolved gaseous mercury (DGM) were also
15
collected at Kongsfjorden. Time series of the DGM concentration during 8–14 May is shown in Fig. 5. A strong diurnal concentration variation is displayed; ranging from 12 to 70 pg L−1. The variation in DGM is clearly linked to solar radiation, which sug-gests photolytic reduction of oxidised mercury species in the surface water. The DGM values correspond to a supersaturation of 40–480% as estimated using Henry’s Law
20
coefficients valid at low water temperatures (G˚ardfeldt et al., 2003). 3.2.3. Evasion of volatile mercury from snow and water surfaces
As discussed above in Sect. 3.1., the observations of diurnal patterns in the surface TGM concentration indicates a light-dependent evasional flux from condensed sur-faces. These processes were further investigated by flux measurements using the
25
DFC technique as well as vertical gradient measurements over snow plots outside DI. As shown in Fig. 6b, an accumulation of TGM was generally reached in the air passing through the DFC. This corresponds to mid-day peak emissions of up to 70 ng m−2h−1
ACPD
4, 1727–1771, 2004 Circumpolar transport and air-surface exchange of atmospheric mercury J. Sommar et al. Title Page Abstract Introduction Conclusions References Tables Figures J I J I Back Close Full Screen / EscPrint Version Interactive Discussion
as calculated from Eq. (3). Elevated fluxes were observed contiguous to enhanced deposition events during the two latter GEMDEs. The average DFC-flux obtained is ∼8 ng m−2h−1. It should be noted that blank tests and repositioning of the chamber was concurrent with periods of enhanced mercury deposition. As shown in Fig. 6, a discernable diurnal variation in snow surface temperature exists with temperature
max-5
imum during mid-day. When directly sunlit the DFC creates a greenhouse effect that strongly influences the enclosed surface’s temperature. Gillis and Miller (2000) and Wallschl ¨ager et al. (1999) have examined the feasibility of DFCs in order to measure mercury gas exchange and found it significantly biased by physical constraints such as turnover rates and the degree of exposure to ambient wind. In papers by Lindberg
10
and co-workers (Lindberg and Zhang, 2000; Zhang et al., 2002) it was established that a high-limit flux is attained when the enclosure is sufficiently ventilated. This limit steady-state is however not directly comparable either in time or in quantity with e.g. mi-crometeorological approaches. The highest emission rates are concurrent with surface snow temperatures inside the DFC around 0◦C indicating that reduction and emission
15
occurs mainly in melting snow. Thus, these results may not be significant for ambient snow temperatures (i.e. T<0◦C).
The vertical two level TGM measurements over snow at DI generally displayed very small concentration differences (<0.1–0.2 ng m−3) during the period of sampling (3–13 May). They were frequently insignificant if taking the instrumental precision into
con-20
sideration. Given the position of each intake, the invariant gradients are in accordance with results from Alert reported by (Steffen et al., 2002). However, during one event, solid evidence for photo-stimulated emissions of Hg0(g) from the snow pack was ob-tained. Results from this period are shown in Fig. 7. The TGM gradients represents 9 h following a snowfall during which a large increase in Hg-tot was observed in
con-25
secutive samples on May 5 and 6 (see Fig. 2d). The snow episode ended at ∼9:30 the 6 May and was followed by calm winds, a stable temperature at −10◦C and mostly overcast skies. During this period with low wind speeds (<1–3 m s−1 at 2 m above the ground) and strong pulses of short-wave direct solar radiation, a period of frequently
ACPD
4, 1727–1771, 2004 Circumpolar transport and air-surface exchange of atmospheric mercury J. Sommar et al. Title Page Abstract Introduction Conclusions References Tables Figures J I J I Back Close Full Screen / EscPrint Version Interactive Discussion
significant TGM vertical gradients were observed. Multiple reflections and scattering of shortwave radiation between the surface and the atmosphere enhances the solar flux over the high albedo surface (≥80%). Single TGM measurements yielded a difference of 30 to 50% between the lower and higher sampling heights. Rapid photo-induced pro-duction of GEM in the snow followed by gas-transfer from interstitial air to the overlying
5
air is thus implied.
The magnitude of the corresponding fluxes during the period was estimated by ap-plying a basic dispersion model (Olofsson et al., 2001). The upwind fetch of the gra-dient measurements, a snow-covered relatively flat plain without obstacles, was as-sumed to exhibit homogeneous source strength and surface properties. The
contribu-10
tion from sources at each level sampled (z1=1.8 m and z2=0.2 m) was described by the Gaussian plume dispersion equation. If assuming neutral stability and an aerodynamic roughness length of 1.5 cm, the vertical concentration gradient observations are con-sistent with fluxes in the range 20–40 ng m−2h−1. This interval compares satisfactorily with the figures derived from the present DFC measurements. The model predictions
15
are also consistent with the low range emissions (<10 ng m−2h−1) obtained by the DFC and the observed absence of large TGM vertical gradients over snow. TGM fluxes ob-tained at Alert during spring 2002 using DFC and micrometeorological methods yielded similar values. At Point Barrow, highly variable emission rates were observed by DFC during snowmelt 2002 ranging up to 0.6µg m−2h−1(Schroeder et al., 2003).
20
The mechanism behind the formation of volatile mercury in the sunlit snow is not well understood. The reactions are presumably abiotic and involve reactants present on the ice crystal surface. In a study by Lalonde et al. (2003), it was indicated that newly deposited mercury was highly labile in snowpacks due to Hg(II) photoinduced reduction to volatile Hg0. The environmental feasibility of aqueous reduction
mecha-25
nism of mercuric species was investigated and discussed by G ˚ardfeldt et al. (2003). It was concluded that Hg0 is not formed through consecutive one-electron reductions under aerated conditions. However, formation of Hg0 can occur for example via frag-mentation of an organic ligand bound to Hg(II) under actinic radiation.
ACPD
4, 1727–1771, 2004 Circumpolar transport and air-surface exchange of atmospheric mercury J. Sommar et al. Title Page Abstract Introduction Conclusions References Tables Figures J I J I Back Close Full Screen / EscPrint Version Interactive Discussion
The seawater in Kongsfjorden was supersaturated in respect to DGM as mentioned above, which suggests reemission of mercury from the water surface as well. Gas-exchange model calculations yielded flux values from 0.1 to 7 ng m−2h−1. It should, however, be mentioned that the bay was partly covered by ice which limited the wave field. The flux values obtained are therefore likely to be overestimated.
5
3.3. Surface depletions, occurrence of tropospheric BrO and the influence of trans-port
3.3.1. Local boundary-layer chemical and meteorological observations
Both ODEs and GEMDEs have recently been assumed to be a result of halogen chem-istry as mentioned above. The occurrence of BrO is frequently used as a tracer for
10
such processes. As can be seen in Fig. 2b, ground based DOAS BrO measurements at Ny- ˚Alesund revealed incidence of elevated BrO column densities simultaneous to the periods of low Hg0and O3surface levels. This initial signature hints that air parcels at this receptor may exhibit an augmented oxidation capacity. In order to evaluate the role of transport and transformation, various regimes of the TGM/O3
concentration-15
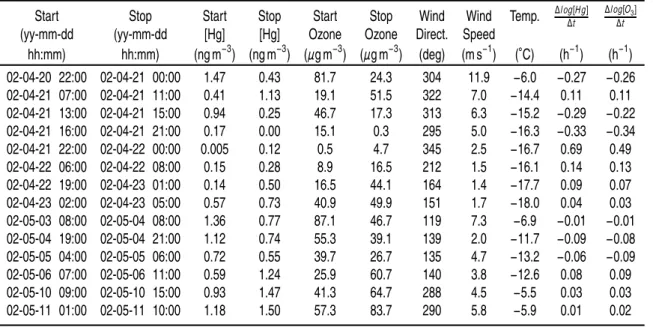
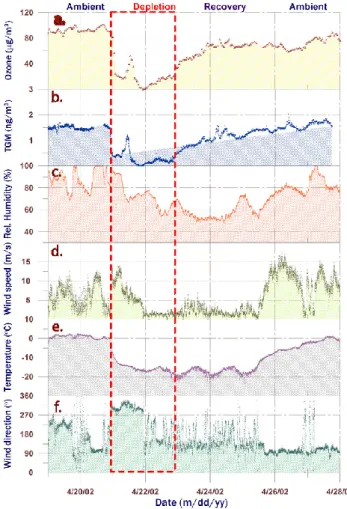
time series were evaluated. Features in composition change are generally reproduced for both gas-phase constituents but during May the patterns became increasingly less correlated. Events of concurrent significant variations in TGM and ozone concentration are given in Table 1 together with corresponding meteorological information. Shift in meteorological parameters is frequently encountered during the on-set of depletions
20
and most utterly marked during the most intense depletion (see Fig. 4c–f). The on-set of the first depletion is associated with falling temperature and raising wind speed (∆T≈−15 ◦C and ∆u≈10 m s−1 during a few hours) and rapid shift in wind direction from SE to N-NW indicating intrusion of an Arctic airmass. It should be noticed that the local wind-direction during phases of the most distinct changes in TGM were strictly
in-25
between WNW and NNW. This represents a sector almost entirely free from adjacent land masses (Fig. 1). In correspondence to observations made by Solberg et al. (1996)
ACPD
4, 1727–1771, 2004 Circumpolar transport and air-surface exchange of atmospheric mercury J. Sommar et al. Title Page Abstract Introduction Conclusions References Tables Figures J I J I Back Close Full Screen / EscPrint Version Interactive Discussion
covering ODE’s at Ny- ˚Alesund during 1988–1993, the on-set of the present GEMDEs is associated with a cold boundary layer. Contrary to the suggestions given by Lu et al. (2001), depletions at Ny- ˚Alesund appear not to be restricted to stagnant synoptic situations (Solberg et al., 1996; Tuckermann et al., 1997). The major depletion episode indeed concurred under strong winds as shown in Fig. 4.
5
The temporal descents in TGM and O3(∆[X]/∆t) were during the on-set of the major GEMDE in the order of ∼−0.5 ng m−3h−1and ∼−30µg m−3h−1, respectively. The latter value exceeds the most rapid variation features of ODEs reported previously for this site. The very fast drop may be interpreted as a combination of halogen chemistry and fast advection of an airmass extending to the surface that has already been affected by
10
depletion for an extensive period of time. The relative variations of O3and TGM were evaluated by calculating∆log[X]/∆t ratios for the relevant period of time (see Table 1). It is evident that there exists a near 1:1 relationship between O3and TGM in most of the cases. This suggests a common meteorological influence by e.g. advection or turbulent dispersion. Nevertheless, due to the presence of moderately elevated BrO
15
concentrations (a few ppt), bromine chemistry forming BrO must have occurred in the air mass. It is however not certain that ozone is a limiting factor.
3.3.2. Remote-sensing circumpolar BrO observations, trajectory and sea-ice inter-sect analysis
To further test whether the low TGM concentrations observed might be a result of
20
transport of air masses already depleted from mercury, back trajectories were calcu-lated and compared with daily average BrO vertical column density maps obtained from the GOME satellite. The results from this investigation regarding the first and the second depletion are shown in Fig. 8. The air received at Ny- ˚Alesund the 22 April (the day with maximum depletion) arrived via a north-north-west path as shown in Fig. 8a.
25
The trajectory is of four days length and originates from the Western High Arctic Sea. BrO vertical column densities mapped in Fig. 8a are from 18 April, the starting day of
ACPD
4, 1727–1771, 2004 Circumpolar transport and air-surface exchange of atmospheric mercury J. Sommar et al. Title Page Abstract Introduction Conclusions References Tables Figures J I J I Back Close Full Screen / EscPrint Version Interactive Discussion
the trajectory. According to the GOME BrO maps related to the days in-between the 18 to 22 April the trajectory was not passing though areas with elevated BrO. Hence, this would suggest that the air mass with depleted mercury originated far from Ny- ˚Alesund. However, although not observed by the GOME satellite (BrO GOME data directly above Ny- ˚Alesund are not available from the 22 April) the ground based BrO measurements
5
proved that the air mass actually contained elevated concentrations of BrO.
The climax of BrO concentrations concurrent with the very intrusion of the cold air mass indicates a sustained chemical oxidation of Hg0(g). This implies that the tran-sition phase with active oxidation of GEM must have happened close to Spitzbergen. Conversely, physical removal of the majority of the airborne mercuric products onto
10
snow and ice is a process requiring some time which therefore suggests that most of the GEM must have been oxidised quite far from Ny- ˚Alesund. Figure 8b shows a back trajectory ending at Ny- ˚Alesund at the 24 April. The GEM concentration was subse-quently almost back to normal and as shown the air received does not originate from areas with elevated BrO. According to the back trajectories calculated there is no air
15
transport between Ny- ˚Alesund and the area with high BrO column densities seen north west of Greenland. The next episode with low GEM concentrations occurred in the be-ginning of May, with a GEM minimum at the 5 May, see Fig. 8c. According to the BrO maps from this period, the low GEM concentration also seems to be a consequence of transport of an air mass depleted from mercury. However, considerable amounts of
20
oxidised mercury were transported to the measurement area via snow, as mentioned above.
Following the approach of Temme et al. (2003), 3-day backward trajectories were interactively generated to describe diurnal (12-h interval separated) transport of air masses to Ny- ˚Alesund during the entire period. The transport denoted by twelve
6-25
h interval positions for each trajectory were indexed by the degree of sea ice cov-erage if such were available. The weight factors were obtained from the ice charts of the US-National Ice Center (http://www.natice.noaa.gov/index.htm). In Fig. 9, the concentration/density-time series of TGM, O3 and BrO are spread above the surface
ACPD
4, 1727–1771, 2004 Circumpolar transport and air-surface exchange of atmospheric mercury J. Sommar et al. Title Page Abstract Introduction Conclusions References Tables Figures J I J I Back Close Full Screen / EscPrint Version Interactive Discussion
of the summed-up 6-h resolved index (Σ ice coverage, base unit 10%). It gives an unambiguous signal that the on-set of measured GEMDE’s coincides with the arrival of air masses with high degree of sea-ice transect.
The sea-ice transport index is surprisingly constant in the slow recovery phase of Hg0(g) during the major GEMDE’s. The apparent recovery phase (22 April–) is
as-5
sociated with local transport over the barren interior of Spitzbergen Island that may well include mixing of air-masses (mixing-in from above with mercury-rich air from the free troposphere). Analogous to ODEs, the influence from local typography may thus obscure the perception of the scale of the phenomenon, making local GEMDEs at Ny- ˚Alesund display shorter duration and lower magnitude (Solberg et al., 1996).
10
4. Conclusions
The measurements made during spring 2002 strongly suggest that the observed GEMDEs were caused by transport of air already depleted from mercury rather than the action of solely atmospheric chemistry in the air at Ny- ˚Alesund. One of the findings proposing transport is that the GEMDEs occurred in conjunction with weather changes.
15
The major depletion for example, was initiated when the wind direction changed from south to north and a cold air mass with wind speeds above 10 m s−1 was received. Since some time is needed for an air mass to get depleted from oxidised forms of mercury via deposition of RGM and the particulate fraction to ice and snow surfaces, the low content of airborne oxidised mercury constitutes an additional evidence for
20
transport. During the major depletion the Total Airborne Mercury (TAM=Σ(GEM, RGM, TPM)) corresponded to less than 20% of the normal background value of TGM, indi-cating a >80% loss of airborne mercury. This is considerably lower in comparison to observations made at Nunavut and Alaskan sites (Steffen and Schroeder, 2002; Lind-berg et al., 2002) where TAM values corresponding to 70–90% of the background TGM
25
concentration have been observed. With marked referral to the publications by Brooks et al. (2002), Garbarino et al. (2002), Lindberg et al. (2002a) and Lu et al. (2001)
re-ACPD
4, 1727–1771, 2004 Circumpolar transport and air-surface exchange of atmospheric mercury J. Sommar et al. Title Page Abstract Introduction Conclusions References Tables Figures J I J I Back Close Full Screen / EscPrint Version Interactive Discussion
spectively covering the American Arctic, Table 2 hints that the deposition pattern here appears to be stronger after Polar sunrise. The GOME BrO maps and back trajectories (Fig. 8) also support transport. The ground based BrO data indicate that elevated BrO concentrations can be sustained in an ozone depleted air mass. Low ozone values are large compared to BrO concentrations (a few ppt at most) possibly implying that ozone
5
concentrations are just not the limiting factor for BrO formation. Another important as-pect of the present study is the observation of increased evasion of elemental mercury from snow surfaces. This process appears to be a result of photo induced reduction of new deposited oxidised mercury on snow and ice and has been reported to be im-portant from investigations on other Arctic sites (Lalonde et al., 2002; Schroeder et al.,
10
2003; Steffen et al., 2002). Here we report evidence for a similar process occurring in seawater. The concentration of DGM in the surface water in Kongsfjorden showed a pronounced daily variation well correlated with solar radiation. Hence, it seems like a significant part of the oxidised mercury deposited onto snow and water surfaces is quickly re-emitted back to the atmosphere as elemental mercury. The ratio between
15
deposition and re-emission is an important parameter that determines the impact of mercury depletion in the Arctic environment. It is now clear that GEMDEs constitute a phenomenon of large geographical scale in Polar Regions. More research is needed to improve our understanding of this spectacular aspect of environmental mercury cy-cling.
20
Acknowledgements. We would like to acknowledge financial support from the Ny- ˚Alesund Large Scale Facility Program (Contract LSF NILU #71/2001), the Norwegian Research Council (T. Berg) and the Norwegian State Pollution Control Authority (T. Berg). We wish to thank Italian CNR for allowing access to Base Arctica CNR Dirigibile Italia. Additionally, we would like
to thank the staff at the Norwegian Polar Institute and Kings Bay A/S, Ny- ˚Alesund for support
25
during the campaign. Special thanks to M. Olofsson from Department of Chemistry, G ¨oteborg University for flux calculation from gradient measurements. Alfred Wegener Institute for Polar and Marine Research generously provided meteorological data. GOME lv1 data have been provided by ESA through DFD-DLR Oberpfaffenhofen.
ACPD
4, 1727–1771, 2004 Circumpolar transport and air-surface exchange of atmospheric mercury J. Sommar et al. Title Page Abstract Introduction Conclusions References Tables Figures J I J I Back Close Full Screen / EscPrint Version Interactive Discussion Edited by: W. Asher
References
Air Resources Laboratory, National Oceanic & Atmospheric Administration (NOAA):
HY-brid Single-Particle Lagrangian Integrated Trajectory Model,http://www.arl.noaa.gov/ready/
hysplit4.html.
5
Adams, J. W., Holmes, N. S., and Crowley, J. N.: Uptake and reaction of HOBr on frozen and dry NaCl/NaBr surfaces between 253 and 233 K, Atmospheric Chemistry and Physics, 2, 79–91, 2002.
Ariya, P. A., Khalizov, A., and Gidas, A.: Reactions of gaseous mercury with atomic and molec-ular halogens: Kinetics, product studies, and atmospheric implications, Journal of Physical
10
Chemistry A, 106, 7310–7320, 2002.
Balabanov, N. B. and Peterson, K. A.: Mercury and Reactive Halogens: The Thermochemistry
of Hg+{Cl2, Br2, BrCl, ClO, and BrO}, Journal of Physical Chemistry A, 107, 7465–7470,
2003.
Barrie, L. A., Bottenheim, J. W., Schnell, R. C., Crutzen, P. J., and Rasmussen, R. A.: Ozone
15
Destruction and Photochemical-Reactions at Polar Sunrise in the Lower Arctic Atmosphere, Nature, 334, 138–141, 1988.
Beine, H. J., Argentini, S., Maurizi, A., Mastrantonio, G., and Viola, A.: The local wind field at
Ny- ˚Alesund and the Zeppelin mountain at Svalbard, Meteorology and Atmospheric Physics,
78, 107–113, 2001.
20
Berg, T., Bartnicki, J., Munthe, J., Lattila, H., Hrehoruk, J., and Mazur, A.: Atmospheric mercury species in the European Arctic: measurements and modelling, Atmospheric Environment, 35, 2569–2582, 2001.
Berg, T., Sekkesæter, S., Steinnes, E., Valdal, A.-K., and Wibetoe, G.: Arctic springtime de-pletion of mercury in the European Arctic as observed at Svalbard, Science of the Total
25
Environment, 304, 43–51, 2003.
Bloom, N. S. and Crecelius, E. A.: Determination of Mercury in Seawater at Sub-Nanogram Per Liter Levels, Marine Chemistry, 14, 49–59, 1983.
ACPD
4, 1727–1771, 2004 Circumpolar transport and air-surface exchange of atmospheric mercury J. Sommar et al. Title Page Abstract Introduction Conclusions References Tables Figures J I J I Back Close Full Screen / EscPrint Version Interactive Discussion troposphere during winter and spring 2000 (ALERT2000), Atmospheric Environment, 36,
2535–2544, 2002.
Boudries, H. and Bottenheim, J. W.: Cl and Br atom concentrations during a surface boundary layer ozone depletion event in the Canadian high Arctic, Geophysical Research Letters, 27, 517–520, 2000.
5
Braathen, G. O., Hov, Ø., and Stordal, F.: Arctic atmospheric research station on the Zeppelin mountain (474 m a.s.l.) near Ny- ˚Alesund on Svalbard (78◦5402900N, 11◦5205300E), Report, OR 85/90, NILU, Lillestrøm, Norway, 1990.
Brooks, S., Lindberg, S. E., Goodsite, M., Skov, H., Larsen, M., Scott, K., Southworth, G., Meyers, T., and McConville, G.: Barrow atmospheric chemical conversion and speciation of
10
atmospheric mercury pollution. Paper presented at the Second AMAP International Sympo-sium on Environmental Pollution of the Arctic, Rovaniemi, Finland, 2002.
Brosset, C.: Total Airborne Mercury and Its Possible Origin, Water Air and Soil Pollution, 17, 37–50, 1982.
Burrows, J. P., Weber, M., Buchwitz, M., Rozanov, V., Ladst ¨atter-Weißenmayer, A., Richter, A.,
15
DeBeek, R., Hoogen, R., Bramstedt, K., Eichmann, K.-U., Eisinger, M., and Perner, D.: The Global Ozone Monitoring Experiment (GOME): Mission concept and first scientific results, Journal of Atmospheric Science, 56, 151–175, 1999.
Coquery, M., Cossa, D., and Martin, J. M.: The Distribution of Dissolved and Particulate Mer-cury in three Siberian Estuaries and Adjacent Arctic Coastal Waters, Water Air and Soil
20
Pollution, 80, 653–664, 1995.
Ebinghaus, R., Kock, H. H., Temme, C., Einax, J. W., Lowe, A. G., Richter, A., Burrows, J. P., and Schroeder, W. H.: Antarctic springtime depletion of atmospheric mercury, Environmental Science & Technology, 36, 1238–1244, 2002.
Foster, K. L., Plastridge, R. A., Bottenheim, J. W., Shepson, P. B., Finlayson-Pitts, B. J., and
25
Spicer, C. W.: The role of Br2and BrCl in surface ozone destruction at polar sunrise, Science, 291, 471–474, 2001.
Garbarino, J. R., Snyder-Conn, E., Leiker, T. J., and Hoffman, G. L.: Contaminants in arctic snow collected over northwest Alaskan sea ice, Water Air and Soil Pollution, 139, 183–214, 2002.
30
G ˚ardfeldt, K., Horvat, M., Sommar, J., Kotnik, J., Fajon, V., W ¨angberg, I., and Lindqvist, O.: Comparison of procedures for measurements of dissolved gaseous mercury in seawater performed on a Mediterranean cruise, Analytical and Bioanalytical Chemistry, 374, 1002–
ACPD
4, 1727–1771, 2004 Circumpolar transport and air-surface exchange of atmospheric mercury J. Sommar et al. Title Page Abstract Introduction Conclusions References Tables Figures J I J I Back Close Full Screen / EscPrint Version Interactive Discussion 1008, 2002.
G ˚ardfeldt, K.: Transformation of Mercury Species in the Aqueous Phase, Doctoral Thesis, pp. 59, Division of Inorganic Chemistry, Department of Chemistry, G ¨oteborg University, G ¨oteborg, 2003.
G ˚ardfeldt, K., Sommar, J., Ferrara, R., Ceccarini, C., Lanzillotta, E., Munthe, J., Wangberg, I.,
5
Lindqvist, O., Pirrone, N., Sprovieri, F., Pesenti, E., and Stromberg, D.: Evasion of mercury from coastal and open waters of the Atlantic Ocean and the Mediterranean Sea, Atmospheric Environment, 37, 73–84, 2003.
Gillis, A. and Miller, D. R.: Some potential errors in the measurement of mercury gas exchange at the soil surface using a dynamic flux chamber, Science of the Total Environment, 260,
10
181–189, 2000.
Goldberg, E. D.: Synthetic organohalides in the sea, Proceedings of the Royal Society of Lon-don Series B-Biological Sciences, 189, 277–289, 1975.
Golubeva, N., Burtseva, L., and Matishov, G. G.: Measurements of mercury in the near-surface layer of the atmosphere of the Russian Arctic, The Science of the Total Environment, 306,
15
3–9, 2003.
H ¨onninger, G.: Halogen Oxide Studies in the Boundary Layer by Multi Axis Differential Optical
Absorption Spectroscopy and Active Longpath-DOAS., Doctoral Thesis, pp. 262, Institute of Environmental Physics, University of Heidelberg, Heidelberg, 2002.
Kaleschke, L., L ¨upkes, C., Vihma, T., Haarpaintner, J., Bochert, A., Hartmann, J., and Heygster,
20
G.: Sea Ice Remote Sensing for Mesoscale Ocean-Atmosphere Interaction Analysis
(DMSP-SSM/I), Canadian Journal of Remote Sensing,http://www.seaice.de, 27, 5, 526–537, 2001.
Kim, K. H. and Lindberg, S. E.: Design and Initial Tests of a Dynamic Enclosure Chamber for Measurements of Vapor-Phase Mercury Fluxes over Soils, Water Air and Soil Pollution, 80, 1059–1068, 1995.
25
Lalonde, J. D., Poulain, A. J., and Amyot, M.: The role of mercury redox reactions in snow on snow-to-air mercury transfer, Environmental Science & Technology, 36, 174–178, 2002. Landis, M. S., Stevens, R. K., Schaedlich, F., and Prestbo, E. M.: Development and
character-ization of an annular denuder methodology for the measurement of divalent inorganic reac-tive gaseous mercury in ambient air, Environmental Science & Technology, 36, 3000–3009,
30
2002.
Landis, M. S. and Stevens, R. K.: Comment on “Measurements of Atmospheric Mercury Species at a Coastal Site in the Antarctic and over the South Atlantic Ocean during Polar