First International Conference on Bio-based Building Materials
June 22nd - 24th 2015
Clermont-Ferrand, France
EFFECT OF COMPACTION ON MOISTURE BUFFERING OF HEMP-LIME
INSULATION
N. Holcroft1,2*, A. Shea1,2
1
University of Bath, Department of Architecture and Civil Engineering, Bath, UK.
2 BRE Centre for Innovative Construction Materials, UK
*Corresponding author; e-mail: n.holcroft@bath.ac.uk
Abstract
The hygrothermal properties of hemp-lime vary greatly depending on density, so could potentially be tailored for a particular climate or building use. Density can be altered by either changing the hemp to lime ratio, or by varying the force applied when compacting the wet material. 18 samples of 200mm x 200mm x 70mm were cast with varying amounts of compaction and a constant ratio of 1 part hemp shiv to 1.65 parts lime binder to 2.1 parts water by mass. The samples were conditioned at 20°C and 60%RH and dried out at 60°C after 3 weeks, 6 weeks, and 4 months to measure the dry density. Moisture buffer values (MBV) were then measured for 5 of the samples by continuously weighing them in a climate chamber with step changes between 53% and 75% relative humidity every 12 hours. A study was also conducted to estimate the effect of air movement. Dry densities ranged between 192 kg/m3 and 365 kg/m3. There was a strong linear relationship between wet and dry density. Over time the
dry density of all samples increased, with higher density samples increasing for the longest time, which is likely to be due to carbonation of the lime binder. The lowest density sample tested (210 kg/m3) had the highest MBV (3.06 g/m2∆RH). This decreased by only 6% when the density increased to 278 kg/m3, but by 39% at 333 kg/m3. Therefore to maximise moisture buffering it is
important to only compact the hemp-lime using the force required for structural integrity. Keywords:
Hemp-lime; density; moisture buffering; carbonation
1 INTRODUCTION
Hemp-lime is a composite insulation material made by combining chopped up sections of the xylem of the hemp plant (cannabis sativa) with a lime based binder and water. It has a low embodied carbon (Ip & Miller, 2012), (Pretot et al., 2014), and moderate insulative properties (Arnaud, 2009), (Collet & Pretot, 2014). It also has a strong propensity to adsorb water vapour making an excellent material for buffering moisture, and so, passively regulating indoor humidity levels (Shea et al., 2012), (Barclay et al., 2014), (Collet & Pretot, 2014), which helps maintain a healthy indoor environment (Arundel et al., 1986).
This is becoming increasingly important because, as our buildings are being made more airtight and insulated, in an effort to reduce greenhouse gas emissions and alleviate fuel poverty, there is concern that elevated humidity levels could cause respiratory problems if they are not correctly ventilated (Sharpe et al., 2015), (Hall et al., 2013). It is therefore desirable to maximise the material’s ability to buffer moisture. There is also evidence to show that using water vapour impermeable insulative layers without a full
understanding how they will affect the moisture balance in the building envelope could lead to mould growth and structural damage (Künzel, 1998), (Slanina & Šilarova, 2009).
There are a number of methods for building with hemp-lime. Typically the wet mix is tamped into shuttering that is placed around a timber frame structure or against an existing wall. It can also be sprayed by blowing the hemp shiv and dry lime binder through a hose that mixes it with water at the nozzle, or it can be cast into blocks (Collet et al., 2013). Invariably different amounts of force will be applied when tamping the hemp-lime depending on the person or technique. More compaction will reduce permeability so reducing the rate of moisture uptake, but more hemp per unit volume will mean more surface area available for sorption, as long as it is accessible. Compaction will similarly affect thermal properties, varying thermal conductivity and volumetric heat capacity.
Different climatic conditions and building uses will require different material properties to optimise performance, therefore hemp-lime could potentially be tailored to those needs by adjusting the density. This paper will only examine one set of conditions created in a climate chamber, but will add to work previously
done characterising the hygrothermal properties of hemp-lime to help quantify its performance. It could also provide useful information for choices in construction method, and prediction of building performance.The samples used in these experiments were primarily made to develop a method for obtaining a consistent dry density for various hemp-lime samples for laboratory testing, which is critical for being able to predict the performance of the material. However, it may also provide useful knowledge for practitioners trying to achieve a certain target density.
2 METHODS
2.1 Hemp-lime samples
The samples were cast in June 2014 using a mix of 5 kg hemp shiv, to 8.25 kg Tradical™ PF70 lime binder, and 10.5 kg of water, which produced 18 samples of 200 x 200 x 70mm in one load. A flat bed mixer was used to combine the materials. The dry hemp shiv and lime were first mixed together thoroughly before the water was slowly added, occasionally stopping the mixer to make sure all the dry lime was integrated into the wet mix. The wet mix was then tamped into phenolic coated plywood formwork. Different degrees of compaction were produced by tamping down the hemp-lime using varying weights from 1 kg to 10kg. For the lightest samples the hemp-lime mix was placed, under its own gravity, in the formwork and levelled off. The heaviest samples were made by hammering the mix down with full force.
The samples were left in the laboratory over the weekend. The formwork was then removed and the samples were placed on racks in a conditioning room set at 20°C and 60%RH so that all surfaces were exposed. After 3 weeks 6 of the samples were dried out in an oven at 60°C until the change in mass was less than 0.1%, then returned to the conditioning room. This was repeated with a different 6 samples after 6 weeks. After 4 months all 18 samples were dried and weighed.
2.2 Effect of compaction on moisture buffering 5 samples were chosen from the initial 18 to test their moisture buffering capacity, so as to provide a wide range of densities. The samples were double or triple wrapped in adhesive aluminium foil and screwed into a metal frame to insure that only the exposed area of 200 x 200mm was active in moisture buffering. They were placed in an Espec LHL-113 climate chamber (Fig. 1) set to produce step changes between 53% and 75% relative humidity every 12 hours in isothermal conditions of 23°C (ISO, 2008). A windscreen was placed across the fan to reduce air movement. The temperature and relative humidity in the chamber were measured every 5 minutes using a Tiny Tag TV-4505 temperature and relative humidity probe, and the mass of the sample was continuously logged, every minute, to the nearest 0.1g, on an electronic balance.
The samples were conditioned in the climate chamber for a number of weeks then, to insure identical conditions, they were measured individually, in sequence, in the same position in the chamber, using the same balance. The humidity cycles were repeated until the amount of moisture adsorbed and desorbed was equal so that results could be easily compared. An Extech CFM hot wire anemometer was clamped 2cm above the sample (Fig. 1) and both horizontal and
vertical air velocities were recorded 60 times during each test.
Fig 1: Climate chamber with sample and anemometer.
The moisture buffer value (g/m2∆RH) was calculated
using equation 1:
ϕ
∆
−
=
A
m
m
MBV
a d (1)Where, ma = Mass of the sample at completion of
moisture adsorption process (g)
md = Mass of the sample at completion of moisture
desorption process (g)
A = Surface area of sample (m2)
∆φ = Difference between the average relative humidity during adsorption and desorption (%)
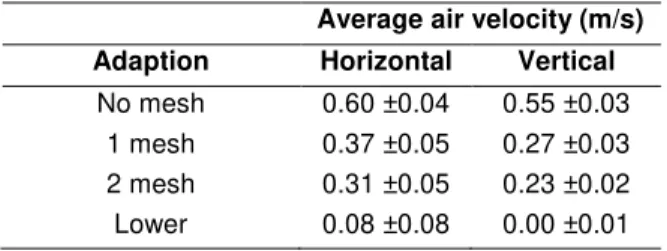
2.3 Effect of air velocity on moisture buffering Prior to these tests, a previously cast sample of hemp-lime was used to analyse the effect that air velocity across the sample surface had on the MBV. The sample had a dry density of 286 kg/m3 and dimensions of 200 x 200 x 90mm. The same procedure was used as above except that 4 different air velocities were created across the sorption surface. As the Espec climate chamber does not have a variable fan option this was achieved by using either no windscreen, placing one piece of plastic mesh across the fan, placing a second mesh, and finally weighing the sample in a different position, lower down in the chamber. Table 1 gives the averages and standard deviations of the velocities this produced.
Table 1: Average air velocity 2cm above the sample during air velocity test
Average air velocity (m/s) Adaption Horizontal Vertical
No mesh 0.60 ±0.04 0.55 ±0.03 1 mesh 0.37 ±0.05 0.27 ±0.03 2 mesh 0.31 ±0.05 0.23 ±0.02 Lower 0.08 ±0.08 0.00 ±0.01 3 RESULTS AND ANALYSIS
3.1 Estimating dry densities
When the initial wet density was plotted against the oven dry density a strong linear relationship was found at all drying stages (Fig. 2). Table 2 shows the gradients and intersects when linear regression was applied to the results in the form :
B
AM
M
d=
w+
(2)Where, Md = dry mass and Mw = wet mass
Table 2: Constants for linear relationship between dry density and wet density
A B 3 weeks 0.591 1.85 6 weeks 0.588 8.96 4 months 0.612 0.15
Between weeks 3 and 6 there is almost no change in gradient, however, the intersect increased by 7.1 kg/m3, meaning that all samples increased their dry
density by approximately this amount. After 4 months the gradient had become steeper so that the heavier samples increased their dry density more than the lighter samples (Sample 365 added 19.3 kg/m3, while
sample 192 had almost no change).
A possible explanation is that this increase in density was due to carbonation of the lime binder. In the carbonation process calcium hydroxide, the main constituent of the lime binder, is converted into calcium carbonate (Ca(OH)2 + CO2 → CaCO3 + H2O). As
calcium carbonate is a more massive molecule this will increase the overall weight of the sample.
This would suggest that for the first 6 weeks all samples carbonated at about the same rate, at which point, the lightest samples had ceased the process as they were more permeable and had less calcium hydroxide to convert. After 4 months the heavier samples were still carbonating, due to their lower permeability.
Fig 2: Relationship between wet and dry density over 4 months
Using this final gradient it can now be calculated that to achieve, for example, a dry density of 275 kg/m3 with
this hemp-lime mix would require a wet density of approximately 449 ±26 kg/m3.
3.2 Moisture buffer values and air velocity
Changes in air movement across the sample surface were found to have a large effect on the MBV ranging from 1.91 ±0.10 g/m2∆RH with almost still air at the
bottom of the climate chamber to 4.68 ±0.34 g/m2∆RH with the fan blowing straight across the sample at 0.6 ±0.04 m/s. Overall this approximated to a linear increase of 0.54 g/m2∆RH for every 0.1 m/s increase in
velocity (Fig. 3). This occurs because when air movement is slow a boundary layer of still air forms at the surface impeding water vapour transfer. Talev et
al. (2008) showed experimentally that the surface moisture transfer coefficient (kg/m2sPa) increases
linearly with increased air velocity in tests where small containers of water had air blown across their surface in a wind tunnel and evaporation rate was measured, therefore indicating the same mechanism in action.
Average horizontal air velocity (m/s)
0.0 0.1 0.2 0.3 0.4 0.5 0.6 0.7 M B V ( g/ m 2 ∆R H ) 1.5 2.0 2.5 3.0 3.5 4.0 4.5 5.0 5.5
Fig. 3: Relationship between air velocity and moisture buffer value
It is clear from these results that when conducting moisture buffering tests, or any experimentation in a climate chamber which is sensitive to air movement, that the flow is carefully controlled and measured as conditions can vary significantly in different parts of the chamber.
Moisture buffering standards differ on setting values for air flow. The Nordtest Protocol (Rode et al., 2005) states a water vapour surface resistance of 5 x10⁷ ±10% m2sPa/kg, which equates to an air velocity of approximately 0.1 ±0.05 m/s. The value used in ISO 24353 is an order of magnitude lower, 4 x10⁶ ±10%
m2sPa/kg, corresponding to a higher velocity. It is difficult to obtain such levels of accuracy using a small climate chamber, so to make different studies more comparable a more controlled arrangement such as the Transient Moisture Transfer facility detailed in Talukdar et al. (2007) could be used, where air is pumped from a climate chamber through a wind tunnel over the surface of the sample.
During the testing with different density samples 2 pieces of plastic mesh were placed across the fan and each sample positioned in the top left side of the chamber (Fig. 1). Average air velocities measured by the anemometer varied very little (Table 3). Using the relationship shown in Figure 3 it was estimated that these differences in air velocity should only alter the MBV results by ±0.08 g/m2∆RH.
Table 3: Average air velocity 2cm above the sample during MBV test
Average air velocity (m/s) Dry Density (kg/m3) Horizontal Vertical
210 0.35 ±0.06 0.31 ±0.04 238 0.33 ±0.05 0.32 ±0.03 278 0.37 ±0.06 0.29 ±0.04 304 0.37 ±0.06 0.32 ±0.04 333 0.34 ±0.05 0.32 ±0.04 3.3 Moisture buffer values and density
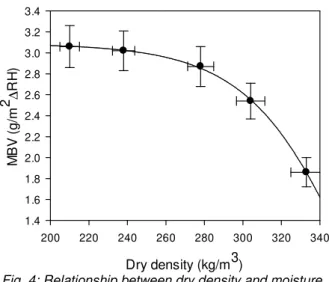
The results showed that the two least compacted samples produced the largest MBV (Fig. 4), showing a Wet Density (kg/m3) 300 350 400 450 500 550 600 D ry D en si ty ( kg /m 3 ) 150 200 250 300 350 400 3 Weeks 6 Weeks 4 Months
plateauing at around 238 kg/m3. Increasing the density to 278 kg/m3 reduced the MBV by just 6%, but
compacting it to 333 kg/m3 reduced it 39%. Dry density (kg/m3) 200 220 240 260 280 300 320 340 M B V ( g/ m 2 ∆R H ) 1.4 1.6 1.8 2.0 2.2 2.4 2.6 2.8 3.0 3.2 3.4
Fig. 4: Relationship between dry density and moisture buffer value
Figure 5 provides more detail on the rates of sorption. The lower density samples initially increased in mass most rapidly in response to the step change in humidity, due to their higher vapour permeability. However, their rate of adsorption also slowed most rapidly over the full 12 hour period. For example, the difference in mass between the 238 kg/m3 and 210 kg/m3 samples was greater at 6 hours than at 12
hours. Indeed, if the adsorption period had been longer then Sample 238 may have produced the greater MBV. A larger step change in humidity may also have favoured the more dense samples. This would suggest that the lower density samples have less moisture storage capacity, and that an optimum density may exist for a given set of conditions.
Time (hours) 0 6 12 18 24 C ha ng e in m as s (g ) 0.0 0.5 1.0 1.5 2.0 2.5 3.0 210 238 278 304 333
Fig. 5: Adsorption and desorption curves at dynamic equilibrium for 5 densities of hemp-lime
Aït Ouméziane (2013) measured sorption isotherms of two hemp-lime samples with different amounts compaction, producing densities of 396 kg/m3 and 450
kg/m3. The lime to hemp ratio for both samples was
2.1:1, in comparison to the 1.65:1 used in the tests in this paper. Here the results showed that the lower density sample had the greater moisture storage capacity. From the shape of the sorption isotherm it was hypothesised that the lower density sample had greater monolayer adsorption due to its greater open porosity. The available volume for multilayer adsorption was approximately equal, but capillary condensation appeared to begin at a lower relative humidity for the lower density sample, due to it having
larger pores. It would be interesting to test if the same pattern is observed when testing samples with a lower lime to hemp ratio.
A higher density sample will have more hemp particles per unit volume and therefore more micropores, which should increase the amount of moisture that could be adsorbed to the surfaces. However, the greater compaction is more likely to make those pores inaccessible, due to lower open porosity and a greater surface area being covered with lime. A lower density sample, having a higher porosity, will have a greater moisture content at saturation. (Fig. 6) Therefore, which density has the greater moisture storage capacity at different levels of humidity (shape of the sorption isotherm) will be dependent on both compaction and the lime to hemp ratio.
Fig. 6: Surface of low density (210 kg/m3, upper) and high density (333 kg/m3, lower) samples showing
spaces between hemp particles
The results showed that, in these test conditions, a low density sample with greater open porosity, and therefore greater water vapour permeability, will give the higher MBV. However, the improvement gained from decreasing density diminishes. If the density of hemp-lime is too low then the insulation will not have sufficient structural integrity, becoming crumbly. The 210 kg/m3 sample was somewhat fragile, therefore
between 238 kg/m3 and 278 kg/m3 would seem an optimum target density for this particular lime to hemp ratio. It would be useful, in the future, to also conduct friability tests, such as an adaptation of the tumbler test ASTM D441 (ASTM, 2012) as described in Norval (2012), to determine some minimum density requirements for structural integrity.
It would also be informative to repeat the moisture buffering tests with higher lime to hemp ratio samples. The moisture buffer value of such a higher density sample was measured by Collet et al. (2013). A lime to hemp ratio of 2:1 was used, which gave a dry density of 430 kg/m3. The wet mix was slightly compacted into
moulds and conditioned at 23°C and 50%RH. The same Tradical PF70 lime binder was also used. However, the conditions used to measure the MBV differed, so are not directly comparable. The change in relative humidity (33%-75%) was greater, the adsorption period (8 hours) shorter, and desorption period (16 hours) longer. Air movement in the chamber was also slightly lower (horizontal 0.1-0.4 m/s, vertical 0.07-0.14 m/s).
This produced an MBV of 2.14 g/m2∆RH. This does not fit the curve shown in Figure 4 having a higher MBV than this relationship would suggest. Clearly, a second curve would exist at a higher range of densities for this particular formulation. The shape of this curve, and whether the range of MBVs would be the same, above, or below those in Figure 4 are unknown. As Collet et al. (2013) state that the sample was slightly
compacted it would probably be a mid to low density sample for this formulation, so direct comparison would suggest the curve would have lower MBVs. However, the shorter adsorption period of the test, and lower air velocity, would have reduced the MBV (Roels & Janssen, 2006). Adjusting for these factors could easily mean that the curve would have comparatively higher MBVs.
4 CONCLUSIONS
The hygric properties of hemp-lime are highly variable depending on density. When this was varied by compaction from 210 kg/m3 to 333 kg/m3 it was found that the lower the density the higher the moisture buffer value (MBV), over a range of between 3.06 ±0.20 g/m2∆RH and 1.86 ±0.14 g/m2∆RH. However,
moderate compaction caused only a modest reduction (2.87 ±0.19 g/m2∆RH at a density of 2.78 kg/m3), showing that it is important not to overly compress hemp-lime during construction reducing its permeability to water vapour. Air movement across the sorption surface was found to have a large effect on moisture buffering. The MBV increased linearly approximately 0.54 g/m2∆RH for every 0.1 m/s increase in horizontal air velocity. A linear relationship was also found between the final dry density of the hemp-lime insulation and its wet density when first cast. This provided a ratio of approximately 0.6:1, after 4 months of carbonation, for use in predicting a target dry density for future experiments and construction. The rate of carbonation was found to have slowed to almost zero after 6 weeks for the lightest samples, whereas the denser samples were still increasing in mass between 6 weeks and 4 months.
5 ACKNOWLEDGMENTS
The authors thank the EPSRC for funding this work (grant EP/J019917/1) and the following industrial partners for their support: Lime Technology, White Design Associates, Integrated Environmental Solutions, Arup, and Plant Fibre Technology. We also acknowledge the help and support of staff and students at BRE CICM, Department of Architecture and Civil Engineering at the University of Bath. Particular thanks go to Eugene Duffy for his help making the test samples.
6 REFERENCES
Aït Ouméziane, Y.; Evaluation des performances hygrothermiques d’une paroi par simulation numérique: application aux parois en béton de chanvre. INSA Rennes, 2013.
Arnaud, L.; Comparative study of hygrothermal performances of building materials. Non-conventional Materials and Technologies, 6-9 Sept 2009. Bath, UK. Arundel, A.; Sterling, E.; Biggin, J; Sterling, T.; Indirect health effects of relative humidity in indoor environments. Environmental Health Perspectives,
1986, 65, 351–361.
ASTM; Standard Test Method of Tumbler Test for Coal. ASTM D441-7. ASTM International, 2012. Barclay, M.; Holcroft, N.; Shea, A.; Methods to determine whole building hygrothermal performance of hemp-lime buildings. Building and Environment, 2014,
80, 204-212.
Collet, F.; Chamoin, J.; Pretot, S.; Lanos, C.; Comparison of the hygric behaviour of three hemp concretes. Energy and Buildings, 2013, 62, 294-303.
Collet, F.; Pretot, S.; Experimental highlight of hygrothermal phenomena in hemp concrete Wall.
Building and Environment, 2014, 82, 459-466.
Collet, F.; Pretot, S.; Thermal conductivity of hemp concretes: Variation with formulation, density and water content. Construction and Building Materials,
2014, 65, 612–619.
Hall, M.; Casey, S.; Loveday, D.; Gillott, M.; Analysis of UK domestic building retrofit scenarios based on the E.ON Retrofit Research House using energetic hygrothermics simulation - Energy efficiency, indoor air quality, occupant comfort, and mould growth potential.
Building and Environment, 2013, 70, 48-59.
Ip, K.; Miller, A.; Life cycle greenhouse gas emissions of hemp–lime wall constructions in the UK. Resources, Conservation and Recycling, 2012, 69(0): 1-9.
ISO; Hygrothermal performance of building materials and products – determination of moisture adsorption/desorption properties in response to humidity variation. ISO 24353, 2008.
Künzel, H.; 1998. Effect of interior and exterior insulation on the hygrothermal behaviour of exposed walls. Materials and Structures, 1998, Springer
Netherlands.
Norval, P.; Can friability in hempcrete be reduced by the incorporation of hemp fibres? GSE Centre for Alternative Technology, University East London, 2012. Pretot, S.; Collet, F.; Garnier, C.; Life cycle assessment of a hemp concrete wall: Impact of thickness and coating. Building and Environment,
2014, 72, 223-231.
Rode, C.; Peuhkuri, R.; Mortensen, L.H.; Hansen, K.K. et al.; 2005. Moisture buffering of building materials. 2005, Department of Civil Engineering, Technical University of Denmark.
Roels, S.; Janssen, H.; A comparison of the nordtest and japanese test methods for the moisture buffering performance of building materials. Journal of Building Physics, 2006, 30, 137-161.
Sharpe, R.; Thornton, C.; Nikolaou, V.; Osborne, N.; Higher energy efficient homes are associated with increased risk of doctor diagnosed asthma in a UK subpopulation. Environment International, 2015, 75,
234–244.
Shea, A.; Lawrence, M.; Walker, P.; Hygrothermal performance of an experimental hemp–lime building.
Construction and Building Materials, 2012, 36, 270-5.
Slanina, P.; Šilarová, Š.; Moisture transport through perforated vapour retarders. Building and Environment,
2009, 44, 1617-1626.
Talev, G.; Gustavsen, A.; Næss, E.; The influence of air velocity and transport properties on the surface mass transfer coefficient in a rectangular tunnel – theory and experiments. A41-T3-N-06-2. International Energy Agency, Executive committee on Energy Conservation in Buildings and Community Systems, 2008
Talukdar, P.; Olutmayin, S.; Osanyintola, O.; Simonson, C.J.; An experimental data set for benchmarking 1-D, transient heat and moisture transfer models of hygroscopic building materials. Part I: Experimental facility and material property data.
International Journal of Heat and Mass Transfer, 2007,