HAL Id: hal-00300879
https://hal.archives-ouvertes.fr/hal-00300879
Submitted on 3 Dec 2001HAL is a multi-disciplinary open access
archive for the deposit and dissemination of sci-entific research documents, whether they are pub-lished or not. The documents may come from teaching and research institutions in France or abroad, or from public or private research centers.
L’archive ouverte pluridisciplinaire HAL, est destinée au dépôt et à la diffusion de documents scientifiques de niveau recherche, publiés ou non, émanant des établissements d’enseignement et de recherche français ou étrangers, des laboratoires publics ou privés.
Field measurements of hygroscopic properties and state
of mixing of nucleation mode particles
M. Väkevä, M. Kulmala, F. Stratmann, K. Hämeri
To cite this version:
M. Väkevä, M. Kulmala, F. Stratmann, K. Hämeri. Field measurements of hygroscopic properties and state of mixing of nucleation mode particles. Atmospheric Chemistry and Physics Discussions, European Geosciences Union, 2001, 1 (2), pp.379-409. �hal-00300879�
ACPD
1, 379–409, 2001 Hygroscopicity of nucleation mode particles Väkevä et al. Title Page Abstract Introduction Conclusions References Tables Figures J I J I Back Close Print Version Interactive Discussion c EGS 2001 Atmos. Chem. Phys. Discuss., 1, 379–409, 2001www.atmos-chem-phys.org/acpd/1/379/ c
European Geophysical Society 2001
Atmospheric Chemistry and Physics Discussions
Field measurements of hygroscopic
properties and state of mixing of
nucleation mode particles
M. Väkevä1, M. Kulmala1, F. Stratmann2, and K. Hämeri3
1University of Helsinki, Department of Physics, Helsinki, Finland 2Institute for Tropospheric Research, Leipzig, Germany
3Finnish Institute of Occupational Health, Helsinki, Finland
Received: 14 October 2001 – Accepted: 5 November 2001 – Published: 3 December 2001 Correspondence to: K. Hämeri ([email protected])
ACPD
1, 379–409, 2001 Hygroscopicity of nucleation mode particles Väkevä et al. Title Page Abstract Introduction Conclusions References Tables Figures J I J I Back Close Print Version Interactive Discussion c EGS 2001 AbstractAn Ultrafine Tandem Differential Mobility Analyser (UF-TDMA) has been used in sev-eral field campaigns over the last few years. The investigations were focused on the origin and properties of nucleation event aerosols, which are observed frequently in various environments. This paper gives a summary of the results of 10nm and 20nm
5
particle hygroscopic properties from different measurement sites: an urban site, an urban background site and a forest site in Finland and a coastal site in western Ire-land. The data can be classified in four hygroscopic growth classes: hydrofobic, less-hygroscopic, more-hygroscopic and sea-salt. Similar classification has been earlier presented for Aitken and accumulation mode particles. In urban air, the summertime
10
10nm particles showed varying less-hygroscopic growth behaviour, while winter time 10nmand 20nmparticles were externally mixed with two different hygroscopic growth modes. The forest measurements revealed diurnal behaviour of hygroscopic growth, with high growth factors at day time and lower during night. The urban background particles had growth behaviour similar to the urban and forest measurement sites
15
depending on the origin of the observed particles. The coastal measurements were strongly affected by air mass history. Both 10nmand 20nmparticles were hygroscopic in marine background air. The 10nmparticles produced during clean nucleation burst periods were hydrofobic. Diurnal variation and higher growth factors of 10nmparticles were observed in air affected by other source regions. External mixing was
occasion-20
ally observed at all the sites, but incidents with more than two growth modes were extremely rare.
1. Introduction
Tandem Differential Mobility Analyser (TDMA) instruments have been widely used for studies of hygroscopic properties of submicron aerosol particles. These
measure-25
lab-ACPD
1, 379–409, 2001 Hygroscopicity of nucleation mode particles Väkevä et al. Title Page Abstract Introduction Conclusions References Tables Figures J I J I Back Close Print Version Interactive Discussion c EGS 2001 oratory particles. In addition, also ambient aerosol particles have been characterisedin various environments (e.g. McMurry and Stolzenburg,1989; Svenningsson et al., 1992;Covert and Heintzenberg,1993;Swietlicki et al.,1999). In the above referenced studies the focus was on particles in Aitken and accumulation modes. These are the size ranges most abundant in the measurement sites. Recently the presence of
nucle-5
ation mode particles have been observed frequently in several locations (e.g.Mäkelä et al.,1997;O’Dowd et al.,1998;Birmili and Wiedensohler,2000). However, the char-acterisation of the nucleation mode particles is a difficult task because of the small mass of these particles. A TDMA system provides means for chemical characterisa-tion of the nucleacharacterisa-tion mode particles. Even though TDMA measurements alone will
10
not give the exact composition of the aerosol particles, but represent only a pointer to a possible composition, they give information about the aerosol physico-chemical be-haviour and state of mixing. This information can be used as input for aerosol dynamic models.
This study concentrates on the measurements of hygroscopic properties of
nucle-15
ation mode particles with a TDMA. The field studies presented have a major focus on investigating the origin and properties of the freshly nucleated particles. In addition, the properties of background air nucleation mode particles is investigated. When cat-egorising nucleation mode particles one should keep in mind the Kelvin effect: out of two particles with identical composition, the smaller one will have smaller growth
fac-20
tor. A more detailed description of the growth of laboratory generated nucleation mode aerosol particles can be found in Hämeri et al. (2000) and Hämeri et al. (2001a). It should also be noted that the deliquescence properties of ultrafine particles are dif-ferent from larger particle sizes. For example for NaCl particles with 10nm mobility diameter deliquescence relative humidity is over 80%, when for particles with
diame-25
ters above 100nmit is about 75% (Hämeri et al.,2001a;Djikaev et al.,2001). For this reason the ambient measurements should be undertaken under a constant relative hu-midity as high as possible (in this study nominally 90%) and it should be remembered that even though the bulk material of some substance is hygroscopic, an ultrafine
par-ACPD
1, 379–409, 2001 Hygroscopicity of nucleation mode particles Väkevä et al. Title Page Abstract Introduction Conclusions References Tables Figures J I J I Back Close Print Version Interactive Discussion c EGS 2001 ticle of the same composition might appear non-hygroscopic in the relative humiditystudied.
In earlier work ambient submicron aerosol particles have been divided into four hy-groscopic classes accordingly (e.g.Swietlicki et al.,2000): 1.) Hydrofobic particles that do not grow at all when exposed to humid conditions. 2.) Less hygroscopic
parti-5
cles that have growth factors smaller than pure salts, but show still a clear response to increased humidity. 3.) More hygroscopic particles that grow similarly to common atmospheric inorganic salts (e.g. (NH4)2SO4) particles. For nucleation mode particles
this means, for example, that particles having a dry diameter of 10nmgrow up to 13– 14nm or more at 90% relative humidity ((NH4)2SO4 grows up to about 13.8nm). 4.) 10
Sea salt particles. Growth factor ofNaCl is often used as an indicator of this growth mode. For 10nm NaClparticles (produced with an atomizer), the growth factor at 90% relative humidity is about 1.8.
It should be noted thatCocker et al.(2001) state that in urban air limitation to these four classes is not enough. Their TDMA measurements of particles 50nmand 150nm
15
in diameter revealed up to 6 simultaneous growth modes.
In this paper we present a summary of selected TDMA field experiments of 10nm
and 20nmparticles in mobility diameter from the years from 1997 to 1999. The ambient observations presented here are from four different places: urban, urban background, and a forest site in Finland, and a coastal site in Western Ireland. The focus of the
20
field studies has been primarily on the atmospheric new particle formation (the forest site, the coastal site and the urban background site). In addition the urban nucleation mode aerosols resulting largely from anthropogenic pollution sources is studied. The measurements at the forest site and the coastal site were undertaken as parts of EU projects (BIOFOR) and (PARFORCE) (see web sites at the end).
ACPD
1, 379–409, 2001 Hygroscopicity of nucleation mode particles Väkevä et al. Title Page Abstract Introduction Conclusions References Tables Figures J I J I Back Close Print Version Interactive Discussion c EGS 2001 2. Experimental 2.1. UF-TDMAThe operation principle of an ultrafine tandem differential mobility analyzer (UF-TDMA) is similar to that of the TDMAs used to study hygroscopic properties of larger parti-cle sizes. A more detailed description of the operation can be found inHämeri et al.
5
(2000). A quasi monodisperse size fraction of dried ambient aerosol particles is se-lected with a DMA, these particles are then humidified to a certain defined relative humidity, and a second DMA with humidified sheath flow is then used to monitor the changes in particle diameter. The change is expressed in terms of a growth factor (GF) i.e. the ratio of the humid diameter to the dry diameter selected by the first DMA.
10
There are, however, special requirements for an instrument devoted to study ultrafine aerosol particles. a) Because of the large diffusional losses of ultrafine particles sam-pling lines and the transport through the instrument have to be short. b) The often very low concentrations of ambient ultrafine particles require high sensitivity in measuring particle concentrations. This requirement has been considered using a modified TSI
15
3010 CPC (with the temperature difference between condenser and saturator 25◦C). c) The lower hygroscopic growth of ultrafine particles compared with larger particles due to Kelvin effect requires high sensitivity in determining the particle size. The di-ameters of both dry and humidified particles are determined using a Vienna type DMA with inner rod length of 11cm, 1/10 aerosol to sheath flow ratio, and dense voltage
20
steps in the second DMA (e.g.Yuskiewicz et al.,1998). 2.2. Data analysis
To analyse the TDMA measurements a data inversion procedure is needed, i.e. from the concentration distribution∆N (Zp,i)measured downstream of DMA2 as a function
of DMA2 midpoint mobilityZp,i the mobility distributionn(Zp) in front of DMA2 has to 25
ACPD
1, 379–409, 2001 Hygroscopicity of nucleation mode particles Väkevä et al. Title Page Abstract Introduction Conclusions References Tables Figures J I J I Back Close Print Version Interactive Discussion c EGS 2001 be determined. Concentrations downstream of DMA2 are described by∆N (Zp,i) ≈
Z ∞
0
n(Zp)Ω(Zp, Zp,j)dZp, (1)
whereΩ(Zp, Zp,j)is the DMA transfer function. Considering a sufficiently large number
of measured mobilities discretization leads to
∆N (Zp,i) ≈
X
j
n(Zp,j)Ω(Zp,i, Zp,j)∆Zp, (2)
5
The application of vector notation yields
∆N = ¯Ω · n∆Z¯ p, (3)
Consequently, the concentration distribution downstream of DMA2 is described by a set of linear equations. Solving this set with respect tonyields the mobility distribution up-stream of DMA2. From this mobility distribution, the changes in particle mobility and
10
consequently the growth factors can be determined.
For convenience, in this work two different techniques were used a) a method based on an inversion procedure featuring a numerical solution of Eq. 3 (e.g.Stratmann et al., 1998;Yuskiewicz et al.,1998) and b) a simplified and less accurate procedure (Hämeri et al.,2001b).
15
The simplified procedure was used to determine the size into which particles had grown, by defining the size corresponding to the peak of the measurement spectra, and to get a rough estimate of the number of particles belonging to that spectrum. Then the more sophisticated algorithm was only used for a number of spectra to make sure the simple approach was trustworthy within the error limits of the measurement
20
system, which are approximately 5% in changes in size.
With the two approaches the calculated diameters agreed well (well within the error limits of the measurements), but the errors in the estimated concentrations were larger. Typically the simple procedure gave about 10% smaller concentrations than the other one. Thus the concentrations mentioned in this paper are mainly used as indicators
ACPD
1, 379–409, 2001 Hygroscopicity of nucleation mode particles Väkevä et al. Title Page Abstract Introduction Conclusions References Tables Figures J I J I Back Close Print Version Interactive Discussion c EGS 2001 of the presence of ultrafine particles and as a rough means of comparing e.g. relativeamounts of externally mixed aerosol particles. 2.3. Corrections of field data
The UF-TDMA used in the described studies has been developed during the time pe-riod of the field campaigns. To be able to compare data measured during different field
5
studies with different versions of the instrument, all data has been corrected based on calibration measurements. Ammonium sulphate particles generated with a nebulizer were used as the calibration aerosol.
It has been shown that laboratory measurements (Hämeri et al.,2000) and theoret-ical calculations do not give exactly the same growth factors for ultrafine ammonium
10
sulphate particles. Thus our field data has been corrected a) by first multiplying the observed growth factors with a correction factor in order to make field(NH4)2SO4
cali-brations consistent with laboratory ammonium sulphate measurements, and b) then by correcting growth factors measured in other than the nominal 90% relative humidity by using fitted laboratory data.
15
The correction factor (a) was calculated as follows:
corr = (GFlab(RH) − 1)/(GFf ield(RH) − 1), (4)
whereGFf ield is the growth factor of ammonium sulphate calibration in the field
mea-surement in relative humidityRH, andGFlabis the growth factor of ammonium sulphate
particles in the same relative humidity RH, but measured in well defined laboratory
20
conditions.
The second sequence of corrections was also based on laboratory data. Growth curves, i.e. growth factor vs. relative humidity of ultrafine ammonium sulphate particles have been determined in laboratory conditions. These growth curves, and to be more precise, their form has been used to predict the size into which the ambient particles,
25
ACPD
1, 379–409, 2001 Hygroscopicity of nucleation mode particles Väkevä et al. Title Page Abstract Introduction Conclusions References Tables Figures J I J I Back Close Print Version Interactive Discussion c EGS 2001 The correction procedure described above is based on the assumption that theam-bient particles consisted of an ammonium sulphate volume together with insoluble ma-terial, which is of course is a simplification.
For this paper, only data with DMA2 relative humidity 88–92% (except for Luukki 1997 measurements 87%–94%) have been selected. Also for counting statistical
rea-5
sons all observations during which concentrations after the DMA2 were lower than 0.1cm−3 were discarded.
2.4. Measurement sites
The data presented in this work have been measured in urban, urban background, forest, and coastal environments. The data are from several separate field campaigns
10
with focus on different scientific tasks. The urban, urban background and forest sites are located in Southern Finland, and the coastal site is located in Western Ireland.
The urban site is located in down town Helsinki. The aerosol sampling was done at the height of 20masl, and about 2mabove the ground level, with a distance of about 50mto the closest road. The whole Helsinki down town area is surrounded by the sea
15
and within the vicinity of the measurement site there is a bay. Air quality in Helsinki is affected mainly by traffic, energy production and the sea. The Helsinki data were measured in May 1998 and December 1999.
The urban background site, Luukki, is situated 22kmnorth-west from Helsinki and about 20kmnorth of coast line. In Luukki aerosol was sampled 5mabove the ground
20
level. The site is surrounded by forests and agriculture and there are no significant local anthropogenic emission sources nearby. Distance to the closest road is about 1.5km. The concentrations of pollutants in Luukki are strongly affected by sources in Helsinki area. Meteorological conditions, especially the wind direction, radically alter the levels of gas and particle concentrations. Luukki is a measurement station used
25
by the air quality authorities of Helsinki metropolitan area for continuous monitoring of urban background pollutants. The TDMA measurements were performed in February 1997. More details about the downtown Helsinki and Luukki sites can be found in
ACPD
1, 379–409, 2001 Hygroscopicity of nucleation mode particles Väkevä et al. Title Page Abstract Introduction Conclusions References Tables Figures J I J I Back Close Print Version Interactive Discussion c EGS 2001 Hämeri et al.(1996),Buzorius et al.(1999) andVäkevä et al.(2000).The forest site, Hyytiälä, is situated 250kmnorth-west from Helsinki. In Hyytiälä the sampling inlet was at the height of 67mabove the ground level. Hyytiälä SMEAR II sta-tion (A Stasta-tion for Measuring Forest Ecosystem - Atmosphere Relasta-tions), is equipped with continuous monitoring of aerosol particle size distributions (DMPS, 3-800nm in
5
mobility diameter) together with number of instruments measuring interactions between the forest and the atmosphere. For more information about Hyytiälä measurement sta-tion and measurements performed there see e.g. Mäkelä et al. (1997) and Kulmala et al. (2001). Most of the Hyytiälä data presented in this paper were measured during the BIOFOR campaigns: April–May and August 1998, and March-April 1999 (Hämeri
10
et al.,2001b).
The coastal measurements were done at Mace Head measurement station on the west coast of Ireland. The station has an excellent exposure to the North Atlantic. Most of the time clean marine background air surrounds the site. Only during winds from east or south-east air is affected by local sources, such as bio-mass burning. For more
15
information on the measurement site see for exampleO’Dowd et al.(2001). The TDMA sampling was done from the height of 10mand some tens of meters from the shoreline. These measurements were part of the PARFORCE campaigns in September 1998 and June 1999 (Väkevä et al.,2001).
3. Results
20
3.1. Characteristic features and statistical properties 3.1.1. Urban site
Data measured in Helsinki during the two weeks in May 1998 show that 10nm parti-cles were mostly internally mixed, with growth factors varying from about 0.95 to 1.36 (Fig. 1). The daily mean and mean of maximum and minimum values are presented
ACPD
1, 379–409, 2001 Hygroscopicity of nucleation mode particles Väkevä et al. Title Page Abstract Introduction Conclusions References Tables Figures J I J I Back Close Print Version Interactive Discussion c EGS 2001 in Table 1. Externally mixed particles were observed in 3.5% of all observations. Theobserved hygroscopic properties varied with time, but no obvious diurnal cycle was visible. Neither did air mass origin seem to affect the observed growth factors. During two or several days with similar air mass trajectories the hygroscopic behaviour of nu-cleation mode particles varied considerably, and no air mass history -specific features
5
could be determined. For the urban site the air mass trajectories were calculated us-ing NOAA Air Resources Laboratory’s web site (http://www.arl.noaa.gov/ss/
models/hysplit.html).
Winter time measurements (December 1999) in Helsinki showed most of the time externally mixed particles. The 10nmparticles were externally mixed with two modes of
10
hygroscopic growth in 71% of all observations (Fig. 2, and Table 2) and 20nmparticles in 87% of all observations (Fig. 3, and Table 2). Three 20 nm growth modes i.e. three different particle compositions were observed 2% of time. As shown in Table 2, 10nm
data during the measurement period can be described with two growth factors: mean growth factor 1.04 (std 0.03, observed 81% of time) and mean growth factor 1.26 (std
15
0.05, observed 90% of time). The observed 20nm growth factors can be categorised as follows: mean growth factor 1.04, std 0.02, was observed 99% of time, mean growth factor 1.27, std 0.06, was observed 91% of time.
The winter time growth factors of 10nm particles ranged between 0.95–1.4 and growth factors of 20nmparticles varied between 0.97–1.5. Just as for the spring time
20
observations, the growth factors did not seem to correlate with air mass history. The systematic occurrence of two hygroscopic growth modes during winter time indicates two (or more) different sources of particles both being similar in magnitude.
3.1.2. Forest site
In Hyytiälä, the measurements were undertaken at three time periods: April–May 1998
25
(data for 10 and 20nm particles), July–August 1998 (20nm particles), March–April 1999 (data for 10nmand 20nmparticles). Several other dry sizes were studied during the Biofor campaign but only 10nmand 20nmdata is presented in this paper.
ACPD
1, 379–409, 2001 Hygroscopicity of nucleation mode particles Väkevä et al. Title Page Abstract Introduction Conclusions References Tables Figures J I J I Back Close Print Version Interactive Discussion c EGS 2001 Spring time growth factors off all measured sizes (also larger than 20nm, seeHämeriet al. (2001b)) had a clear diurnal cycle. In general higher growth factors were detected at day time and lower during nights. The diurnal variations were particularly clear dur-ing days with Arctic air mass origin, as can be seen in Fig. 4. The daily mean highest and mean lowest growth factors for these days are presented in Table 3. For a detailed
5
meteorological study of Biofor campaigns seeNilsson et al.(2001a) andNilsson et al. (2001b). In air masses that were traced back to Great Britain or Central Europe ex-ternally mixed 20nmparticles were often observed. The frequency of observations of externally mixed particles seemed to increase the larger the measured size, e.g. in 1999 10nm particles were externally mixed in 4%, 20nm particles in 25%, 50nm in
10
40% and 109nmin 83% of all observations (Hämeri et al.,2001b). The growth factors of 10nmparticles ranged from 0.98 to 1.65, and those of 20nmfrom 0.99 to 1.81.
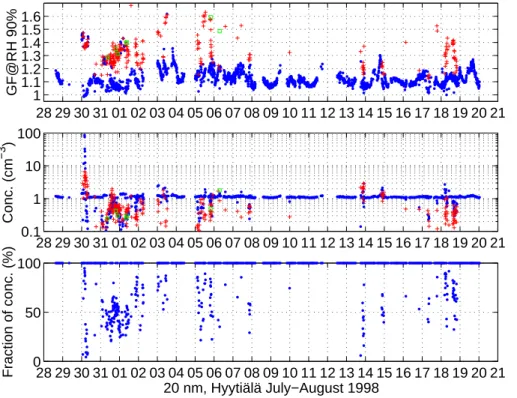
In August 1998 (also few days in July) only 20nmparticles were studied, due to the very rare observations of 10nmparticles. Growth factors varied between 0.99 and 1.70 as can be seen in Fig. 5. Externally mixed particles were observed 13% of time, and
15
there were also few incidents with three types of particles (0.3% of all measurements). Again observations of externally mixed particles were mostly connected to air masses arriving from polluted areas south-west.
3.1.3. Urban background site
Luukki measurement site which is located near Helsinki is strongly influenced by the
20
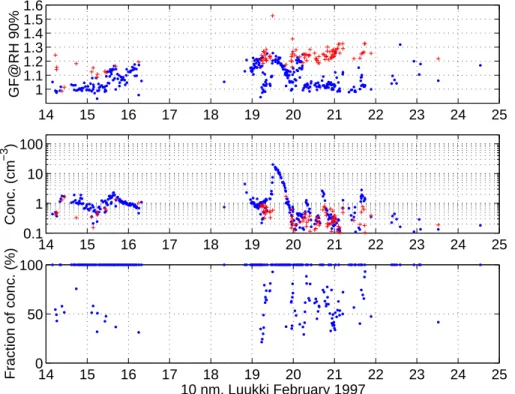
local pollution in the area. However, during the periods of clean air masses originating typically north, the particle properties are expected to be similar to those at remote areas of Finland. During the few days of TDMA measurements in Luukki in February 1997, days with particle hygroscopic properties similar to the other measurement sites in Finland were observed (Fig. 6). A few days resembled Helsinki May 1998
measure-25
ments. During the measurement period, new particle formation events similar to the ones observed in Hyytiälä forest field station were observed and the growth factors and their temporal variations during these events resembled the ones detected in Hyytiälä
ACPD
1, 379–409, 2001 Hygroscopicity of nucleation mode particles Väkevä et al. Title Page Abstract Introduction Conclusions References Tables Figures J I J I Back Close Print Version Interactive Discussion c EGS 2001 (Hämeri et al.,2001b). These new particle formation events have been described inVäkevä et al.(2000). 3.1.4. Coastal site
The detected growth factors at the Mace Head measurement station were clearly dic-tated by the origin of studied air mass (Väkevä et al.,2001). When clean marine air was
5
measured (westerly air flow) pre-existing 20nmparticles were hygroscopic with growth similar to or slightly less than pure ammonium sulphate particles. On the other hand, the 10nm(and 8nm) particles nucleated during the new particle formation events were hydrofobic, or had growth factors close to 1.0. These particles were observed in west-erly air flow during low tide periods. In air masses that entered the measurement site
10
through several coastal source regions during low tide periods, but were still of marine origin, diurnal cycle of the hygroscopic behaviour similar to Hyytiälä nucleation event days was detected.
In September 1998 growth factors of 10nmparticles varied between 0.99 and 1.59, and in June 1999 10nmgrowth factors varied between 0.97 and 1.97, and 20nmgrowth
15
factors between 0.99 and 1.78. Also externally mixed particle populations were de-tected: during 1998 10nm 6% of time, and during 1999 10nm 3% and 20nm 8% of time. A general conclusion was drawn that the externally mixed particles were connected to polluted air masses. The 20nm particles affected by fresh combustion sources were non- or slightly hygroscopic, and the background marine particles more
20
hygroscopic. On the other hand, freshly nucleated 10nmparticles that were formed in polluted air masses were hygroscopic. This was explained by abundant sulphuric acid concentrations (Berresheim et al.,2001).
3.2. Frequency of occurrence
In Figs. 7 (10nm data) and 8 (20nm data) the frequency distributions of the observed
25
ACPD
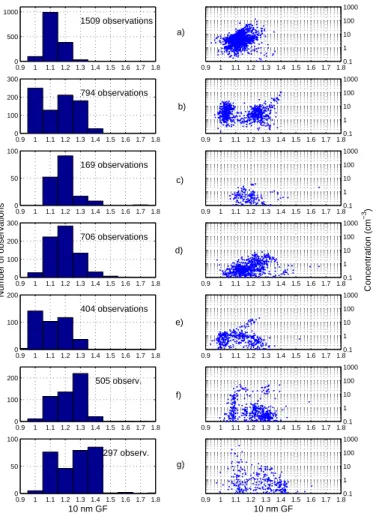
1, 379–409, 2001 Hygroscopicity of nucleation mode particles Väkevä et al. Title Page Abstract Introduction Conclusions References Tables Figures J I J I Back Close Print Version Interactive Discussion c EGS 2001 versus DMA2 concentrations for each measurement. This is to show that, for instancefor 10nmparticles in Luukki growth factor 1 was observed most frequently, but particles with growth factor of about 1.2 were most abundant in number concentration. Simi-larly also for Hyytiälä and Helsinki 1998 measurements; concentration weighed mean growth factors (over the whole measurement period) tend to be bigger than judging by
5
just the number of observations. In all the above mentioned sites the diurnal variations were significant and a relatively wide range of growth factors were observed daily. High growth factors were mostly observed during only few day time hours during which also the concentrations were at their highest.
Comparison of 10nmmeasurements performed in Helsinki in May and in December
10
reveals major differences: in May "less hygroscopic" particles were observed system-atically, and in December particles were externally mixed. What is noteworthy in Fig. 7 is that there seems to be a gap in December in just those growth factors that are most abundant in May. The anthropogenic sources in an urban area differ considerably be-tween winter and summer owing to heating of buildings. However, the heat energy
15
production in Helsinki downtown area is organised centrally in few power plants having high stacks and the emissions are detected in downtown area only with certain wind direction. The emissions from traffic are likely to be similar (although perhaps not equal in magnitude) during the whole year, but natural sources undoubtedly differ between summer and winter. Also meteorological conditions and atmospheric chemistry may
20
significantly alter the behaviour of precursor gases and condensable vapours between summer and winter time measurement periods.
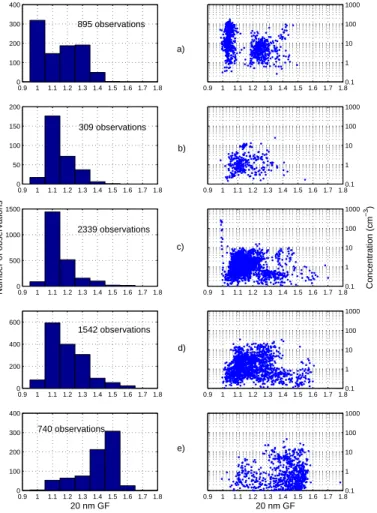
Hygroscopic properties of 20nm particles (Fig. 8) have clear differences between the measurement sites: hygroscopic particles in Mace Head (coastal site) have higher growth factors than in the other sites. The observed growth factors indicate that these
25
particles contain inorganic salt compound (growth factor similar to ammonium sul-phate). On the other hand, Helsinki is also situated on the shoreline, and therefore the observed hygroscopic particles might contain similar compounds to the Mace Head particles. The observed growth factors of hygroscopic particles in Helsinki are,
how-ACPD
1, 379–409, 2001 Hygroscopicity of nucleation mode particles Väkevä et al. Title Page Abstract Introduction Conclusions References Tables Figures J I J I Back Close Print Version Interactive Discussion c EGS 2001 ever, smaller than in Mace Head. This does not necessarily rule out similarities: saltparticles in Helsinki might be coated with e.g. hydrocarbons from traffic and other com-bustion processes that affect their water solubility (Hansson et al., 1998; Xiong et al., 1998). Another potential explanation is that the higher growth mode in Helsinki results from ageing: originally less-hygroscopic particles tend to gain soluble properties when
5
aged (e.g.Cocker et al.,2001;Swietlicki et al.,2000). If this is the case also the 10nm
particles (or the vapours that condensed on both particle sizes) have undergone a similar ageing process, since in December 1999 both 10 and 20nmparticles are very similar with respect to hygroscopic properties. Unfortunately UF-TDMA measurements of 20nmparticles are not available in Helsinki during summer time.
10
The hygroscopic properties of aerosol population are typically used as input values in state-of-art aerosol dynamical models (see Pirjola and Kulmala, 2001) and cloud microphysical models (seeKulmala et al.,1996). Therefore typical growth factors, and number concentrations of different hygroscopic modes are given in Tables 1, 2 and 3. The two mode behaviour in urban air can clearly be seen from Table 2 for both 10 and
15
20nm particles. On the other hand the behaviour of 10nmand 20nmin coastal envi-ronment differs from each other, as 10nmparticles are affected by nucleation bursts, while 20nm particles are not. During the nucleation event days in forest site the less hygroscopic mode is pronounced as a function of size (Table 3). This is probably due to the condensation of less hygroscopic organic compounds during the formation and
20
growth events (Kulmala et al.,2001).
4. Summary and conclusions
In all of the studied sites a background population of nucleation mode particles was observed frequently, but also a number of particle formation events was observed. In an urban site the anthropogenic fraction of nucleation mode particles dominates the
25
lower end of the size distribution. The characteristics of the nucleation events are described earlier in e.g. Mäkelä et al.(1997), O’Dowd et al. (1998) and Väkevä et al.
ACPD
1, 379–409, 2001 Hygroscopicity of nucleation mode particles Väkevä et al. Title Page Abstract Introduction Conclusions References Tables Figures J I J I Back Close Print Version Interactive Discussion c EGS 2001 (2000).Summarising all the field data, the previous classification of four (main) hygroscopic growth modes is applicable also for nucleation mode particles of 10nm in diameter. However, as the Kelvin correction for curvature is significant at this size range, the absolute values of the growth factors are lower than for accumulation mode particles.
5
Based on the observations presented in this paper we conclude, that the major growth classes for 10nm particles are: hydrofobic (GF 1), less-hygroscopic (GF 1.05–1.2), more hygroscopic (GF 1.2–1.4) and sea-salt (GF larger than 1.4). The accuracy of these values is about±0.05 inGF. In addition, it has to be noted that these values are based on a limited number of sites and measurement periods and further investigations
10
are likely to specify these values.
Low growth factors were occasionally detected at all sites, but especially connected with the urban measurements growth factors lower that 1 were observed. Growth fac-tors lower than unity could be explained by soot or other aggregated particles that collapse when interacting with water vapour at high relative humidities. On the other
15
hand, the values lower than 1 are typically within the accuracy of the experiments. The growth factors that are only slightly larger that unity may partly be explained by adsorption of layers of water molecules on the particle surface. This phenomenon is more pronounced for small particle sizes and is experimentally verified for 10–20nm
particles using a TDMA setup. Adsorption of water on nucleation mode particles using
20
UF-TDMA data is discussed in detail byRomakkaniemi et al.(2001).
Based on the TDMA studies 10nm and 20nm particles have similar hygroscopic properties in urban (winter time) environment. Both the magnitude and the bimodal structure of the hygroscopic growth factors are similar for both sizes, when Kelvin effect due to the curvature of the particle surface is taken into account. The likely explanation
25
is that most of the time both particle sizes belong to the same size mode and have same origin and composition.
In forest environment the diurnal behaviour with higher growth factors at day time and low at night time is also similar for both 10nmand 20nmparticles. As in urban site, also
ACPD
1, 379–409, 2001 Hygroscopicity of nucleation mode particles Väkevä et al. Title Page Abstract Introduction Conclusions References Tables Figures J I J I Back Close Print Version Interactive Discussion c EGS 2001 in forest environment both particle sizes belonged to the same size mode most of thetime. During the most intensive nucleation events, the particle size of the nucleation mode was in the beginning below 20nm. However, the condensable vapour that grew the nucleated particles into observable size of 10nmwas probably condensing also on the surfaces of the pre-existing particles, as during those periods the 20nm particles
5
showed also hygroscopic properties similar to 10nmparticles.
The coastal measurements showed systematically that the 20nmparticles were hy-groscopic, whereas the freshly nucleated 10nm particles were non-hygroscopic. The coastal observations during which 10nm and 20nm particles were clearly of different composition, are explained by different sources and ages of the particles. Particles that
10
are formed during the coastal nucleation events consist of hydrofobic material. Whether this is the compound that originally was responsible for the formation of the particles, or if some hydrofobic vapour condensed on the stable clusters and grew them to 10nm
particles, can not be distinguished based on TDMA measurements. During the most intense nucleation events the growth factors of 20nm particles were also seen to
de-15
crease. This is an indication that there was a very strong source of hydrofobic vapour available, and the vapour also condensed on pre-existing particles.
In the coastal site, Mace Head, the growth factors were obviously affected by air mass history: Nucleation events in clean coastal air produced particles with low growth factors. When air mass was possibly influenced by several source regions of
condens-20
able gases - yet clean air - diurnal temporal variations of growth factors resembled measurements in the forest site. When polluted air was detected growth factors var-ied just like in Helsinki during May 1998 period. It should also be noted that during September 1998 measurements in Mace Head smaller growth factors were detected than in June 1999. This difference is explained possibly by differences in the
condens-25
ing vapours or meteorological conditions. This assumption was also backed by the CCNC measurements performed at the site during both the periods: in June Aitken and accumulation mode particles were also more soluble than the ones measured in September (Väkevä et al.,2001).
ACPD
1, 379–409, 2001 Hygroscopicity of nucleation mode particles Väkevä et al. Title Page Abstract Introduction Conclusions References Tables Figures J I J I Back Close Print Version Interactive Discussion c EGS 2001 At the forest site, Hyytiälä, air mass history seemed to have an effect on growthfactors. This was most evident in observations of external mixing. When air masses originated from south-west (especially from western Atlantic over Great Britain) exter-nally mixed 20nmparticles were often detected. When backward trajectories originated from Great Britain, the growth factors of the more hygroscopic mode were of the same
5
magnitude as in Mace Head. When external mixing was observed in air masses traced back to Central Europe, both hygroscopic modes showed temporal variations. On the average particles belonging to both modes were more soluble during day time than at night. One possible explanation for this is chemical transformation of the composition of the particles or condensing vapours due to oxidation and air chemistry. The origin
10
of air masses seemed crucial also for the nucleation events, which mostly occurred in Arctic air (Nilsson et al.,2001b). However, diurnal pattern of hygroscopic properties of nucleation mode particles (10nm) was detected even during days with no observable new particle formation.
Acknowledgements. The financial support from European Commission Environment and
Cli-15
mate Programme contracts ENV4-CT97-0405 (BIOFOR) and ENV4-CT97-0526 (PARFORCE) are acknowledged.
References
Berresheim, H., Elste, T., Tremmel, H. G., O’Dowd, C. D., Allen, A. G., Hansson, H.-C., Rosman, K., Dal Maso, M., Mäkelä, J. M., and Kulmala M.: Gas-Aerosol relationships of H2SO4, MSA,
20
and OH: Observations in the Coastal Marine Boundary Layer at Mace Head, Ireland, J. Geophys. Res., in press, 2001. 390
Birmili, W. and Wiedensohler, A.: New particle formation in the continental boundary layer: Meteorological and gas phase parameter influence, Geophys. Res. Lett., 27, 3325–3328, 2000. 381
25
Buzorius, G., Hämeri, K., Pekkanen, J., and Kulmala, M.: Spatial variation of aerosol number concentration in Helsinki city, Atmos. Environ., 33, 553–565, 1999. 387
ACPD
1, 379–409, 2001 Hygroscopicity of nucleation mode particles Väkevä et al. Title Page Abstract Introduction Conclusions References Tables Figures J I J I Back Close Print Version Interactive Discussion c EGS 2001Cocker , D. R., Whitlock, N. E., Flagan, R. C., and Seinfeld, J.: Hygroscopic properties of Pasadena, California Aerosol, Aerosol Sci. Technol., 35, 637–647, 2001. 382,392
Covert, D. S. and Heintzenberg, J.: Size distributions and chemical properties of aerosol at Ny Ålesund, Svalbard, Atmos. Environ., 27A, 2989–2997, 1993. 381
Djikaev, Y. S., Bowles, R., Reiss, H., Hämeri, K., Laaksonen, A., Väkevä, M.: Theory of size
5
dependent deliquescence of nanoparticles: Relation to heterogeneous nucleation and com-parison with experiments, J. Phys. Chem. B, 105, 7708–7722, 2001. 381
Hansson, H.-C., Wiedensohler, A., Koloutsou-Vakakis, S., Hämeri, K., and Orsini, D.: NaCl aerosol particle hygroscopicity dependence on mixing with organic compounds, J. Atmos. Chem., 31, 321–346, 1998. 392
10
Hämeri, K., Kulmala, M., Aalto, P., Leszczynski, K., Visuri, R., and Hämekoski, K.: The in-vestigations of aerosol particle formation in urban background area of Helsinki, Atmospheric Research, 41, 281–298, 1996. 387
Hämeri, K., Väkevä, M., Hansson, H.-C., and Laaksonen, A.: Hygroscopic growth of ultrafine ammonium sulphate aerosol measured using an ultrafine tandem differential mobility
anal-15
yser, J. Geophys. Res., 105, 22 231–22 242, 2000. 381,383,385
Hämeri, K., Laaksonen, A., Väkevä, M., and Suni, T.: Hygroscopic growth of ultrafine sodium chloride particles, J. Geophys. Res., 106, 20 749–20 758, 2001a. 381
Hämeri, K., Väkevä, M., Aalto, P. P., Kulmala, M., Swietlicki, E., Zhou, J., Seidl, W., Becker, E., and O’Dowd, C. D.: Hygroscopic and CCN properties of aerosol particles in boreal forest,
20
Tellus, 53B, 359–379, 2001b. 384,387,389,390
Kulmala, M., Korhonen, P., Vesala, T., Hansson, H.-C., Noone, K., and Svenningsson, B.: The effect of hygroscopicity on cloud droplet formation, Tellus, 48B, 347–360, 1996. 392
Kulmala, M., Hämeri, K., Aalto, P. P., Mäkelä, J. M., Pirjola, L., Nilsson, E. D., Buzorius, G., Rannik, Ü., Dal Maso, M., Seidl, W., Hoffmann, T., Janson, R., Hansson, H.-C., Viisanen, Y.,
25
Laaksonen, A., and O’Dowd, C. D.: Overview of the international project on biogenic aerosol formation in the boreal forest (BIOFOR), Tellus, 53B, 324–343, 2001. 387,392
McMurry, P. H. and Stolzenburg, M. R.: On the sensitivity of paricle size to relative humidity for Los Angeles aerosols, Atmos. Environ., 23, 497–507, 1989. 381
Mäkelä, J. M., Aalto, P., Jokinen, V., Pohja, T., Nissinen, A., Palmroth, S., Markkanen, T.,
Seitso-30
nen, K., Lihavainen, H., and Kulmala, M.: Observations of ultrafine aerosol particle formation and growth in boreal forest, Geophys. Res. Lett., 24, 1219–1222, 1997. 381,387,392
continen-ACPD
1, 379–409, 2001 Hygroscopicity of nucleation mode particles Väkevä et al. Title Page Abstract Introduction Conclusions References Tables Figures J I J I Back Close Print Version Interactive Discussion c EGS 2001tal boundary layer evolution, convection, turbulence and entrainment on aerosol formation, Tellus, 53B, 441–461, 2001a. 389
Nilsson, E. D., Paatero, J., and Boy, M.: Effects of air masses and synoptic weather on aerosol formation in the continental boundary layer, Tellus, 53B, 462–478, 2001b. 389,395
O’Dowd, C. D., Geever, M., Hill, M. K., Smith, M. H., and Jennings, S. G.: New particle formation
5
and spatial scales in the clean marine coastal environment, Geophys. Res. Lett., 25, 1661– 1664, 1998. 381,392
O’Dowd, C. D., Hämeri, K., Mäkelä, J. M., Väkevä, M., Aalto, P. P., de Leeuw, G., Kunz, G. J., Becker, E., Hansson, H.-C., Allen, A. G., Harrison, R. M., Berresheim, H., Kleefeld, C., Geever, M., Jennings, S. G., and Kulmala, M.: Coastal new particle formation:
Environ-10
mental conditions and aerosol physico-chemical characteristics during nucleation bursts, J. Geophys. Res., in press, 2001. 387
Pirjola, L. and Kulmala, M.: Development of particle size and composition distributions with a novel aerosol dynamics model, Tellus, 53B, 491–509, 2001. 392
Romakkaniemi, S., Hämeri, K., Väkevä, M., and Laaksonen, A.: Adsorption of water on 8–
15
15 nmNaCland(NH4)2SO4aerosols measured using an ultrafine tamdem diffrential mobility
analyzer, J. Phys. Chem. A, 105, 8183–8188, 2001. 393
Stratmann, F., Orsini, D., and Kauffeldt, Th.: Inversion algorithm for TDMA measurements, J. Aerosol Sci. 28 S1, 701–702, 1997. 384
Svenningsson, B., Hansson, H.-C., and Wiedensohler, A.: Hygroscopic growth of aerosol
par-20
ticles in the Po Valley, Tellus, 44B, 556–569, 1992. 381
Swietlicki, E., Zhou, J., Berg, O. H., Martinsson, B. G., Frank, G., Cederfelt, S.-I., Dusek, U., Berner, A., Birmili, W., Wiedensohler, A., Yuskiewicz, B., and Bower, K. N.: A closure study of sub-micrometer aerosol particle hygroscopic behaviour, Atmospheric Research, 50, 205– 240, 1999. 381
25
Swietlicki, E., Zhou, J., Covert, D. S., Hämeri, K., Busch, B., Väkevä, M., Dusek, U., Berg, O. H., Wiedensohler, A., Aalto, P., Mäkelä, J., Martinsson, B. G., Papaspiropoulos, G., Mentes, B., Frank, G., and Stratmann, F.: Hygroscopic properties of aerosol particles in the north-eastern Atlantic during ACE-2, Tellus, 52B, 201–227, 2000. 382,392
Väkevä, M., Hämeri, K., Puhakka, T., Nilsson, E. D., Hohti, H., and Mäkelä, J. M.: Effects of
30
meteorological processes on aerosol particle size distribution in an urban background area, J. Geophys. Res., 105, 9807–9821, 2000. 387,390,392
ACPD
1, 379–409, 2001 Hygroscopicity of nucleation mode particles Väkevä et al. Title Page Abstract Introduction Conclusions References Tables Figures J I J I Back Close Print Version Interactive Discussion c EGS 2001mode particles during nucleation bursts and in background air on west coast of Ireland, J. Geophys. Res., in press, 2001. 387,390,394
Yuskiewicz, B., Stratmann, F., and Kauffeldt, Th.: Resolution of a TDMA-inversion algorithm, J. Aerosol Sci., 29 S1, 1245–1246, 1998. 383,384
Xiong, J. Q., Zhong, M., Fang, C., Chen, L. C., and Lippmann, M.: Influence of organic films on
5
the hygroscopicity of ultrafine sulfuric acid aerosol, Environ. Sci. Technol., 32, 3536–3541, 1998. 392
BIOFOR: mist.helsinki.fi/Projects/Project.html#biofor 382
ACPD
1, 379–409, 2001 Hygroscopicity of nucleation mode particles Väkevä et al. Title Page Abstract Introduction Conclusions References Tables Figures J I J I Back Close Print Version Interactive Discussion c EGS 2001Table 1. Characteristics of the diurnal variations of growth factors of 10 nm particles
mea-sured at the urban site (Helsinki) in spring 1998. The mean value forGF is weighted with the concentration. The standard deviation is given in parenthesis.
MeanGF mean minGF Mean DMA2 conc (minGF) mean maxGF mean DMA2 conc (maxGF)
(cm−3) (cm−3)
ACPD
1, 379–409, 2001 Hygroscopicity of nucleation mode particles Väkevä et al. Title Page Abstract Introduction Conclusions References Tables Figures J I J I Back Close Print Version Interactive Discussion c EGS 2001Table 2. Observations of different growth modes in coastal site (Mace Head) during the
sum-mer measurements and urban site (Helsinki) during the winter 1999 measurements. The data is characterised with two modes. The presented concentrations are measured after DMA2, ambient concentrations are approximately two orders of magnitude higher. Ext. Mix = fre-quency of observations of externally mixed particles (fraction of all observations), MeanGFx=
mean growth factor of the mode, Mean conc = mean concentration of meanGF measured after DMA2, Of total conc = fraction of the total concentration (measured after DMA2) over the whole measurement period, Of total obs = fraction of all observations during the whole measurement period.
10 nm ext. mix. meanGF1 mean DMA2 of total of all obs. meanGF2 Mean DMA2 of total of total obs. conc. (cm−3) conc. conc. (cm−3) conc.
Coastal 1998 6% 1.07 4.43 31% 25% 1.27 2.31 70% 74% Coastal 1999 3% 1.10 14.50 80% 28% 1.33 1.40 20% 73% Urban 1999 71% 1.04 1.35 47% 81% 1.26 1.35 53% 90% 20 nm ext. mix. meanGF1 mean DMA2 of total of all obs. meanGF2 Mean DMA2 of total of total obs.
conc. (cm−3) conc. conc. (cm−3) conc. Coastal 1999 8% 1.11 0.91 4% 8% 1.43 2.11 96% 92% Urban 1999 87% 1.04 1.50 52% 99% 1.27 1.50 48% 91%
ACPD
1, 379–409, 2001 Hygroscopicity of nucleation mode particles Väkevä et al. Title Page Abstract Introduction Conclusions References Tables Figures J I J I Back Close Print Version Interactive Discussion c EGS 2001Table 3. Characteristics of the diurnal variations of growth factors of 10 nm and 20 nm particles
measured at the forest site (Hyytiälä) in spring 1999 over a time period of Arctic air masses. During the period the new particle events took place on April 4.-6., 8., 10. and 12.-13.
Forest 1999 mean minGF Mean DMA2 conc mean maxGF mean DMA2 conc
Arctic air (3.4-13.4.1999) cm−3 cm−3
10 nm 1.08 0.35 1.28 2.12
ACPD
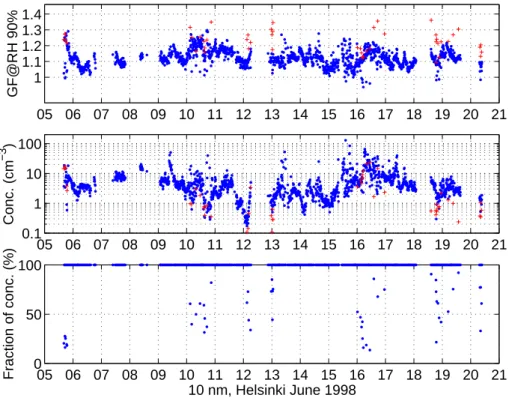
1, 379–409, 2001 Hygroscopicity of nucleation mode particles Väkevä et al. Title Page Abstract Introduction Conclusions References Tables Figures J I J I Back Close Print Version Interactive Discussion c EGS 2001 05 06 07 08 09 10 11 12 13 14 15 16 17 18 19 20 21 1 1.1 1.2 1.3 1.4 GF@RH 90% 05 06 07 08 09 10 11 12 13 14 15 16 17 18 19 20 21 0.1 1 10 100 Conc. (cm −3 ) 05 06 07 08 09 10 11 12 13 14 15 16 17 18 19 20 21 0 50 100 Fraction of conc. (%) 10 nm, Helsinki June 1998Fig. 1. TDMA data of 10nmparticles measured in Helsinki May 1998. On top growth factors
(blue) at 90% relative humidity (the second mode during external mixing is plotted with red symbol), in the middle concentrations measured after DMA2, and on the bottom concentration fraction of particles in the lower growth mode when external mixing was observed.
ACPD
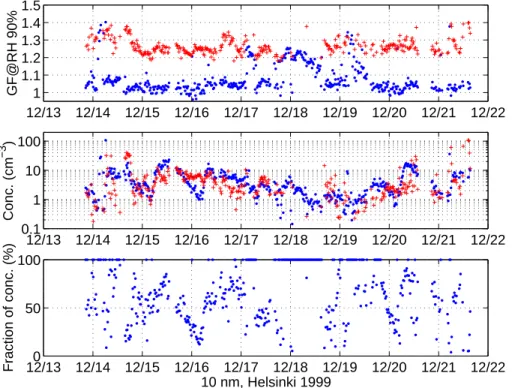
1, 379–409, 2001 Hygroscopicity of nucleation mode particles Väkevä et al. Title Page Abstract Introduction Conclusions References Tables Figures J I J I Back Close Print Version Interactive Discussion c EGS 2001 12/13 12/14 12/15 12/16 12/17 12/18 12/19 12/20 12/21 12/22 1 1.1 1.2 1.3 1.4 1.5 GF@RH 90% 12/13 12/14 12/15 12/16 12/17 12/18 12/19 12/20 12/21 12/22 0.1 1 10 100 Conc. (cm −3 ) 12/130 12/14 12/15 12/16 12/17 12/18 12/19 12/20 12/21 12/22 50 100 Fraction of conc. (%) 10 nm, Helsinki 1999Fig. 2. TDMA data of 10nmparticles in Helsinki December 1999. On top growth factors (blue)
at 90% relative humidity (the second mode during external mixing is plotted with red symbol), in the middle concentrations measured after DMA2, and on the bottom concentration fraction of particles in the lower growth mode when external mixing was observed.
ACPD
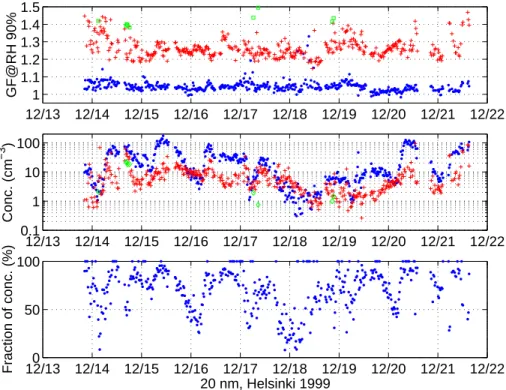
1, 379–409, 2001 Hygroscopicity of nucleation mode particles Väkevä et al. Title Page Abstract Introduction Conclusions References Tables Figures J I J I Back Close Print Version Interactive Discussion c EGS 2001 12/13 12/14 12/15 12/16 12/17 12/18 12/19 12/20 12/21 12/22 1 1.1 1.2 1.3 1.4 1.5 GF@RH 90% 12/13 12/14 12/15 12/16 12/17 12/18 12/19 12/20 12/21 12/22 0.1 1 10 100 Conc. (cm −3 ) 12/130 12/14 12/15 12/16 12/17 12/18 12/19 12/20 12/21 12/22 50 100 Fraction of conc. (%) 20 nm, Helsinki 1999Fig. 3. TDMA data of 20nmparticles in Helsinki December 1999. On top growth factors (blue)
at 90% relative humidity (the second mode during external mixing is plotted with red symbol and the third mode with green symbol), in the middle concentrations measured after DMA2, and on the bottom concentration fraction of particles in the lower growth mode when external mixing was observed.
ACPD
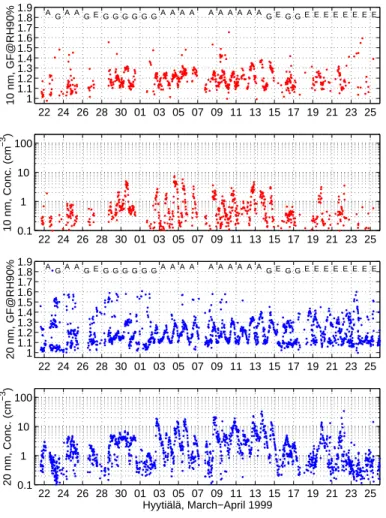
1, 379–409, 2001 Hygroscopicity of nucleation mode particles Väkevä et al. Title Page Abstract Introduction Conclusions References Tables Figures J I J I Back Close Print Version Interactive Discussion c EGS 2001 22 24 26 28 30 01 03 05 07 09 11 13 15 17 19 21 23 25 1 1.1 1.2 1.3 1.4 1.5 1.6 1.7 1.8 1.9 10 nm, GF@RH90% AGA AGEG G G G G GA A A A A A A A A AGEG GE E E E E E E E 22 24 26 28 30 01 03 05 07 09 11 13 15 17 19 21 23 25 0.1 1 10 100 10 nm, Conc. (cm −3 ) 22 24 26 28 30 01 03 05 07 09 11 13 15 17 19 21 23 25 1 1.1 1.2 1.3 1.4 1.5 1.6 1.7 1.8 1.9 20 nm, GF@RH90% AGA AGEG G G G G GA A A A A A A A A AGEG GE E E E E E E E 22 24 26 28 30 01 03 05 07 09 11 13 15 17 19 21 23 25 0.1 1 10 100 20 nm, Conc. (cm − 3 ) Hyytiälä, March−April 1999Fig. 4. Growth factors and
con-centrations of 10nm(top two fig-ures) and 20nmparticles (lower two figures) in Hyytiälä March and April 1999. Also indicated are the air mass origins: A = Arctic, E = Middle Europe, G = Great Britain.
ACPD
1, 379–409, 2001 Hygroscopicity of nucleation mode particles Väkevä et al. Title Page Abstract Introduction Conclusions References Tables Figures J I J I Back Close Print Version Interactive Discussion c EGS 2001 28 29 30 31 01 02 03 04 05 06 07 08 09 10 11 12 13 14 15 16 17 18 19 20 21 1 1.1 1.2 1.3 1.4 1.5 1.6 GF@RH 90% 28 29 30 31 01 02 03 04 05 06 07 08 09 10 11 12 13 14 15 16 17 18 19 20 21 0.1 1 10 100 Conc. (cm −3 ) 28 29 30 31 01 02 03 04 05 06 07 08 09 10 11 12 13 14 15 16 17 18 19 20 21 0 50 100 Fraction of conc. (%) 20 nm, Hyytiälä July−August 1998Fig. 5. TDMA data of 20nmparticles in Hyytiälä July and August 1999. On top growth factors
(blue) at 90% relative humidity (the second mode during external mixing is plotted with red symbol and the third mode with green symbol), in the middle concentrations measured after DMA2, and on the bottom concentration fraction of particles in the lower growth mode (denoted with the filled marker) when external mixing was observed.
ACPD
1, 379–409, 2001 Hygroscopicity of nucleation mode particles Väkevä et al. Title Page Abstract Introduction Conclusions References Tables Figures J I J I Back Close Print Version Interactive Discussion c EGS 2001 14 15 16 17 18 19 20 21 22 23 24 25 1 1.1 1.2 1.3 1.4 1.5 1.6 GF@RH 90% 14 15 16 17 18 19 20 21 22 23 24 25 0.1 1 10 100 Conc. (cm −3 ) 14 15 16 17 18 19 20 21 22 23 24 25 0 50 100 Fraction of conc. (%) 10 nm, Luukki February 1997Fig. 6. TDMA data of 10nmparticles in Luukki February 1999 (the urban background site).
On top growth factors (blue) at 90% relative humidity (the second mode during external mixing is plotted with red symbol), in the middle concentrations measured after DMA2, and on the bottom concentration fraction of particles in the lower growth mode (denoted with the filled marker) when external mixing was observed.
ACPD
1, 379–409, 2001 Hygroscopicity of nucleation mode particles Väkevä et al. Title Page Abstract Introduction Conclusions References Tables Figures J I J I Back Close Print Version Interactive Discussion c EGS 2001 0.9 1 1.1 1.2 1.3 1.4 1.5 1.6 1.7 1.8 0 100 200 404 observations 0.9 1 1.1 1.2 1.3 1.4 1.5 1.6 1.7 1.8 0 50 100 169 observations 0.9 1 1.1 1.2 1.3 1.4 1.5 1.6 1.7 1.8 0 500 1000 1509 observations 0.9 1 1.1 1.2 1.3 1.4 1.5 1.6 1.7 1.8 0 100 200 505 observ. 0.9 1 1.1 1.2 1.3 1.4 1.5 1.6 1.7 1.8 0 100 200 300 Number of observations 706 observations 0.9 1 1.1 1.2 1.3 1.4 1.5 1.6 1.7 1.8 0 100 200 300 794 observations 0.9 1 1.1 1.2 1.3 1.4 1.5 1.6 1.7 1.8 0 50 100 10 nm GF 297 observ. 0.9 1 1.1 1.2 1.3 1.4 1.5 1.6 1.7 1.80.1 1 10 100 1000 0.9 1 1.1 1.2 1.3 1.4 1.5 1.6 1.7 1.80.1 1 10 100 1000 0.9 1 1.1 1.2 1.3 1.4 1.5 1.6 1.7 1.80.1 1 10 100 1000 0.9 1 1.1 1.2 1.3 1.4 1.5 1.6 1.7 1.80.1 1 10 100 1000 0.9 1 1.1 1.2 1.3 1.4 1.5 1.6 1.7 1.80.1 1 10 100 1000 Concentration (cm −3 ) 0.9 1 1.1 1.2 1.3 1.4 1.5 1.6 1.7 1.80.1 1 10 100 1000 0.9 1 1.1 1.2 1.3 1.4 1.5 1.6 1.7 1.80.1 1 10 100 1000 10 nm GF a) d) b) c) e) f) g)Fig. 7. Frequency of
occur-rence of different growth fac-tors (left) and growth facfac-tors ver-sus measured DMA2 concen-trations (right) for 10nm parti-cles. (a) Helsinki May 1998
(b) Helsinki December 1999
(c) Hyytiälä April–May 1998 (d)
Hyytiälä March–April 1999 (e)
Luukki February 1997 (f) Mace Head Sepember 1998(g) Mace Head June 1999.
ACPD
1, 379–409, 2001 Hygroscopicity of nucleation mode particles Väkevä et al. Title Page Abstract Introduction Conclusions References Tables Figures J I J I Back Close Print Version Interactive Discussion c EGS 2001 0.9 1 1.1 1.2 1.3 1.4 1.5 1.6 1.7 1.8 0 50 100 150 200 309 observations 0.9 1 1.1 1.2 1.3 1.4 1.5 1.6 1.7 1.8 0 500 1000 1500 Number of observations 2339 observations 0.9 1 1.1 1.2 1.3 1.4 1.5 1.6 1.7 1.8 0 200 400 600 1542 observations 0.9 1 1.1 1.2 1.3 1.4 1.5 1.6 1.7 1.8 0 100 200 300 400 740 observations 20 nm GF 0.9 1 1.1 1.2 1.3 1.4 1.5 1.6 1.7 1.8 0 100 200 300 400 895 observations 0.9 1 1.1 1.2 1.3 1.4 1.5 1.6 1.7 1.80.1 1 10 100 1000 0.9 1 1.1 1.2 1.3 1.4 1.5 1.6 1.7 1.80.1 1 10 100 1000 Concentration (cm −3 ) 0.9 1 1.1 1.2 1.3 1.4 1.5 1.6 1.7 1.80.1 1 10 100 1000 0.9 1 1.1 1.2 1.3 1.4 1.5 1.6 1.7 1.80.1 1 10 100 1000 20 nm GF 0.9 1 1.1 1.2 1.3 1.4 1.5 1.6 1.7 1.80.1 1 10 100 1000 a) b) c) d) e)Fig. 8. Frequency of
occur-rence of different growth fac-tors (left) and growth facfac-tors ver-sus measured DMA2 concen-trations (right) for 20nm par-ticles. (a) Helsinki Decem-ber 1999(b)Hyytiälä April–May 1998 1998 (c) Hyytiälä July– August(d)Hyytiälä March–April 1999(e)Mace Head June 1999.