HAL Id: hal-00305106
https://hal.archives-ouvertes.fr/hal-00305106
Submitted on 6 Nov 2007
HAL is a multi-disciplinary open access
archive for the deposit and dissemination of
sci-entific research documents, whether they are
pub-lished or not. The documents may come from
teaching and research institutions in France or
abroad, or from public or private research centers.
L’archive ouverte pluridisciplinaire HAL, est
destinée au dépôt et à la diffusion de documents
scientifiques de niveau recherche, publiés ou non,
émanant des établissements d’enseignement et de
recherche français ou étrangers, des laboratoires
publics ou privés.
Determination of the historical variation of the trophic
state in lakes using sediment stratigraphies
G. Olli
To cite this version:
G. Olli. Determination of the historical variation of the trophic state in lakes using sediment
strati-graphies. Hydrology and Earth System Sciences Discussions, European Geosciences Union, 2007, 11
(6), pp.1747-1756. �hal-00305106�
Hydrol. Earth Syst. Sci., 11, 1747–1756, 2007 www.hydrol-earth-syst-sci.net/11/1747/2007/ © Author(s) 2007. This work is licensed under a Creative Commons License.
Hydrology and
Earth System
Sciences
Determination of the historical variation of the trophic state in lakes
using sediment stratigraphies
G. Olli
Department of Physical Geography and Quaternary Geology, Stockholm University, 10691, Stockholm, Sweden Received: 27 April 2007 – Published in Hydrol. Earth Syst. Sci. Discuss.: 21 June 2007
Revised: 19 September 2007 – Accepted: 5 October 2007 – Published: 6 November 2007
Abstract. Biogenic silica (BSi) and phosphorous (P) accumulation were investigated in sediment cores from Karlsk¨arsviken, a bay of Lake M¨alaren. The aim was to make use of BSi and P relations in sediment stratigraphies in order to investigate the historical nutrient trophy in a near shore lake environment since the Middle Ages, with focus on industrial times, and to evaluate anthropogenic influences on the bay’s trophic state. The BSi accumulation in the sed-iments is a better indicator of former nutrient pelagic trophy than P accumulation in sediments and for this reason a BSi inferred P (BSi-P) water concentration is calculated. This method enables the determination of the background total phosphorous (TP) concentration (which is related to the ref-erence conditions) in the investigated bay; this background TP is determined equal to 0.020–0.022 mg L−1. There is an increasing trend of BSi-P concentration in the bay since the Middle Ages to the present, about 0.025 mg L−1, with a small decrease in the inner bay section during the last decades. The P accumulation rate is not found to have changed since the 1960s and 1970s, which indicates that the P loading to Karlsk¨arsviken has not decreased. In Karlsk¨arsviken, the shallow inner section of the bay, where the water quality is dominated by loading from the bay catchment area, is less nutritious than the water in the outer section, which is in-fluenced by the main streams from the western part of Lake M¨alaren.
1 Introduction
In the global problem of eutrophication, phosphorus (P) plays a crucial part, as a limiting nutrient in freshwater lakes, especially in Temperate Zone waters (Lund, 1972; Reynolds, 1984; Harper, 1992; Farmer et al., 1993; Persson, 2001). In
Correspondence to: G. Olli
Sweden, for instance, regular monitoring has been performed in the basins of the big lakes since 1965 (Will´en, 1972). His-torical nutrient enrichments are found in the sediments, but to estimate P concentrations in the past water column, these enrichments have to be interpreted.
Chemical processes control P in water and sediments, as chemical precipitate, adsorption, complex formation and bio chemical reactions (Round, 1981; Bostr¨om et al., 1982). A consequence of these processes is that the P accumulation in sediments seldom reflects the P concentration in the con-temporary water column. However, P in the water column is important to know, because it commonly determines the biomass maxima of phytoplankton, so when P levels are en-hanced, algal growth, including silicon algae, diatoms, in-creases quickly (Andersson, 1994). In contrast to P, diatom frustules are indestructible in sediment, and consequently di-atom accumulation provides a better signal of contemporary P in water than the P sediment accumulation does. Diatom frustules are therefore accepted as a nutrient criterion, as long as the diatom production is limited by the P concentration in water (Stoermer, 1984; Schelske et al., 1983 and 1986; An-derson et al., 1993; Bennion et al., 1996; Renberg, 1999). In Lake M¨alaren, P is regarded to limit the vegetation (Persson et al.; 1990; SEPA, 1993).
Different model studies have been performed (ter Braak and van Dam, 1989; Bradshaw and Anderson, 2001) to deter-mine quantitatively the relationship of diatom species to to-tal phosphorous (DI-TP). Diatom species in sediments were used to reconstruct past P concentrations in water in a study in Bj¨orkfj¨arden, Lake M¨alaren, (Renberg, 1999). These re-sults gave to high values, 10–20 µg L−1, which probably is due to the particular diatom flora caused by the elongated creation of Lake M¨alaren and the brackish water inflows un-til modern times. This high uncertainty makes these models questionable to apply in Lake M¨alaren, as the P concentra-tions there oscillate between 20 and 40 µg P L−1. Schelske et al. (1983) have shown that the amount of diatom cells and
1748 G. Olli: Determination of the historical ´ . 6 5 4 3 2 1 Karlskärs-viken Public beach Marina 0 250 m LAKE MÄLAREN 59 25, N 17 40, 1d o o N 500 m Catchment area Main roads 59 25´ 17 41´ Ditches 1 2 viken viken 1c o o 64 60 15 20 0 200 km N . 1a o o o o SÖDERMANLAND UPPLAND VÄSTMANLAND 17 00 0 20 km 40´ 59 Karlskärs-viken Stockholm N. Björk-fjärden S. Björk-fjärden Färingsö ´ 17 30´ 59 40 17 30´ 17 00´ 59 10 B e r g s l a g e n 1b N ´ o o o o o o o
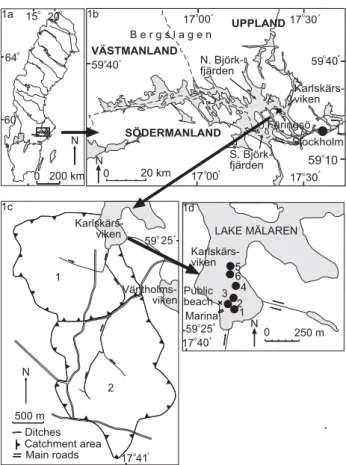
Fig. 1. (a) Sweden. (b) Lake M¨alaren with Karlsk¨arsviken to the
north of F¨arings¨o, (c) The catchment area to Karlsk¨arsviken and (d) Karlsk¨arsviken with the locations of the sampling points. (d) The tributary ditch is marked with one arrow and the rest of the for-mer strait between Karlsk¨arsviken and V¨antholmsviken with two arrows. (c) 1. The original catchment area. 2. The enlarged catch-ment area since 1951. Maps by Sven Karlsson.
biogenic silica (BSi) is almost identical in the sediments and used the percentages of BSi in sediments as criterion of nu-trient enrichment. BSi is also used in this study with the base material from the same ecosystem.
Diatoms have also other requirements than nutrients, like light and silica (R¨uhland and Smol, 2005; Mackay et al., 2005; Paus et al., 2005; Katsuki and Takahashi, 2005), and their presence in sediments can also be influenced by episodic events, such as storms. When lakes are covered by ice during long periods, diatom production is less than in years with hardly any ice and long and warm summers trigger the production. Silica is needed for diatom prosper-ity, and consequently a decrease in the abundance of diatoms can be due to silica deficit in the water column. Schelske et al. (1986) showed that a high BSi concentration and likewise high BSi TP−1(biogenic silica and total phosphorous ratio) or BSi BAP−1(biogenic silica and bio available phosphorous ratio) ratios in sediment stratigraphies followed by a decrease in BSi sediment concentration and in the ratios BSi TP−1or
BSi BAP−1indicate that the diatoms has not profited on the BAP as they had during the preceding period. This BSi de-crease simultaneous with a constant or inde-creased P, may be due to Si deficit in the water column.
The aim of this study is to make use of BSi and P relations in sediment stratigraphies in order to investigate the histori-cal trophic state in a near shore lake environment since the Middle Ages, with focus on industrial times, and to evalu-ate anthropogenic influences on the bay’s trophic stevalu-ate. This environment is here represented by Karlsk¨arsviken, a bay in Lake M¨alaren. The investigation period extends over the last 800 years, equal to the freshwater stage of Lake M¨alaren, but with particular focus on the last century and on establishing the background nutrient trophy in such a near shore environ-ment, which is expected to be dominated by the loading from its catchment area.
2 Materials and methods
2.1 Site description
Lake M¨alaren (Fig. 1b), located to the west of Stockholm, is characterized as eutrophic like all shallow lakes in the Euro-pean lowland areas (Milj¨odepartementet, 1991 and Foy and Withers, 1995). Lake M¨alaren has a large catchment area and a very long shoreline including numerous islands, bays, capes and points, with the consequence that the precipitation directly on the lake only accounts for about 10 % of the total water inflow to the lake (Will´en, 2001). The water quality of such a lake is sensitive to nutrient and pollutant loading from the tributaries (Persson, 2001). In the lowlands, the tributaries often are drainage ditches from arable land and densely populated areas. The main tributary to the studied bay, Karlsk¨arsviken (Fig. 1d), is a ditch from the south, to which waste water from about 160 households and drainage water from cultivated fields in the catchment area is con-nected (Fig. 1c). The average TP outflow from this ditch was
measured 1997–2000 and found to be 94 kg TP yr−1. Nota
bene parts of this settle in the macrophyte zone, from which no sample is collected.
This ditch was dug in 1951 and increased the drainage area of Karlsk¨arsviken to the double, which is about 560 ha today (Fig. 1c). The bay of Karlsk¨arsviken, situated to the north of the island of F¨arings¨o, covers about 20 ha and has an av-erage depth of about 3 m (2.90–3.45 m in the studied sites). The bottom gradient is <1%, which is common in the west-ern part of Lake M¨alaren. The eastwest-ern shore is rocky and steep but the western shore has a broad transition zone with reeds between the open water and the low lying shore mead-ows. At present, close to the outlet, the ditch is overgrown by macrophytes and both organic and inorganic phosphorous rich particles are deposited there as explained by Benoy and Kalff (1999).
G. Olli: Determination of the historical 1749
2.2 Methods overview
2.2.1 Transferring BSi into P water concentrations
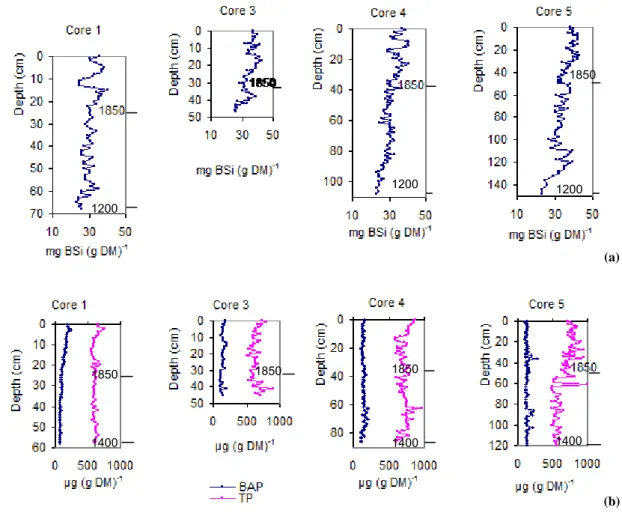
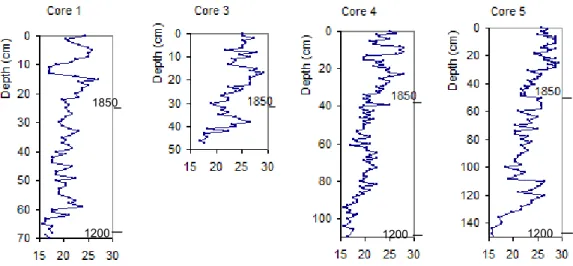
To establish the historical trophic states, the BSi concentra-tions were measured (Fig. 2a) in sediment cores taken in the bay and transferred into P concentration, denoted BSi-P. Schelske et al. (1986) have shown that there is a relationship between P concentration in water and BSi (with genesis di-atom frustules) concentration in sediments. The transfer here is based on the present trophic state, which is known both by the measured TP concentration in the water column and the stored BSi in the uppermost sediments (0–0.5 cm). The trans-fer factor is based on 12 measuring in Karlsk¨arsviken and in three surrounding bays. In all locations, the relation between
BSi mg L−1and TP µg L−1was about 0.00068. There was
no clear variability in this ratio (within 0.00001). It should be observed that this measuring was performed in modern time, i.e. during the period 2001–2002 and cores 5 and 6 in 2003. There is always an uncertainty to estimate past times values by values from modern time, but this transfer factor is at least based on measuring from the surroundings with about the same ecosystem.
To evaluate the anthropogenic nutrient influence, the back-ground P concentration has to be estimated. Lake M¨alaren never had a freshwater stage without anthropogenic impact, as the region was populated at the time, when the former brackish water bay was altered into a freshwater lake. The present P concentrations are compared to these from the mid-dle of the nineteenth century, which here are regarded as background P concentrations.
P concentrations in the sediments were also measured in order to calculate the BSi TP−1 and BSi BAP−1 ratios, as a decrease of BSi concentration in the sediments, reflecting pelagic and benthonic diatom production, may be caused by Si deficit in the water column, when the P supply is suf-ficient. A high BSi value indicates that all environmental factors controlling diatom growth are in the optimum range, e.g. the pelagic Si, P concentration, light and temperature. A depletion of pelagic Si (indicated by a decrease in BSi) may follow this optimum condition, if the Si reservoir in the water column is consumed and the recycling is slow, as it is years with low water outflow from the catchment area. Peaks in the above mentioned ratios at the same depth as a peak in BSi concentration followed by a decrease of these ratios may consequently be associated with pelagic Si deple-tion (Schelske et al., 1986), resulting in BSi concentradeple-tion decrease and a coinciding P concentration peak. At such occasions, Si is probably the limiting element and the BSi stored in the sediments does not indicate the contemporary pelagic P concentration. In the basins of Lake M¨alaren, it is found that Si depletion, ≤5 µg L−1bio available Si, occurs some years during April–May (L¨annergren, 1998), when the diatom production reaches its climax.
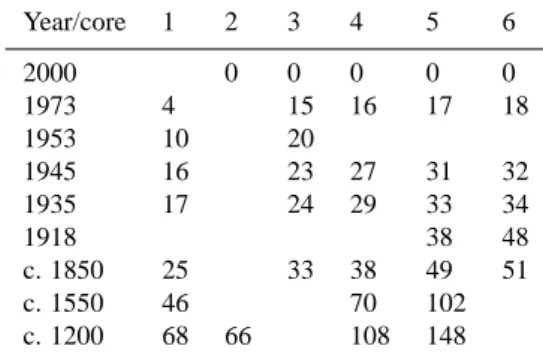
Table 1. Year versus depth (cm) in the cores.
Year/core 1 2 3 4 5 6 2000 0 0 0 0 0 1973 4 15 16 17 18 1953 10 20 1945 16 23 27 31 32 1935 17 24 29 33 34 1918 38 48 c. 1850 25 33 38 49 51 c. 1550 46 70 102 c. 1200 68 66 108 148
Climatic changes give often the same results as the varia-tions in Si supply. In modern times, the climate is well con-trolled and consequently it is known when the BSi decreases simultaneously with a BAP increase may be caused by cli-mate changes. Comparing the warm period in the 1930s and the cold 1940s and other equal periods, these oscillations are measurable.
2.2.2 Dating
The sediments were earlier dated by the author (Table 1 from Olli, 2008). Sediment dating for medieval times is based on the presence of brackish and freshwater diatoms, as Lake M¨alaren turned to a freshwater lake during that period, for modern times on the number of SCPs (spheroidal carbona-ceous particles, which is fly-ash particles from fossil com-bustion) and by isotope Cs-137 analysis. The transition from brackish to freshwater was elongated by various transgres-sion and regrestransgres-sion phases, which have been recognized in other studies ( ˚Ase, 1980; Miller and Robertsson, 1982; Am-brosiani, 1981; Miller and Hedin, 1988) and also here in Karlsk¨arsviken, which facilitate the dating. The content of the isotope Cs-137 was established in core 3. The history of SCP presence in sediments is established by Griffin and Goldberg (1975, 1979), Wik (1992), Odgaard (1993), Rose et al. (1990, 1995, 1999, 2001), Bindler et al. (2002) and Renberg et al. (2001), on which the dating of modern sedi-ments in Karlsk¨arsviken is based.
These results showed that the dating is not exact, as each cm covers 2–15 years.
The dating of the thirteenth century and 1850 are approxi-mate, while the SCP dating catches the World War years very clear and also the European industrial progresses, crises and also the progresses in eliminating the exhausts from fossil fuel combustion. The BSi decrease in the 1940s catches the cold years in the early 1940s, which means that the dating 1945 could be 1944. The knowledge of the local activities during the second half of the twentieth century has also been used for chronological control.
1750 G. Olli: Determination of the historical 2. 1850
1200
1200 1200 (a) 2. 1850 1850 1850 1400
1400 1400
(b)
Fig. 2. Concentrations of (a) BSi (mg BSi L−1)and (b) BAP and TP (µg P L−1), both (a) and (b) in sediments vs. depth in the cores 1, 3, 4 and 5, Karlsk¨arsviken. The figures are scaled to be comparable with respect to time. (a) The BSi concentration starts about 1200 AD with about 25 mg (g DM)−1and has increased to 37 mg (g DM)−1in 2000. (b) The BAP and TP concentrations start at about 1400 AD BAP with about 100–200 µg (g DM)−1with an increasing trend only in core 1 since the Middle Ages. In core 5 the TP water concentration increases in the middle of the 19th century and in core 4 in the very recent sediments.
2.2.3 Sediment accumulation rates
Sediment accumulation rates from the earlier study are used to establish the BSi accumulation rates from BSi concentra-tion and sediment accumulaconcentra-tion rates from the time when Lake M¨alaren had got freshwater until today. The sediment accumulation rates indicate that the section further out in the bay is influenced by other drainage areas than the inner sec-tion is. The outer part of the bay is and has been since the Middle Ages, strongly influenced by the main water streams coming from the western parts of Lake M¨alaren, where many towns and big industries are situated, while the water qual-ity in the inner section is dominated by the loading from the catchment area, see Sect. 2.1.
2.3 Field work
In Karlsk¨arsviken the P concentrations in the water column was measured twice a month (once the ice covered period) during 1998 and controlled in 1999 and 2000. In 2001– 2003, sediment cores were taken in the bay in a section from the above mentioned ditch outlet to the outer section of the bay (Fig. 1d). All the core locations are outside the macro-phyte zone. In the macromacro-phyte zone the sediments have been dredged, and no historical information is archived there. A 1 m long Russian peat corer was used for the cores 1, 2, 4 and 5, all taken in winter when the bay was covered by ice. A turbidity-meter was used to measure the water depth and to know where to start the coring. The cores 1 and 5 were two meters long and core 2 one meter. Core 4 was 10 m, in order to establish the sediment accumulation since the re-treat of the ice cover. The cores 3 and 6 were taken with a freeze corer, which restricted the length of these cores as they
G. Olli: Determination of the historical 1751
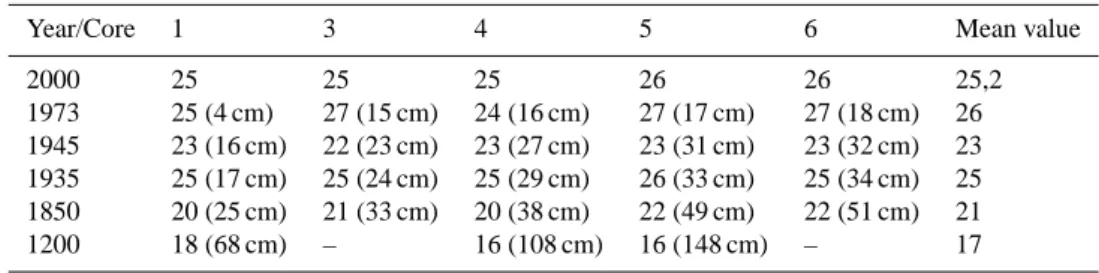
Table 2. B Si-P (µg TP L−1)concentration and the corresponding depth in brackets, date from diatom and fly-ash analyses.
Year/Core 1 3 4 5 6 Mean value
2000 25 25 25 26 26 25,2 1973 25 (4 cm) 27 (15 cm) 24 (16 cm) 27 (17 cm) 27 (18 cm) 26 1945 23 (16 cm) 22 (23 cm) 23 (27 cm) 23 (31 cm) 23 (32 cm) 23 1935 25 (17 cm) 25 (24 cm) 25 (29 cm) 26 (33 cm) 25 (34 cm) 25 1850 20 (25 cm) 21 (33 cm) 20 (38 cm) 22 (49 cm) 22 (51 cm) 21 1200 18 (68 cm) – 16 (108 cm) 16 (148 cm) – 17
just are dropped down. The length of core 3 was 48 cm and core 6 was 65 cm in length. The upper 40 cm of core 2 were strongly perturbed and could not be dated.
2.4 Laboratory work
All cores were sectioned into 1 cm slices until the depth of 70 cm and below that into 2 cm slices. The first cm was sliced 0–0.5 and 0.5–1 cm. The slices were freeze-dried and prepared for analyses as follows. BSi concentration in the sediments was determined colorimetrically in a spectropho-tometer. The samples were prepared according to the method
elaborated by De Master (1981), but 2% Na2CO3was used
instead of 1% and, accordingly, the HCl concentration had to be doubled. Using 1% the diatom frustules were not com-pletely dissolved.Three samples from every level were an-alyzed and every sample was measured three times, which gave an average value. The samples with anomalous results were repeatedly analyzed two or three times. For example, the unexpected results from core 1 were controlled very care-fully. Selected samples were checked in a light-microscope to make sure that the diatoms were dissolved. P was anal-ysed in respect to bio available phosphorous (BAP), and total phosphorous (TP) according to Psenner et al. (1984).
2.5 Lithology
The cores consist of clay and gyttja clay in the uppermost sediments. The uppermost 5 cm in core 1 was empty, prob-ably caused by loose sediment content. The organic content was about 4% in the uppermost sediments in all the cores and a little less than 2% during the Middle Ages. In core 1 the organic content dropped below 2% during the years of water undertakings. At the depth 5.70 in core 4, the sediment is influenced by the ice retreat.
3 Results
3.1 Pelagic P and BSi concentration
The used pelagic P concentrations are yearly average values. In late autumn and winter, the pelagic P concentrations are
al-ways high, about 0.040 mg L−1, where after they decrease to almost 0 in summer. The BSi concentration in the sediments shows an increasing trend since the Middle Ages (Fig. 2a)
from about 25 mg BSi (g DM)−1 to 37 mg BSi (g DM)−1
at present. The P concentrations in sediments oscillate be-tween 600 and 900 µg TP (g DM)−1(Fig. 2b) and there is no consistently increasing or decreasing trend, but for the BAP in core 1, as that for BSi concentrations. The P concentra-tions in the sediments were established to calculate the ratios BSi TP−1and BSi BAP−1for controlling whether there is a possibility that the pelagic Si deficit has diminished the BSi concentration in the sediments. This might have occurred in recent times, e.g. in; core 1 at 1 and 2 cm, core 3 at 0 and 3 cm, core 4 at 0 and 5 cm and core 5 at 0, 5 and 14 cm.
3.2 Reconstructed P values
In the Middle Ages the general uplift of the ground created the freshwater Lake M¨alaren. At the beginning of that stage, the BSi-TP concentration in Karlsk¨arsviken is estimated 16– 18 µg TP L−1(Fig. 3 and Table 2). About 1850, the P con-centration had increased to 20–22 µg TP L−1. Between 1850 and 1950 Karlsk¨arsviken became more nutritious and the BSi-TP concentration rose to 25–27 µg TP L−1(Fig. 3). The 1920s and 1930s were periods of drainage undertakings at the island of F¨arings¨o, which increased the nutrient loading to the lake. Additionally, the temperature rose in the 1930s (Moberg et al., 2005 and Briffa, 2000), resulting in short win-ters, which is a trigger of algal production. The hard climate with long periods of ice-cover lakes during the World War II is reflected in the sediments with lower diatom production in all the sediment cores (Fig. 3 and Table 2). The diatoms re-sponded immediately to the more convenient conditions that followed and the BSi-P concentration rose.
After 1950 the BSi-P concentration has oscillated between 20 and 30 µg TP L−1with lower values in the inner section of the bay and higher further out. In average, a slight decrease of BSi-P concentration is discernible during the last decades (Table 2). This conforms to the results from the monitored program (Persson et al., 1990; SEPA, 1993, 2006).
Core 1, which represents the inner section of the bay, has in previous studies by the author shown anomalies between
1752 G. Olli: Determination of the historical
1850
1200
1200 1200
Fig. 3. The reconstructed BSi-TP concentration (BSi-TP L−1)in the water column. The figures are scaled to be comparable with respect to time. There is an increasing nutrient trend in the cores but more pronounced further out in the bay, represented by the cores 4 and 5, than in the inner section, represented by core 1. The cores 1, 4 and 5 start at the level, when Lake M¨alaren got fresh water about 1200 AD as indicated by diatom analyses. 1850 AD is shown.
14 and 10 cm concerning fly-ash particles, carbon concentra-tion, lead concentration and here also for BSi concentration (Fig. 2a). This increment with anomalies is interpreted to have been deposited during the years when the new ditch was dug and a public beach and a marina (a harbour with moor-ings for private boats) were constructed, which resulted in a very high sediment accumulation rate. The respective layer was excluded from the analysis results.
3.3 The ratios BSi TP−1, BSi BAP−1and Si deficit
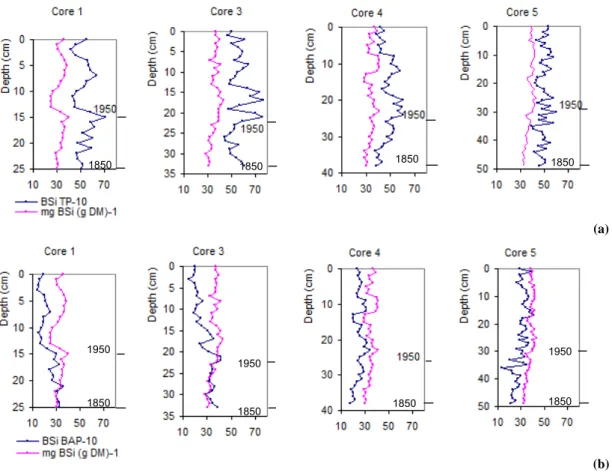
Simultaneous peaks in BSi, BSi TP−1and BSi BAP−1show
that the diatom production is optimally. The following de-crease of BSi concentration may depend on Si depletion in the water column, as diatoms need both silica and phospho-rous to multiply (Schelske et al., 1986). If a decrease of BSi is caused by BAP deficit, the ratio BSi BAP−1remains high, when the diatom production declines. In Karlsk¨arsviken, the peaks in BSi concentration and in the ratios BSi TP−1 and BSi BAP−1followed by decreases (Fig. 4a and b) coincide in modern sediments, which indicates that a Si deficit reduces the diatom production in the bay. The bio available Si is provided to Lake M¨alaren from its catchment area and years with low precipitation the Si renewal in late spring-summer may fail. In shallow areas, as in a bay, not much Si is stored and Si depletion occurs. Consequently, the BSi-P decrease after a peak may underestimate the real epilimnic P concen-tration. In the past, when the water was deeper, more Si was stored in the water column and Si depletion was not as fre-quent as today.
3.4 BSi accumulation rates
In Karlsk¨arsviken, the sediment accumulation rate is found to have increased considerably, especially in the twentieth century (Olli, 2008). From about 1200 until 1850 the BSi accumulation rate increased by 25% (Fig. 5). During the next century this rate also increased by 25% and was about 1.9 mg B Si cm−2yr−1at the end of World War II. After that, this rate increased dramatically by 300% in 20 years and reached 4.4 mg BSi cm−2yr−1in the 1960s and 1970s, which still remains the present rate, without signs of any decrease.
4 Discussion
4.1 Water depth and trophic state
From the first fresh water stage in Lake M¨alaren about 1200 AD until 1850, the sediment up silting was about 0.5– 1 m and the land upheaval of about 3.5 m lowered the wa-ter depth from about 8 m to 3.5–4.2 m. These changes nor-mally result in an increasing nutrient trophy (Ahl, 1979). The lake water is also more nutritious in its shallow sec-tions than in its deeper parts (L¨annergren, 1998), assuming that the tributaries are the same. Ahl (1979) writes about eutrophication that the effect of the lowering of the lake surface has been more serious than the effect of increas-ing nutrient loadincreas-ing. The increase from 17 µg BSi-P L−1to 21 µg BSi-P L−1(Table 2) and from 1.2 mg BSi cm−2yr−1to 1.5 mg BSi cm−2yr−1(Fig. 5) during the period 1200–1850 may be a normal effect of the above mentioned morphologi-cal changes. From that period until 1950, however, both the BSi accumulation rate and the BSi-P content increased much
G. Olli: Determination of the historical 1753 1850 1850 1850 1850 (a) 4. B 1950 1950 1950 1850 1850 1850 1850 (b)
Fig. 4. (a) BSi concentrations in sediment and the ratio BSi TP−1and (b) BSi concentrations in sediment and the ratio BSi BAP−1vs. depth in the cores 1, 3, 4 and 5. The figures start about 1850 AD and are scaled to be comparable with respect to time. A peak in the ratios BSi TP−1or in BSi BAP−1and a peak in BSi concentration at the same level may indicate pelagic Si depletion. If the following BSi decrease depends on Si deficit, the P concentration is not the limiting factor for diatom production and other vegetation may take advantage of the nutritious water. The BSi concentration decrease between 14 and 10 cm in core 1 represents the years of construction 1951–1953 with a very high sediment accumulation rate and does not show the pelagic nutrient conditions.
faster, by about the same percentage, 25%, as in the previous 650 yr period but in only a hundred years.
4.2 Increased water inflow
After about 1950, many former rills, small ditches, in the catchment area were turned into gullies by excavators, here the main tributary ditch (Fig. 1), and the outflows of particles increased both the sediment and the B Si accumulation rates. When considering only the BSi concentration in the sedi-ments (Table 2), the nutrient trophy may be viewed as having slightly decreased during the last decades. This interpretation conforms to the results in the monitored programs (SEPA, 2006). However, this is questionable, when the sediment and associated nutrient accumulation rate is taken into account, which still remains at the high 4.4 mg BSi cm−2yr−1on av-erage for the bay since about 40 years (Fig. 5).
However, in the inner section of the bay, here represented by core 3, the P concentration has diminished, even when re-garding the P accumulation rate increase. This particular P
Fig. 5. Average BSi accumulation rate (mg BSi cm−2yr−1) in Karlsk¨arsviken since the Middle Ages. The accumulation rate in-creased until the 1960s and has thereafter been the same, despite the efforts to diminish the nutrient loads.
1754 G. Olli: Determination of the historical concentration decrease may be the result of a greedy
macro-phyte zone in the discharging ditch, which has not been maintained during the last decades. The reeds take advan-tage of the nutrient rich water and the diatoms downstream in the bay have no chance to profit on it. Si deficit may also cause the BSi decrease. A shallow bay has a very short hy-draulic residence time, which makes the Si reservoir insuf-ficient in a spring with low precipitation, when the diatom growth explodes. Si concentrations in water have at the
low-est been measured to be 5–10 µg L−1 in May in basins of
Lake M¨alaren (L¨annergren, 1998) and may even have been lower in the bay, limiting diatom production.
4.3 Climate influence
It is mentioned above in this paper (Sect. 3.2.) that climate change may have influenced the diatom production during the 1930s and the World War II. In analogy, also the B Si oscillation after the 1950s may be due to temperature fluc-tuations. From the warmer years in the 1930s to the colder conditions during World War II, the temperature difference was about 1.5◦C, which probably is responsible for the BSi-P decrease from 25 to 23 µg TBSi-P L−1 (Table 2). Thereafter, there is a temperature difference from the late 1960s to the
late 1990s of about +0.7◦C, which may mask a TP
concen-tration decrease of about 1 µg TP L−1. On the other hand, the years 1971 to 1975 were as warm as the late 1990s. Besides that, a difference of 1 µg TP L−1is within the margin of error in this study, which focuses on main trends and approximate values.
4.4 Si deficit
The above mentioned P water concentrations are yearly av-erage values. The bio available P concentration is reduced when the diatoms make use of it in spring. When the di-atoms do not consume all P in water due to Si deficit, there is P left for another spring or summer blooming with flagel-lating alga and green alga (Schelske et al., 1983). This sec-ond blooming, which frequently occurs in Lake M¨alaren, is often taken as a proof of increased P loading from the tribu-taries, even when it depends on silica deficit in spring. The P level at such occasions may then be the same as in pre-vious years without this secondary blooming. A strong eu-trophication effects, with a large biomass in the water col-umn, is not considered to appear until the P concentration is above 25–30 µg TP L−1(SEPA, 1993). As the present nutri-ent trophy is about 25 µg TP L−1, P should not cause these secondary algal blooms, if Si concentrations were sufficient in spring and the diatoms could consume the P in water. It is rather the timing of P and Si loading that does not seem to be favourable for the diatoms, and therefore the P level of about 25 µg TP L−1causes visible eutrophication effects with flagellating and green algae.
Climate influences, Si supply and sediment accumulation rates indicate that the BSi concentrations alone are not suf-ficient for interpreting past times P water concentrations in this bay of Lake M¨alaren. Climate and Si deficit have to be taken into account. Climate is known and deficit of Si or other requirements are probable when there is enough sup-ply of BAP in the sediments, when the BSi concentration decreases. There is always an uncertainty when reconstruct-ing past times values, but in Lake M¨alaren there are measur-ing in the monitored program (SEPA, 2006) durmeasur-ing the last decades from other sites, which indicates reliability in this study. Certainly, the oscillations of P concentrations may be a few µg L−1 larger or smaller but of less dignity than the studies based on diatom species from other ecosystems and the increasing and decreasing trends are surely reliable.
4.5 Background P concentration
When estimating the relevant background trophy, the P con-centration at about 1850 may be a more realistic reference value than the medieval P concentrations in the deeper wa-ter column that existed at that time. This is also suggested by Will´en (2001). From about 1850 until today, the pelagic P concentrations have increased from about 20–22 µg BSi-TP L−1to 25–26 µg BSi-TP L−1(Fig. 3), which is 25% in-crease. The background TP concentration in Lake M¨alaren has earlier been estimated to 6–15 µg P L−1 by Persson et
al. (1990) and to 15–30 µg P L−1 by Renberg (1999) and
Renberg et al. (2001). Shallow bays were not studied in these previous investigations, but the latter investigation re-sults conform to the presently estimated BSi-TP
concen-trations. Considering the warmer climate during the last
decades compared to the cold middle of the nineteenth cen-tury the background BSi-P concentration, 20–22 µg TP L−1, may possibly be put higher. According to the differences be-tween the warmer thirties and the colder forties the tempera-ture influence on the BSi concentration is about 2–3 mg BSi
(g DM)−1, and the background P concentration may be put
about 1–2 µg TP L−1higher.
5 Conclusions
In Karlsk¨arsviken, the shallow inner section of the bay, where water quality is dominated by the outflows from the catch-ment area, is less nutritious than the section further out, which is influenced by the main streams from the western part of Lake M¨alaren. The pelagic P concentration in the in-ner section was measured 1998–2000 and found to be about 25 µg TP L−1, which possibly is 4–5 µg TP L−1higher than it was during the middle of the nineteenth century. The BSi concentration in the sediments is used as an indicator of P concentration in the pelagic zone, but other circumstances have also to be considered, such as climate, Si supplies to the water column and, above all, the sediment accumulation
G. Olli: Determination of the historical 1755 rates. These factors together indicate that the P loading to
Karlsk¨arsviken has not changed durable since the 1960s and 1970s.
The background BSi-P water concentration is here
es-timated to be 20–22 µg TP L−1. This conforms to
previ-ous results by Renberg (1999) and Renberg et al. (2001), who estimated a background P concentration of about 15– 30 µg TP L−1in the basins of Lake M¨alaren.
In the inner section of the bay, represented by core 1, former analysis of fly-ash, carbon and lead carried out by the author, showed anomalies at the levels dated 1951–1953. Corresponding anomalies are also recorded in the BSi and P stratigraphies. During this period, both the discharging ditch and its catchment area were enlarged and also water enter-prises were in progress.
Coinciding peaks in BSi concentrations and in the ratios
BSi-P TP−1and BSi-P BAP−1followed by BSi
concentra-tions indicate that Si depletion sometimes occurs in the bay water column, which brakes the diatom production. The secondary bloom of green alga, which is recurrent in Lake M¨alaren, is possibly an effect of silica deficit in the water column, which reduces the diatom mass. The available P is not consumed by the diatoms in spring and at such occasions visible eutrophication effects with flagellating and green algae appear later in summer.
Edited by: A. Montanari
References
Ahl, T.: Natural and human effects on trophic evolution. Archiv f¨ur Hydrobiologie, Ergebnisse Limnologie, Heft 13, 259–277, 1979. Ambrosiani, B. (Ed.): Environment and Vikings: scientific methods
and techniques, PACT 52/Birka studies 4, 261–275, 1997. Anderson, N. J., Rippey, B., and Gibson, C. E.: A comparison of
sedimentary and diatom-inferred phosphorous profiles: implica-tions for defining pre-disturbance nutrient condiimplica-tions, Hydrobi-ologia, 253, 357–366, 1993.
Anderson, N. J.: Reconstructing Historical Phosphorus Concentra-tions in Rural Lakes Using Diatom Models, 95–118, in: Phos-phorus Loss from Soil to Water, edited by: Tunney, H., Carton, O. T., Brookes, P. C., and Johnston, A. E., 95–118, 1994. ˚
Ase, L.-E.: Shore displacement at Stockholm during the last 1000 years, Geogr. Ann., 62 A(1–2), 83–91, 1980.
Bennion, H., Juggins, S., and Andersson, N. J.: Predicting epil-imnic phosphorous concentrations using an improved diatom-based transfer function and its application to lake eutrophication management, Environ. Sci. Technol., 30, 2004–2007, 1996. Benoy, G. A. and Kalff, J.: Sediment accumulation and Pb burdens
in submerged macrophyte beds, Limnol. Oceanogr., 44(4), 1081– 1090, 1999.
Bindler, R., Korsman, T., Renberg, I., and H¨ogberg, P.: Pre-Industrial Atmospheric Pollution: Was It Important for the pH of Acid-sensitive Swedish Lakes?, Ambio, 31, 6, 460–465, 2002.
Bostr¨om, B., Jansson, M., and Forsberg, C.: Phosphorus release from lake sediments, Arch. Hydrobiol. Beih. Ergebnisse, Lim-nologie, 18, 5–59, 1982.
Bradshaw, E. G. and Anderson, N. J.: Validation of a diatom-phosphorous calibration set for Sweden, Freshwater Biol., 46, 1035–1048, 2001.
Briffa, K. R.: Annual climate variability in the Holocene: inter-preting the message of ancient trees, Quaternary Sci. Rev., 19, 87–105, 2000.
DeMaster, D. J.: The supply and accumulation of silica in the ma-rine environment, Geochimica et Cosmochimica Acta, 45, 1715– 1732, 1981.
Farmer, J. G., Bailey-Watts, A. E., Kirika, A., and Scott, C.: Phos-phorous fractionation and mobility in Loch Leven sediments, Aquat. Conserv., 4, 45–56, 1994.
Foy, R. H. and Withers, P. J. A.: The contribution of agricultural phosphorus to eutrophication, Proceedings of the Fertilizer Soci-ety, 365, 1–32, 1995.
Griffin, J. J. and Goldberg, E. D.: The fluxes of elemental carbon in costal marine sediments, Limnol. Oceanogr., 20, 256–263, 1975. Griffin, J. J. and Goldberg, E. D.: Morphologies and origin of ele-mental carbon in the environment, Science, 206, 563–565, 1979. Harper, D. M.: Eutrophication of Freshwaters: Principles, Problems
and Restoration, Chapman and Hall, Londo, 1992n.
Katsuki, K. and Takahashi, K.: Diatoms as paleo environmental proxiea for seasonal productivity, sea-ice and surface circulation in the Bering Sea during the late Quaternary, Deep-Sea Res. II, 52, 2110–2130, 2005.
Lund, J. W. G.: Eutrophication, Proceedings of the Royal Society of London, B180, 257–382, 1972.
L¨annergren, Ch.: Unders¨okningar i ¨Ostra M¨alaren 1994-97, Rap-port, Stockholm Vatten, 35 pp., 1998.
Mackay, A. W., Ryves, D. B., Batterbee, R. W., Flower, R. J., Jew-son, D., Rioual, P., and Sturm, M.: Global Planet. Change, 46, 281–297, 2005.
Milj¨odepartementet: Hur m˚ar Sverige? Bilaga A till regeringens prop 1990/1991, Milj¨odepartementet, Stockholm, 279 pp., 1991. Miller, U. and Hedin, K.: The Holocene Development of Landscape and Environment in the South-East M¨alaren valley with Special References to Helg¨o (Excavations at Helg¨o XI), Kungliga Histo-rie och Antikvitets Akademien, Stockholm, 72 pp., 1988. Miller, U. and Robertsson, A.-M.: The Helgeandsholmen
excava-tion: An outline of biostratigraphical studies to document shore displacement and vegetational changes, Second Nordic Confer-ence on the Application of Scientific Methods in Archeology, PACT, 7, 311–328, 1982.
Moberg, A., Sonechkin, D. M., Holmgren, K., Datsenko, N. M., and Karl´en, W.: Highly variable Northern Hemisphere temperatures reconstructed from low- and high-resolution proxy data, Nature, 433, 613–617, 2005.
Odgaard, B. V.: The sedimentary record of spheroidal carbonaceous fly-ash particles in shallow Danish lakes, J. Paleolimnol., 8, 171– 187, 1993.
Olli, G.: Historic sediment accumulation rates in Karlsk¨arsviken, a bay of Lake M¨alaren, Sweden, Hydrol. Res., in press, 2008. Paus, A., Velle, G., Larsen, J., Nesje, A., and Lie, ¨O.: Lateglacial
nunataks in central Scandinavia: Biostratigraphical evidence for ice thickness from Lake Fl˚afattj¨onn, Tynset, Norway, Quaternary Sci. Rev., 25, 1228–1246, 2005.
1756 G. Olli: Determination of the historical Persson, G., Olsson, H., and Will´en, E.: M¨alarens vattenkvalitet
under 20 ˚ar. 1. V¨axtn¨aring tillf¨orsel, Sj¨okoncentrationer och v¨axtplanktonm¨angder, Naturv˚ardsverket Rapport 3759, Naturv˚ardverkets f¨orlag, Solna, 47 pp., 1990.
Persson, G.: Phosphorous in Tributaries to Lake M¨alaren, Sweden: Analytical Fractions, Anthropogenic Contribution and Bioavail-ability, Ambio, 30(8), 486–495, 2001.
Psenner, R., Pucsko, R., and Sager, M.: Die Fraktionierung or-ganischer und anoror-ganischer Phosphorverbindungen von Sedi-menten, Archiv f¨ur Hydrobiologie, Ergebnisse Limnologie, 111– 155, 1984.
Renberg, I.: N¨aringstillst˚andet I S¨odra Bj¨orkfj¨arden, M¨alaren, un-der tusen ˚ar, En paleolimnologisk unun-ders¨okning. Institutionen f¨or ekologi och geovetenskap, Ume˚a Universitet, Ume˚a, 15, 1999. Renberg, I., Bindler, R., Bradshaw, E., Emteryd, O., and McGowan,
S.: Sediment Evidence of Early Eutrophication and Heavy Metal Pollution of Lake M¨alaren, Central Sweden, Ambio, 30(8), 496– 502, 2001.
Reynolds, C. S.: The Ecology of Freshwater Phytoplankton, Cam-bridge University Press, CamCam-bridge, 1984.
Rose, N. L.: A method for the extraction of carbonaceous particles from lake sediment, J. Paleolimnol., 3, 45–53.
Rose, N. L., Harlock, S., Appleby, P. G., and Batterbee, R. W.: Dat-ing of recent lake sediments in the United KDat-ingdom and Ireland using spheroidal carbonaceous particle (SCP) concentration pro-files, The Holocene, 5(3), 328–335, 1995.
Rose, N. L., Harlock, S., and Appleby, P. G.: The spatial and tem-poral distributions of spheroidal carbonaceous fly-ash particles (SCP) in the sediment records of European mountain lakes, Wa-ter Air Soil Poll., 113, 1–32, 1999.
Rose, N. L: Fly-ash particles, in: Tracking environmental change using lake sediments, edited by: Last, W. M. and Smol, J. P., Vol. 2, Physical and geochemical methods, Dordrecht, Kluwer, 319–349, 2001.
Round, F. E.: The Ecology of the Algae, Cambridge University Press, Cambridge, 1981.
R¨uland, K. and Smol, J. P.: Diatom shifts as evidence for recent Subarctic warming in a remote tundra lake, NWT, Canada, Pale-ogeography, Paleochlimatology, Paleoecology, 226, 1–16, 2005. Schelske, C. L., Conley, D. J., Stroemer, E. F., Robbins, J. A., and Glover, R. M.: Early Eutrophication in the Lower Great Lakes: New Evidence from Biogenic Silica in Sediments, Science, 222, 320–322, 1983.
Schelske, C. L., Conley, D. J., Stroemer, E. F., Newberry, T. L., and Campbell, C. D.: Biogenic silica and phosphorous accumulation in sediments as indices of eutrophication in the Laurentian Great Lakes, Hydrobiologia, 143, 79–86, 1986.
SEPA: An environmentally adapted society. Swedish Environmen-tal Protection Agency, Report 4324 (in Swedish), 1993. SEPA: Eutrophication of Swedish Seas, Swedish Environmental
Protection Agency, Report 5509, 2006.
Stoermer, E. F.: Qualitative characteristics of phytoplankton assem-blages, in: Algae as Ecological Indicators, edited by: Shubert, L. E., Academic Press, London, 49–67, 1984.
ter Braak, C. J. F. and van Dam, H.: Inferring pH from diatoms: a comparison of old and new calibration methods, Hydrobiologia, 178, 209–223, 1989.
Will´en, E.: Four Decades of Research on the Swedish Large Lakes M¨alaren, Hj¨almaren, V¨attern and V¨anern: The Significance of Monitoring and Remedial Measures for a Sustainable Society, Ambio, 30(8), 458–466, 2001.
Will´en, T.: The gradual destruction of Sweden’s lakes, Ambio, 1, 6–14, 1972.