HAL Id: hal-00304104
https://hal.archives-ouvertes.fr/hal-00304104
Submitted on 16 Apr 2008HAL is a multi-disciplinary open access
archive for the deposit and dissemination of sci-entific research documents, whether they are pub-lished or not. The documents may come from teaching and research institutions in France or abroad, or from public or private research centers.
L’archive ouverte pluridisciplinaire HAL, est destinée au dépôt et à la diffusion de documents scientifiques de niveau recherche, publiés ou non, émanant des établissements d’enseignement et de recherche français ou étrangers, des laboratoires publics ou privés.
The chemistry influencing ODEs in the Polar Boundary
Layer in spring: a model study
M. Piot, R. von Glasow
To cite this version:
M. Piot, R. von Glasow. The chemistry influencing ODEs in the Polar Boundary Layer in spring: a model study. Atmospheric Chemistry and Physics Discussions, European Geosciences Union, 2008, 8 (2), pp.7391-7453. �hal-00304104�
ACPD
8, 7391–7453, 2008The chemistry influencing ODEs
M. Piot and R. von Glasow Title Page Abstract Introduction Conclusions References Tables Figures ◭ ◮ ◭ ◮ Back Close
Full Screen / Esc
Printer-friendly Version Interactive Discussion
Atmos. Chem. Phys. Discuss., 8, 7391–7453, 2008 www.atmos-chem-phys-discuss.net/8/7391/2008/ © Author(s) 2008. This work is distributed under the Creative Commons Attribution 3.0 License.
Atmospheric Chemistry and Physics Discussions
The chemistry influencing ODEs in the
Polar Boundary Layer in spring: a model
study
M. Piot1and R. von Glasow1,*
1
Institute of Environmental Physics, University of Heidelberg, Heidelberg, Germany
*
now at: School of Environmental Sciences, University of East Anglia, Norwich, UK Received: 8 January 2008 – Accepted: 13 February 2008 – Published: 16 April 2008 Correspondence to: R. von Glasow ([email protected])
ACPD
8, 7391–7453, 2008The chemistry influencing ODEs
M. Piot and R. von Glasow Title Page Abstract Introduction Conclusions References Tables Figures ◭ ◮ ◭ ◮ Back Close
Full Screen / Esc
Printer-friendly Version Interactive Discussion
Abstract
Near-total depletions of ozone have been observed in the Arctic spring since the mid 1980s. The autocatalytic cycles involving reactive halogens are now recognized to be of main importance for Ozone Depletion Events (ODEs) in the Polar Boundary Layer (PBL). We present sensitivity studies using the model MISTRA in the box-model mode 5
on the influence of chemical species on these ozone depletion processes. In order to test the sensitivity of the chemistry under polar conditions, we compared base runs un-dergoing fluxes of either Br2, BrCl, or Cl2to induce ozone depletions, with similar runs including a modification of the chemical conditions. The role of HCHO, H2O2, DMS, Cl2, C2H4, C2H6, HONO, NO2, and RONO2 was investigated. Cases with elevated 10
mixing ratios of HCHO, H2O2, DMS, Cl2, and HONO induced a shift in bromine speci-ation from Br/BrO to HOBr/HBr, while high mixing ratios of C2H6induced a shift from HOBr/HBr to Br/BrO. Cases with elevated mixing ratios of HONO, NO2, and RONO2 induced a shift to BrNO2/BrONO2. The shifts from Br/BrO to HOBr/HBr accelerated the aerosol debromination, but also increased the total amount of deposited bromine at the 15
surface (mainly via increased deposition of HOBr). These shifts to HOBr/HBr also hin-dered the BrO self-reaction. In these cases, the ozone depletion was slowed down, where increases in H2O2and HONO had the greatest effect. The tests with increased mixing ratios of C2H4 highlighted the decrease in HOx which reduced the production of HOBr from bromine radicals. In addition, the direct reaction of C2H4 with bromine 20
atoms led to less available reactive bromine. The aerosol debromination was there-fore strongly reduced. Ozone levels were highly affected by the chemistry of C2H4. Cl2-induced ozone depletions were found unrealistic compared to field measurements due to the rapid production of CH3O2, HOx, and ROOH which rapidly convert reactive chlorine to HCl in a “chlorine counter-cycle”. This counter-cycle efficiently reduces the 25
concentration of reactive halogens in the boundary layer. Depending on the relative bromine and chlorine mixing ratios, the production of CH3O2, HOx, and ROOH from the counter-cycle can significantly affect the bromine chemistry. Therefore, the
pres-ACPD
8, 7391–7453, 2008The chemistry influencing ODEs
M. Piot and R. von Glasow Title Page Abstract Introduction Conclusions References Tables Figures ◭ ◮ ◭ ◮ Back Close
Full Screen / Esc
Printer-friendly Version Interactive Discussion
ence of both bromine and chlorine in the air may unexpectedly lead to a slow down in ozone destruction. For all NOy species studied (HONO, NO2, RONO2) the chemistry is characterized by an increased bromine deposition on snow reducing the amount of reactive bromine in the air. Ozone is less depleted under conditions of high mixing ratios of NOx. The production of HNO3 led to the acid displacement of HCl, and the 5
release of chlorine out of salt aerosols (Cl2or BrCl) increased.
1 Introduction
Since the first reports of dramatic decreases of ozone (so-called ODEs) in the Arc-tic during spring (Bottenheim et al.,1986; Oltmans and Komhyr,1986;Barrie et al.,
1988), intensive efforts have been made to better understand the processes involved 10
in the observed ozone loss. These events with low mixing ratios of ozone were cor-related with high concentrations of filterable bromine (f-Br) (Barrie et al.,1988,1989;
Bottenheim et al.,1990). Later, BrO was observed with Long-Path DOAS (LP-DOAS, seeHausmann and Platt,1994).Lehrer et al. (1997) showed a striking correlation be-tween f-Br and BrO. During the ALERT2000 campaign, Br2 and BrCl were measured 15
with mixing ratios as high as 30–35 pmol mol−1 in April, while Cl2 was not observed above its detection limit of about 2 pmol mol−1(Foster et al.,2001;Spicer et al.,2002). Similarly, results from the chemical amplification method used byPerner et al.(1999) showed mixing ratios of ClOx (Cl+ClO) not exceeding 2 pmol mol−1 in spring. Only the measurements byTuckermann et al. (1997) in Spitzbergen in 1995 indicated ClO 20
mixing ratios up to 21 pmol mol−1. These values were not observed, however, in the follow-up campaign in 1996. During the TOPSE aircraft programRidley et al. (2003) showed that ozone depletions were actually widespread in the Arctic region. Indeed,
Zeng et al.(2003) estimated that about 20% of the Arctic regions were influenced by persistent near-surface ODEs in spring. This is in accordance with remote sensing 25
data from satellites measuring column BrO (Richter et al., 1998; Wagner and Platt,
ACPD
8, 7391–7453, 2008The chemistry influencing ODEs
M. Piot and R. von Glasow Title Page Abstract Introduction Conclusions References Tables Figures ◭ ◮ ◭ ◮ Back Close
Full Screen / Esc
Printer-friendly Version Interactive Discussion
Under ODE conditions halogen catalytic reaction cycles are responsible for the de-pletion of O3. Halogens (X, Y=Br, Cl, I) directly destroy ozone via three main cycles (see, e.g.,von Glasow and Crutzen,2007;Simpson et al.,2007b). Rate coefficients between iodine and ozone are highest, but we do not focus on iodine chemistry in this paper. Bromine is the most abundant and therefore, the most efficient halogen species 5
for the ozone destruction: Cycle I: 2(O3+ X −→ XO + O2) (1) XO + XO −→ 2 X + O2 (2) −→X2+ O2 (3) 10 X2−→hν 2 X (4) Net: 2 O3−→3 O2
This cycle I is the fastest ozone-depleting reaction cycle for X=Br. Cycle II: XO + HO2−→HOX + O2 (5) 15 HOX−→hν OH + X (6) CO + OH O2 −→HO2+ CO2 (7) Net: O3+ CO −→ O2+ CO2
Reaction (5) is very fast and represents a main pathway for the production of HOX. Cycle III: 20 XO + YO −→ X + Y + O2 (8) −→XY + O2 (9) −→X + OYO (10) Net: 2 O3−→3 O2
ACPD
8, 7391–7453, 2008The chemistry influencing ODEs
M. Piot and R. von Glasow Title Page Abstract Introduction Conclusions References Tables Figures ◭ ◮ ◭ ◮ Back Close
Full Screen / Esc
Printer-friendly Version Interactive Discussion
The interhalogen Reactions (8) to (10) have similar effects on ozone to those of bromine itself.
If enough CH3O2 is present in the airmass, the following reaction might become a substantial pathway to convert BrO into other reactive halogen species (Aranda et al.,
1997): 5
BrO + CH3O2−→HOBr + O2 (11)
−→Br + HCHO + HO2 (12)
HO2 impacts the speciation of bromine species via reaction with BrO (see Reaction5). In addition, it directly reacts with Br atoms to form HBr:
Br + HO2−→HBr + O2 (13)
10
Reaction (5) is the most efficient one for the modification of the bromine speciation, followed by Reactions (11–12) (with an order of magnitude less efficient). The reaction rates of Reaction (13) remain usually small. However, it may become important when the ratio [Br]:[BrO] increases (e.g., when ozone depletion is nearly complete).
In order to sustain a significant amount of reactive halogens in the gas phase, addi-15
tional mechanisms involving the liquid and solid phases (aerosols, ice crystals/snow) are necessary to activate halides and recycle less-reactive gas phase halogens. In the early 1990sFan and Jacob(1992) andMcConnell et al.(1992) suggested the following important heterogeneous reaction path for the liberation of Br2and BrCl from sea salt (based on data fromEigen and Kustin,1962), involving HOBr:
20
HOXaq+ Y−
+ H+−→XYaq+ H2O (14)
The proportional release of Br2/BrCl from Reaction (14) was experimentally studied byFickert et al. (1999). The required acidity may be supplied by strong acids, such as man-made HNO3and H2SO4(see also Mozurkewich,1995;Tang and McConnell,
1996;Vogt et al.,1996). Reaction (14), releasing two bromine atoms in the gas phase 25
ACPD
8, 7391–7453, 2008The chemistry influencing ODEs
M. Piot and R. von Glasow Title Page Abstract Introduction Conclusions References Tables Figures ◭ ◮ ◭ ◮ Back Close
Full Screen / Esc
Printer-friendly Version Interactive Discussion
source of halogens in the PBL remains unclear. Recently, efforts to locate the source focused on freshly-new sea ice and frost flowers (Martin et al., 1995; Rankin et al.,
2000;Kaleschke et al.,2004;Domin ´e et al.,2005), as they provide adequate surfaces, called “brine” (Richardson and Keller,1966), containing highly concentrated halides.
Simpson et al.(2007a) found a high correlation between fresh sea ice and high levels 5
of BrO.
Box models (Fan and Jacob, 1992; McConnell et al., 1992; Tang and McConnell,
1996; Sander et al., 1997; Michalowski et al., 2000; Evans et al., 2003) and one-dimensional models (Lehrer et al.,2004;Piot and von Glasow,2007) have investigated the reaction cycles and have increased our understanding of the halogen/ozone chem-10
ical processes. Piot and von Glasow (2007) modeled meteorological and chemical processes that may influence the occurrence of an ODE with the snow surface act-ing as an efficient recyclact-ing surface. They also investigated the relevance of observed levels of non-halogen species on the halogen/ozone chemistry. However, the relative importance of these relevant species in the Arctic on the ozone chemistry has to be 15
better understood.
Numerous concentration and flux measurements of compounds in the Arctic have been reported in the literature, but the variability of these compounds in relation to the ozone/halogen chemistry needs a clearer investigation to better understand the occurrence of an ODE. In this paper, we examined the potential effects of the presence 20
of several chemical species in the PBL on the ozone level. Several modifications (in mixing ratios or fluxes) compared to conditions in base runs are investigated for HCHO, H2O2, DMS, Cl2, C2H4, C2H6, HONO, NO2, and RONO2. Implications for the chemistry in the PBL are discussed in Sects.4.3to4.9.
2 Model description and setup
25
We used the model MISTRA which was initially designed to study the physics and chemistry of the marine boundary layer (von Glasow et al.,2002a,b;von Glasow and
ACPD
8, 7391–7453, 2008The chemistry influencing ODEs
M. Piot and R. von Glasow Title Page Abstract Introduction Conclusions References Tables Figures ◭ ◮ ◭ ◮ Back Close
Full Screen / Esc
Printer-friendly Version Interactive Discussion
Crutzen,2004) but was recently extended and applied also to Arctic conditions (Piot
and von Glasow,2007). MISTRA is a one-dimensional model which can also be used as a box model which is what we did for this study. In this study, we used the box model in the Lagrangian mode.
We chose the solar conditions (relevant for the calculation of photolysis frequencies) 5
for Alert, Canada (82.5◦N, 62.3◦W) as in early spring (solar declination of +7◦). We chose a boundary layer height of 300 m, as often observed during spring in the high Arctic (Hopper and Hart,1994;Hopper et al.,1998;Ridley et al.,2003). The relevant meteorological parameters in the box-model mode are the temperature, relative humid-ity, and the particle size distribution. The uptake of gases by aerosols is temperature 10
dependent (Schwartz,1986) because the molecular speed, the gas phase diffusivity, and the reactive uptake depend on the temperature. We want to stress, however, that the temperature dependencies of the uptake parameters are based on estimates as found in the literature.
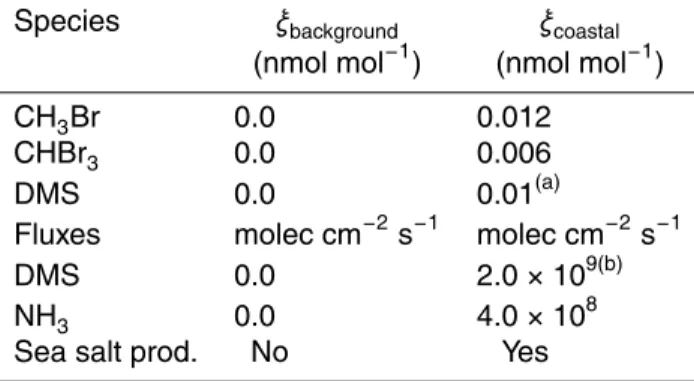
In the sensitivity studies we present in this paper we distinguish an airmass influ-15
enced by the presence of sea water (coastal conditions) from an aged airmass over snow-covered areas (background conditions). The airmass composition is modified by the presence of sea water (see Table1). Sea salt aerosols (SSA) are only produced in runs under coastal conditions. They provide an additional source of potentially re-leasable bromine (Reaction14) and represent an important medium for recycling less 20
reactive bromine compounds.
SSAs are produced by bursting bubbles at the sea surface (Woodcock,1953;
Prup-pacher and Klett,1997). We used the parameterization fromMonahan et al.(1986) to estimate the flux of these particles (with wind speed u=5 m s−1). The initial composition of SSAs is listed in Table2. According to measurements made byKoop et al. (2000) 25
SSAs and sulfate aerosols are liquid under the conditions of our model runs.
The very stiff chemical differential equation system is solved with a Rosenbrock third-order integrator using automatically adjusted timestep (∆t=10−10 to 10 s) (Sandu et al.,
ACPD
8, 7391–7453, 2008The chemistry influencing ODEs
M. Piot and R. von Glasow Title Page Abstract Introduction Conclusions References Tables Figures ◭ ◮ ◭ ◮ Back Close
Full Screen / Esc
Printer-friendly Version Interactive Discussion
All chemical reactions in gas and aqueous phase, equilibria and transfer reactions are calculated as one coupled system using the kinetic preprocessor KPP which allows rapid change of the chemical mechanism (Damian et al., 2002). The temperature, humidity and particle size distribution are updated every 10 s. Photolysis frequencies are calculated online (Landgraf and Crutzen,1998) every 10-min timestep with a four-5
stream model.
We used a two-day, one-dimensional model run to calculate the photolysis rates at the lowermost layer (5 m), used in the initialization of the box model. SSAs are produced during this “spinup” run. The box-model sensitivity runs last four days.
A diurnal variation of the temperature (∆T=2 K) is prescribed, inducing a temperature 10
range from T=243.5 to 245.5 K in the model (seeJobson et al.,1994;Hopper et al.,
1994;Ridley et al.,2003).
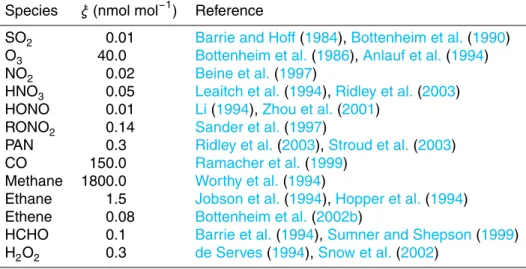
The initial mixing ratios for gas phase species (ξ) are based on observations made at Alert, in April (Table3). MISTRA includes a comprehensive set of gas phase reac-tions as well as chemical reacreac-tions in aerosol particles focusing on halogen species. 15
Exchanges between the two phases are also taken into account. The set of used re-actions is similar tovon Glasow et al.(2002b), but updated with data from the IUPAC compilation (February 2006, available fromhttp://www.iupac-kinetic.ch.cam.ac.uk/).
The chemical reaction mechanism in the model has been updated with additional relevant species for the Arctic environment: alkyl nitrate RONO2 (with the alkyl group 20
R=CnH2n+1), bromoform CHBr3 and methyl bromide CH3Br. The model includes 169 gas phase reactions (H-O-S-C-N-Br-Cl), as well as 150 aqueous phase reac-tions, 60 phase exchange reacreac-tions, 13 heterogeneous reactions and 21 equilibria for both sulfate and sea salt aerosols. The updated set of reactions is available as electronic attachment to this paper. http://www.atmos-chem-phys-discuss.net/8/7391/
25
2008/acpd-8-7391-2008-supplement.pdf
All particles above their deliquescence humidity (70% and 75% of relative humidity for sulfate and sea salt aerosols, respectively) are treated as aqueous solutions. The same holds for particles that had been activated or have been released as droplets
ACPD
8, 7391–7453, 2008The chemistry influencing ODEs
M. Piot and R. von Glasow Title Page Abstract Introduction Conclusions References Tables Figures ◭ ◮ ◭ ◮ Back Close
Full Screen / Esc
Printer-friendly Version Interactive Discussion
above their crystallisation humidity (40% and 42%, respectively). A detailed description of the aerosol characteristics can be found invon Glasow et al.(2002b).
Under coastal conditions, we prescribed surface fluxes of dimethylsulfide (DMS) and ammonia (NH3), as well as mixing ratios of biogenic bromine (see Table1).
3 Chemical reaction cycles
5
This section is meant to give an introduction to reaction cycles that will be discussed in the remainder of this paper. For a more thorough discussion please refer to, e.g.,
Seinfeld and Pandis(1998) orFinlayson-Pitts and Pitts(1999). 3.1 HCHO and HOxchemistry
Formaldehyde (HCHO) is an important source of oxidizing free radicals (HOx) for the 10
PBL, and has therefore received considerable interest in the last decade (Barrie et al.,
1994;Sumner and Shepson,1999;Hutterli et al.,2002;Jacobi et al.,2002;Ridley et al.,
2003;Jacobi et al.,2004). Measurements in the air, firn air, and in snow revealed varia-tions of HCHO determined by several processes. Its uptake/release between the snow and adjacent firn air is temperature-dependent. Additionally, photochemical reactions 15
and ventilation of the firn air to the above layers play an important role in the production of HCHO from the snowpack. For more details on the production of HCHO the reader is referred toSimpson et al.(2007b). Its main loss reactions are:
HCHO −→hν H2+ CO (15) hν,O2 −→ 2HO2+ CO (16) 20 HCHO + OH O2 −→ HO2+ CO + H2O (17)
If present in sufficient amounts, HCHO may modify the bromine chemistry via: HCHO + BrO O2
ACPD
8, 7391–7453, 2008The chemistry influencing ODEs
M. Piot and R. von Glasow Title Page Abstract Introduction Conclusions References Tables Figures ◭ ◮ ◭ ◮ Back Close
Full Screen / Esc
Printer-friendly Version Interactive Discussion
HCHO + Br O2
−→HBr + CO + HO2 (19)
The reaction between HCHO and chlorine is discussed in Sect.3.3. The chemistry of formaldehyde is investigated in Sect.4.3.
Hydrogen peroxide (H2O2) in the Arctic is found in high concentrations in snow. Snow-air fluxes have been measured at several sites in polar regions (Fuhrer et al., 5
1996; Hutterli et al., 2001; Jacobi et al., 2002; Hutterli et al., 2004). It is reversibly deposited to the snow due to nonlinear processes occurring between the atmosphere and the snow (Conklin et al.,1993;Neftel et al.,1995). H2O2has a significant impact on the lifetime of trace gases as it constitutes a large potential source for gas phase ox-idants (HOx) which contribute to the atmospheric oxidizing capacity. H2O2is destroyed 10
in Reactions (20–22) (producing HOx) and is produced in Reaction (23).
H2O2−→hν 2 OH (20)
H2O2+ OH −→ HO2+ H2O (21)
H2O2+ Cl −→ HCl + HO2 (22)
HO2+ HO2−→H2O2+ O2 (23)
15
The chemistry of H2O2is discussed in Sect.4.4. 3.2 DMS chemistry
Charlson et al.(1987) suggested a role of dimethylsufilde (DMS) in regulating climate. This effect, if present, remains ill-quantified though. Toumi (1994), based on kinetic data fromBarnes et al. (1991), was the first to suggest that BrO might play an impor-20
tant role in the oxidation of DMS. von Glasow and Crutzen (2004) discussed uncer-tainties in the oxidation of DMS and pointed out that the net effect of DMS oxidation products, considering BrO as oxidant, on clouds might be contrary to those suggested byCharlson et al.(1987), namely a decrease of cloud albedo instead of an increase.
ACPD
8, 7391–7453, 2008The chemistry influencing ODEs
M. Piot and R. von Glasow Title Page Abstract Introduction Conclusions References Tables Figures ◭ ◮ ◭ ◮ Back Close
Full Screen / Esc
Printer-friendly Version Interactive Discussion
The following are the most important halogen-DMS reactions:
DMS + Cl O2 −→HCl + CH3SCH2O2 (24) DMS + BrO −→ DMSO + Br (25) DMSO + OH −→ 0.95 CH3O2+ 0.95 CH3SO2H +0.05 DMSO2 (26) 5
The interactions between DMS and bromine are discussed in Sect.4.5. 3.3 Chlorine chemistry
The chemistry of chlorine has been extensively studied. Keene et al.(1999) provided an inventory for sources of reactive chlorine. Jobson et al. (1994) were the first to indirectly measure concentrations of chlorine in the Arctic troposphere.
10
However, low chlorine levels observed in the Arctic indicated its minor role in ozone depletions (Perner et al.,1999;Foster et al.,2001;Spicer et al.,2002). Nevertheless, chlorine may considerably modify hydrocarbons and radical budgets (Jobson et al.,
1994; Ariya et al., 1998, 1999;Ramacher et al., 1999): the destruction of ozone by chlorine chemistry is described in Sect.1. Additionally, if substantial levels of chlorine 15
are present the following reactions may become important:
Cl + CH4 O2 −→HCl + CH3O2 (27) CH3O2+ HO2−→ROOH + O2 (28) ROOH + Cl −→ HCl + CH3O2 (29) ClO + CH3O2−→Cl + HCHO + HO2 (30) 20 Cl + HCHO O2 −→HCl + HO2+ CO (31)
where ROOH is a hydroperoxide (see, e.g., Jacob, 2000; Frey et al., 2006) with R=CnH2n+1. Chlorine chemistry is investigated in Sect.4.6.
ACPD
8, 7391–7453, 2008The chemistry influencing ODEs
M. Piot and R. von Glasow Title Page Abstract Introduction Conclusions References Tables Figures ◭ ◮ ◭ ◮ Back Close
Full Screen / Esc
Printer-friendly Version Interactive Discussion
3.4 C2H4chemistry
Measurements of fluxes of alkenes from the snow have shown the presence of local sources for ethene (C2H4) in the Arctic. Bottenheim et al. (2002a) measured atmo-spheric mixing ratios as high as 100 pmol mol−1in early spring with a slow decrease with season. In our set of reactions, three reactions characterize the chemistry of C2H4: 5 C2H4+ Cl O2 −→HCl + C2H5O2 (32) C2H4+ OH−→O2 H2C(OH)CH2OO (33) C2H4+ Br O2 −→HBr + C2H5O2 (34)
The rate coefficients for Reactions (32) and (33) are about 200 and 2000 times higher than for Reaction (34), respectively. The reactions involving C2H5O2 and 10
H2C(OH)CH2OO will not be further detailed in this paper as their reaction rates remain very small under polar conditions. In MISTRA the possible formation of organically-bound bromine compounds as reaction product of Reaction (34) (Keil and Shepson,
2006) is not taken into account. Other reactions with heavier alkenes are not included in the model. We investigated the effect of these three reactions in Sect.4.7.
15
3.5 C2H6chemistry
Alkanes are commonly present in the Arctic due to transport from the source regions (Eurasia and northern America mostly, see AMAP report, 1998). In April, ethane (C2H6) is usually observed in the surface air at about 1.5−2.5 nmol mol−1with a gradual decline with season (Jobson et al.,1994;Ariya et al.,1999;Bottenheim et al.,2002a; 20
Evans et al.,2003). In our model C2H6chemistry includes the following reactions:
C2H6+ Cl O2
−→HCl + C2H5O2 (35)
C2H6+ OH O2
ACPD
8, 7391–7453, 2008The chemistry influencing ODEs
M. Piot and R. von Glasow Title Page Abstract Introduction Conclusions References Tables Figures ◭ ◮ ◭ ◮ Back Close
Full Screen / Esc
Printer-friendly Version Interactive Discussion
C2H6does not directly react with bromine. As for alkenes, heavier alkane compounds are not included in the model. The sensitivity studies on the influence of C2H6on the ozone/halogen chemistry are presented in Sect.4.8.
3.6 NOxchemistry
NOx species are photochemically produced in the snowpack (Honrath et al., 1999, 5
2000a,b;Zhou et al.,2001;Beine et al., 2002;Jacobi et al., 2004). The major NOx reactions are listed below.
NO2hν,⇋O2NO + O3 (37)
NO2+ OH −→M HNO3 (38)
NO + HO2 −→ NO2+ OH (39)
10
With sufficiently high NOx concentrations, the concentrations of bromine radicals may be altered via: Br + NO2−→BrNO2 (40) BrO + NO2 M ⇋ BrONO2 (41) BrO + NO −→ Br + NO2 (42) 15
After their formation, bromine nitrate and nitrite may decompose back or photolyze to release reactive bromine:
BrNO2−→hν Br + NO2 (43)
BrONO2−→hν Br + NO3 (44)
Br + BrONO2−→Br2+ NO3 (45)
ACPD
8, 7391–7453, 2008The chemistry influencing ODEs
M. Piot and R. von Glasow Title Page Abstract Introduction Conclusions References Tables Figures ◭ ◮ ◭ ◮ Back Close
Full Screen / Esc
Printer-friendly Version Interactive Discussion
BrONO2may also hydrolyse on liquid surfaces via: BrONO2 H2O
−→HOBr + HNO3 (46)
Also, Sander et al. (1999) suggested that BrONO2 may heterogeneously react with aerosol halides without required acidity (based on experimental observations from
Behnke et al.,1997): 5 BrONO2+ X− aq −→BrXaq+ NO − 3,aq−→BrX (47)
However, in the Arctic, the release of reactive bromine under background NOx levels via this reaction is relatively small (100 times less efficient than Reaction14, due to a small rate coefficient for Reaction47).
The chemistry of nitrous acid (HONO) plays an important role for the complete nitro-10
gen cycle in the troposphere (Perner and Platt,1979;Heikes and Thompson,1983). Measurements in the Arctic during spring indicated intensive photochemical produc-tions in the snowpack constituting a major source of HONO for the boundary layer (Zhou et al.,2001;Beine et al.,2003;Amoroso et al.,2006). The only relevant sink for HONO is its photolysis producing both highly reactive OH and NO molecules:
15
HONO−→hν OH + NO (48)
RONO2is likely to contribute to the NOx budget (Brasseur et al.,1999). For a detailed description of the production and loss of RONO2, see Carter and Atkinson(1985). In the Arctic RONO2mainly reacts via the following reactions:
RONO2−→hν NO2+ products (49)
20
RONO2+ OH −→ HNO3+ products (50)
RONO2+ Cl −→ HCl + NO2+ products (51)
The chemistry of the NOy species (NOx, HONO, and RONO2) is investigated in Sect.4.9.
ACPD
8, 7391–7453, 2008The chemistry influencing ODEs
M. Piot and R. von Glasow Title Page Abstract Introduction Conclusions References Tables Figures ◭ ◮ ◭ ◮ Back Close
Full Screen / Esc
Printer-friendly Version Interactive Discussion
4 Discussion of the sensitivity studies
4.1 Overview
We prescribed a source of gas phase halogens to reproduce ozone depletions with observed time scales. In this paper, for the sake of simplicity, we did not intend to re-alistically reproduce the source of bromine in the model. For a thorough investigation 5
of the source of bromine, the reader is referred to the recent paper fromPiot and von
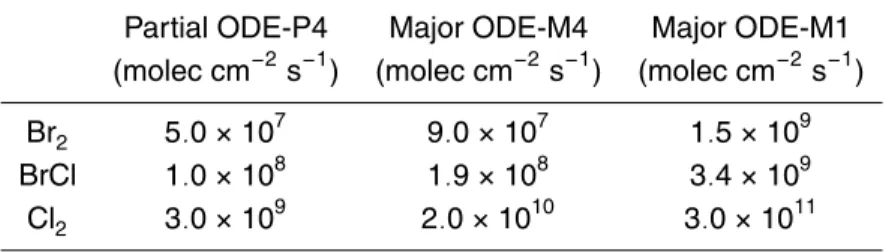
Glasow (2007). We quantified the required fluxes of halogen in accordance with their effects on ozone. Then, we associated the resulting ozone depletions with the classi-fication proposed byRidley et al.(2003) to define the type of ODE. Regarding ozone mixing ratios, we define a partial ODE (PODE) as 4<ξOzone≤20 nmol mol−1and a ma-10
jor ODE (MODE) as ξOzone≤4nmol mol−1. We distinguished major ODEs developing within one day from major ODEs developing within four days (called M1 and M4). Par-tial ODEs developing within 4 days are named P4. Depletions of ozone are reproduced via different sources of halogens. In this study, we analyzed Br2, Cl2and BrCl as the potential sources. Note that no diurnal variation of fluxes is taken into account in this 15
study. The applied source of halogens is prescribed as a constant flux (see Table4). Excessive fluxes of chlorine are discussed in Sect.4.6.
The runs including a prescribed source of halogens and initialized as shown in Table3represent our “base runs”. Figure2illustrates the M1, M4 and P4 ODEs caused by the prescribed Br2 fluxes (Table 4). The names of our sensitivity runs include the 20
source of halogens (Br2, BrCl, or Cl2) and additionally any change compared to the base run. The run Br2-M4 is one of our base runs with a major ozone depletion devel-oping within four days caused by a Br2 flux. The run Br2-M4-DMS=0.20 nmol mol−1is the same run with a different value for the initial mixing ratio of DMS than in the base run.
25
Our sensitivity studies consist of modifying the amount of a species compared to the amount in the base runs. We want to stress that only relevant cases with
infor-ACPD
8, 7391–7453, 2008The chemistry influencing ODEs
M. Piot and R. von Glasow Title Page Abstract Introduction Conclusions References Tables Figures ◭ ◮ ◭ ◮ Back Close
Full Screen / Esc
Printer-friendly Version Interactive Discussion
mative features for halogen or ozone concentrations are discussed in this paper. This paper does not intend to reproduce observed conditions, but rather to investigate the potential influence of several species on the halogen/ozone chemistry. We differentiate three different modification types: a change in initial mixing ratio only, in flux only, or in both. The studied values, for mixing ratios, were increased/decreased by an order of 5
magnitude compared to the initial value used in the base runs. In case flux measure-ments for a species are known, we used an adequate average value for our sensitivity tests (e.g., see Sect. 4.9). When no flux measurement is known at the appropriate location and time of the year, we assumed the fluxes as function of their initial mixing ratio. After evaluation of the potential range of study, lower/upper values for the fluxes 10
in these sensitivity studies are chosen to be 10%/200% of the initial mixing ratio, per day (e.g., ξethane=1.5 nmol mol−1
; flux=0.15/3.0 nmol mol−1day−1). We chose 200% for the upper limit in our study as higher values would induce fluxes in majority exceeding any field observation. The value 10% induced small fluxes which do not considerably modify the gas phase mixing ratio.
15
These fluxes remain constant throughout the model simulations. Diurnal variations that may be observed in the field (Sumner and Shepson, 1999; Zhou et al., 2001;
Hutterli et al., 2001; Foster et al., 2001; Bottenheim et al., 2002a) are therefore not taken into account.
Due to the large number of sensitivity runs we only selected the most relevant runs in 20
this paper. We chose the runs to be discussed with an ODE type (M1, M4, P4), based on the relevance of the applied conditions or their specific chemistry compared to the base run.
4.2 Details of base runs
In order to comprehensively analyze the sensitivity runs, we first describe the main 25
features of the base runs. In Fig.2, O3 undergoing a P4 ODE or a M4 ODE is con-tinuously depleted, with a net slow down in destruction at night due to the absence of reactive halogens. The destruction of O3 during a M1 is very rapid and occurs within
ACPD
8, 7391–7453, 2008The chemistry influencing ODEs
M. Piot and R. von Glasow Title Page Abstract Introduction Conclusions References Tables Figures ◭ ◮ ◭ ◮ Back Close
Full Screen / Esc
Printer-friendly Version Interactive Discussion
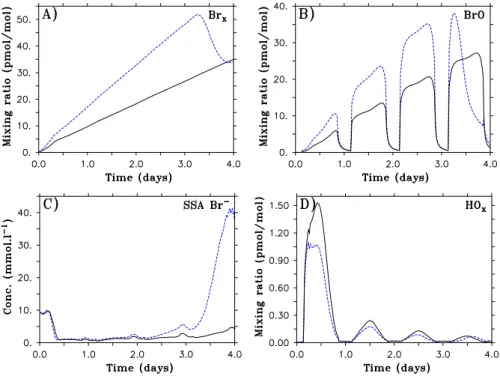
a few hours. In Fig. 3, we show the chemistry of compounds other than O3 for the two base runs Br2-M4 and Br2-P4. Br2-M1 is omitted for clarity. In addition, the base run Br2-M1 will not be investigated in great details in this paper as the required flux is rather unlikely high. Similarly, details of BrCl- and Cl2-induced ODEs will be described in upcoming sections.
5
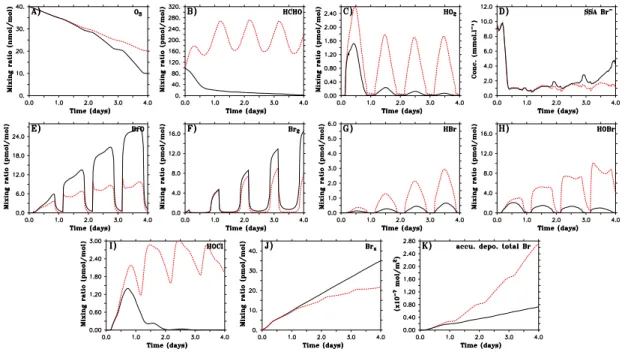
In both M4 and P4 cases, total gas phase bromine (Brx, Fig.3a) increases during the three first simulated days due to the constant flux of Br2. The production of BrO via Reaction (1) increases gradually over time. BrO undergoes a strong diurnal cycle (Fig.3b) as Br atoms are quasi absent at night. Sea salt aerosol Br−is liberated in both cases via the bromine explosion cycle (Fig. 3c) and less reactive bromine is mostly 10
recycled via reaction in acidic sulfate aerosols (not shown). On the last simulated day bromine compounds evolve differently in cases M4 and P4: in the case P4, O3remains above 11 nmol mol−1, and the rates for Reaction (1) do not decrease strongly due to the reduction of O3mixing ratios. Therefore, BrO remains at high mixing ratios during the last day (∼ 25 pmol mol−1). In contrast, in the case M4, the O3destruction is nearly 15
complete 12 h before the end of the run. Rates for Reaction (1) drastically decrease and the BrO production is also reduced (see sharp decrease in Fig.3b). The decrease of this reaction rate leads to a shift in speciation from BrO to Br, and therefore, from HOBr to HBr (see Reactions5 and13). The reduction of HOBr and increase of HBr lead to the re-bromination of the aerosols (see SSA Br−in Fig.3c, on the last day. Sulfate Br− 20
not shown). HOxmixing ratios on the first day are approximately 1 and 1.5 pmol mol−1 in cases M4 and P4, respectively, with a rapid decrease to values below 0.3 pmol mol−1 for the following days. These mixing ratios are similar to measurements obtained by
Bloss et al.(2007) in coastal Antarctica. 4.3 Formaldehyde influence
25
We investigated the influence of a constant flux of HCHO on the development of an ODE. Figure4shows the comparison between the base run Br2-P4 and the run Br2
-ACPD
8, 7391–7453, 2008The chemistry influencing ODEs
M. Piot and R. von Glasow Title Page Abstract Introduction Conclusions References Tables Figures ◭ ◮ ◭ ◮ Back Close
Full Screen / Esc
Printer-friendly Version Interactive Discussion
P4-HCHO where a flux of 5.0×10⁹molec cm−2s−1is prescribed under background air conditions (for these conditions, see Table1). This value is similar to the one used in
Michalowski et al.(2000), and the resulting HCHO mixing ratios in the gas phase are in good agreement with observations (de Serves,1994;Sumner and Shepson,1999;
Sumner et al.,2002). As explained in Sect.3.1a high concentration of HCHO (Fig.4b) 5
increases the reaction rates of Reactions (18) and (19) and increases the production of HO2 via Reactions (16) and (17) (Fig. 4c). Therefore, in this case the halogen speciation is rapidly shifted from X and XO to HOX and HX (also see Reactions5and
13). Mixing ratios of HBr, HCl, HOBr, and HOCl rapidly increase (Figs.4g to i). The uptake of these compounds onto aerosols maintains the rapid aerosol dehalogenation 10
via the bromine explosion process (Reaction14, see Fig.4d).
The sea salt aerosol dehalogenation depends on the ratio [Br−]:[Cl−] (see Fickert
et al.,1999; Adams et al., 2002). Under our conditions, this dehalogenation occurs mostly in the form of a Br2 liberation in the gas phase, but BrCl and Cl2 are also produced.
15
After the near-complete aerosol debromination on the first day (after ≃10 h), both runs undergo a shift in speciation from bromine radicals to HOBr and HBr (shift stronger in Br2-P4-HCHO). This shift reduces the BrO self-reaction (Reactions2–3) which is an efficient cycle for the release of Br atoms. Furthermore, bromine deposition on snow strongly increases (see accumulated deposition in Fig.4k), significantly decreasing the 20
total gas phase bromine concentration in Fig.4j. We calculated that HOBr is responsi-ble for nearly 80% of this increase.
Interestingly, mixing ratios of Br2 in the gas phase (Fig. 4f) show a decrease com-pared to the base run. This decrease is a consequence of the large loss of bromine on snow which reduces the bromine loading in the gas phase.
25
At the end of the model run the amount of highly reactive BrO is reduced by 65% (Fig.4e). As a result O3 mixing ratios are 10 nmol mol−1 higher than in the base run (Fig.4a). Note that Br−in SSA increases during the last simulated day in the base run due to insufficient HOBr in the aqueous phase (see solid black line, Fig.4d).
ACPD
8, 7391–7453, 2008The chemistry influencing ODEs
M. Piot and R. von Glasow Title Page Abstract Introduction Conclusions References Tables Figures ◭ ◮ ◭ ◮ Back Close
Full Screen / Esc
Printer-friendly Version Interactive Discussion
In summary, a flux of HCHO as prescribed here efficiently reduces the ozone deple-tion process, as the PODE4 threshold is reached only at the very end of the simuladeple-tion. In all studied cases with elevated HCHO mixing ratios, HCHO strongly modified the halogen speciation. However, the conditions of high mixing ratios of HCHO differ-ently impacted the ozone chemistry, depending on the concentration of Br−in sea salt 5
aerosols. With high initial aerosol Br−concentrations, the bromine explosion is acceler-ated by the presence of more HCHO and HOx(see explanations above). With very low initial Br− concentrations, the chemistry is characterized only by the shift in bromine speciation and a resulting reduction of available highly reactive bromine radicals (not shown).
10
Under conditions of near-total O3depletion and high concentrations of HCHO in the air (e.g., Br2-M1 with a constant flux of HCHO), the conversion from bromine radicals to HBr and HOBr rapidly leads to an increase in aerosol Br− concentration and therefore, in its deposition on snow. Mixing ratios of Brxdramatically decrease (not shown). We noted no major difference in the chemistry when we applied this case to coastal air 15
conditions (with the changes listed in Table1).
Under conditions of Cl2-induced ODEs, the presence of high HCHO fluxes led to no relevant changes in the ozone chemistry (maximum differences of 1 nmol mol−1).
When prescribing a HCHO flux of 6.0×10⁷molec cm−2s−1, as estimated fromJacobi
et al. (2002) (seePiot and von Glasow,2007), the influence on bromine was negligigle. 20
We conclude that this flux of HCHO has insignificant effects on ozone. These sensitivity studies show that higher fluxes of HCHO possibly causing the observed gas phase concentrations are required to significantly impact the ozone chemistry.
4.4 H2O2
In this section we compare the base run Br2-M4 to Br2 -M4-25
H2O2=1.5×10¹⁰molec cm−2 s−1 (Fig. 5). To the best of our knowledge, fluxes of H2O2 at Alert in spring have not yet been measured. Therefore, we used values for
ACPD
8, 7391–7453, 2008The chemistry influencing ODEs
M. Piot and R. von Glasow Title Page Abstract Introduction Conclusions References Tables Figures ◭ ◮ ◭ ◮ Back Close
Full Screen / Esc
Printer-friendly Version Interactive Discussion
this flux as described in Sect.4.1. Such fluxes out of the snowpack have already been measured by Hutterli et al. (2004), but their location (Summit, Greenland) and the period of measurement (summer) differ significantly from our conditions. This H2O2 flux induces gas phase mixing ratios three to four times higher than observations in the Arctic spring (de Serves,1994). However, these mixing ratios remain in the range of 5
late spring/summertime measurements (Bales et al.,1995;Hutterli et al.,2001;Jacobi
et al.,2002).
The photolysis of H2O2 represents its primary loss pathway (Reaction20), produc-ing highly reactive OH radicals (Fig.5d). Reactions (7) and (21) mainly increase the concentration of HO2 (Fig.5c). Therefore, as explained in Sect. 4.3, higher reaction 10
rates for Reaction (5) and (13) lead to lower mixing ratios of Br and BrO (Fig.5f). The higher mixing ratios of reaction products HOBr (Fig.5e) and HBr maintain an efficient recycling in SSAs (Fig. 5g). Again, the shifted speciation from Br/BrO to HBr/HOBr reduces the efficiency of the BrO self-reaction, and the increase in bromine deposition reduces the total amount of gas phase bromine. Mixing ratios of BrO decrease by up 15
to 10 pmol mol−1 between day 2 and 3 compared to the base run Br2-M4. (Fig. 5f). Consequently, mixing ratios of O3 are about 9 nmol mol−1 higher than in the base run after three days. On the last simulated day, O3 mixing ratios reach the M4 threshold with a 12-hour delay compared to the base run. As the ozone depletion is not complete on this last simulated day, BrO mixing ratios remain high, while they rapidly decrease in 20
the base run Br2-M4 (see Fig.5f). Similarly, the bromine recycling through the aerosol phase remains efficient, keeping Br− concentrations low (Fig.5g), while the base run undergoes a re-bromination (see Sect.4.2).
This flux of H2O2substantially affected the ozone destruction. The aerosol debromi-nation remained more efficient than in the base model run. However, the deposition 25
of bromine on snow (more than 2.0×10⁻⁷mol m−2compared to 0.4×10⁻⁷for the base run) was higher than the bromine production in the gas phase and it strongly reduced the amount of reactive bromine.
ACPD
8, 7391–7453, 2008The chemistry influencing ODEs
M. Piot and R. von Glasow Title Page Abstract Introduction Conclusions References Tables Figures ◭ ◮ ◭ ◮ Back Close
Full Screen / Esc
Printer-friendly Version Interactive Discussion
(2002) (seePiot and von Glasow,2007) for early spring, the ozone chemistry showed no major change. Such a value for the H2O2 flux does not substantially affect the concentration of HOx in the gas phase. It seems, from these results, that the fluxes of H2O2 estimated for the high Arctic in spring are not significantly influencing the ozone chemistry. These sensitivity studies showed that only higher fluxes (most probably 5
related to higher temperatures, e.g., in late spring/summer, seeHutterli et al.,2001) may effectively influence the ozone/halogen chemistry.
4.5 DMS and DMSO “counter-cycle”
To the best of our knowledge, fluxes of DMS have not been measured in the Arc-tic spring. The value for the flux used in this section is explained in Sect. 4.1. Fig-10
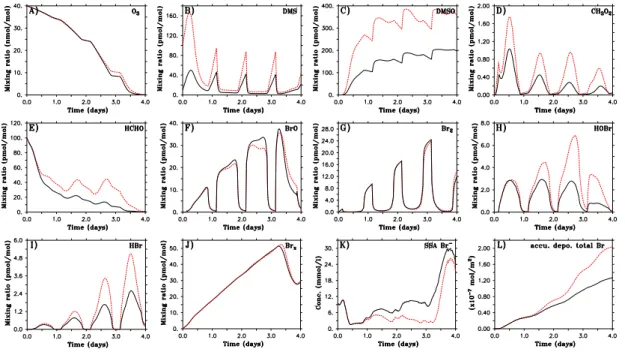
ure6shows a comparison between the base run Br2-M4 and the model run Br2 -M4-DMS=100 pmol mol−1 with a flux of 4.0×10⁹molec cm−2s−1. We investigated DMS only under coastal conditions as it is produced in the ocean.
The primary effect of high concentrations of DMS on the ozone/halogen chemistry is through Reaction (25): BrO oxidizes DMS and produces Br radicals which represents 15
an efficient additional recycling pathway for BrO. Indeed, this reaction leads to slightly more ozone depletion during the first simulated day (about 0.7%). The reaction product DMSO (Fig.6c) then reacts with OH (Reaction 26) to produce CH3O2(Fig.6d). This represents a key reaction initiating a cycle that we call the DMSO “counter-cycle” (see Fig.7). An increase in CH3O2induces more HCHO (Fig.6e) and HO2which eventually 20
affect the bromine distribution. This leads, again, to a shift in bromine speciation as explained in Sects.4.3 and 4.4. Note that the increase of CH3O2 and HCHO starts on the first simulated day, while the bromine speciation shift becomes important only on the following day. The relative variation of BrO compared to the base run is anti-correlated to the relative variations of HOBr and HBr. The presence of more HOBr 25
and HBr in the gas phase (Figs.6h and i) accelerates the aerosol debromination (see Fig.6k). However, the deposition of (mostly) HOBr represents a great sink for bromine (Fig.6l). Br is only slightly affected by the competition between aerosol debromination
ACPD
8, 7391–7453, 2008The chemistry influencing ODEs
M. Piot and R. von Glasow Title Page Abstract Introduction Conclusions References Tables Figures ◭ ◮ ◭ ◮ Back Close
Full Screen / Esc
Printer-friendly Version Interactive Discussion
acceleration enhancing ξBr
x and the increase of bromine deposition decreasing ξBrx
(Fig.6j). In this run, ozone reaches the M4 threshold with a delay of only two hours. In summary, contrary to what one might have expected the reaction between DMS and BrO is not dominating the overall effect of DMS on bromine/ozone under the con-ditions of this run. The production of CH3O2 via reaction between DMSO and OH 5
becomes rapidly important and leads to less Br radicals. Under conditions of near-total ozone destruction (e.g., run Br2-M1 after the first day), the shift in bromine speciation from BrO and Br to mostly HBr leads to a efficient bromination and re-bromination of sulfate and sea salt aerosols, respectively (not shown).
DMS does not react substantially with ClO and the rate coefficient of Reaction (24) 10
is very small. Therefore, DMS does not have an effect on Cl2-induced ODEs.
4.6 Cl2and “chlorine counter-cycle”
All previous ODEs we investigated were induced by a Br2 flux. In this section we present results on Cl2-induced ODEs (see Table4) to study the influence of a Cl2flux on ozone chemistry. Not surprisingly, the prescribed Cl2 fluxes required to reduce O3 15
within the observed time scales were unrealistically high. Nevertheless, we describe these sensitivity runs as they appear interesting for a better understanding of the chem-ical cycles.
We present in Fig.8the base run Cl2-M1. Upon photolysis of Cl2 on the first simu-lated day, the two main reactions using chlorine (Reactions1and27) lead to a strong 20
production of ClO and CH3O2(see Fig.8). Those two reaction products react together to yield HCHO (Reaction30). This reaction, increasing HCHO mixing ratios (Fig.8), also accelerates the reaction rate of Reaction (31). This reaction chain efficiently con-verts Cl/ClO (see HCl compared to the sharp decreases in Cl/ClO a few hours after each sunrise in Fig.8). Additionally, ROOH is produced substantially via Reaction (28) 25
due to the high concentrations of CH3O2 and HO2. Thus, the reaction rate of Re-action (29) also increases and contributes to the rise of HCl mixing ratios. All these reaction pathways are schematically described in Fig.9. This figure clearly shows that
ACPD
8, 7391–7453, 2008The chemistry influencing ODEs
M. Piot and R. von Glasow Title Page Abstract Introduction Conclusions References Tables Figures ◭ ◮ ◭ ◮ Back Close
Full Screen / Esc
Printer-friendly Version Interactive Discussion
the reaction chain initiated by Reaction (27) efficiently induces a direct (Reactions27,
29, and31) or indirect (Reactions28and30) conversion from reactive chlorine to less reactive HCl. HCl drastically increases to reach unrealistically high mixing ratios of several tens of nmol mol−1.
In summary, Cl and ClO radicals rapidly react to produce compounds (HOx, ROOH 5
or CH3O2) which eventually react back with Cl/ClO to release HCl. We call this negative feedback “chlorine counter-cycle”.
As highlighted in this section, a higher flux of chlorine radicals induces an even stronger “chlorine counter-cycle”, shifting chlorine to HCl. In order to induce a major ODE within one day (M1), it is necessary to prescribe an unrealistically high Cl2flux of 10
3.0×10¹¹molec cm−2s−1to keep the reaction between Cl and O3(Reaction1) efficient. Mixing ratios of ClO (up to 1 nmol mol−1) and Cl (order of pmol mol−1) are inconsistent with measurements made in the Arctic (Tuckermann et al., 1997;Impey et al.,1997;
Perner et al.,1999;Boudries and Bottenheim,2000). We conclude that the presence of this efficient “chlorine counter-cycle”, as explained in this section, makes a Cl2-induced 15
ODE unrealistic.
This counter-cycle cannot initiate in case of Br2-induced ODEs, as there is no reac-tion between bromine atom and CH4, which is the key reaction to yield CH3O2in case of Cl2-induced ODEs.
It is noteworthy mentioning the effect of this counter-cycle on Br2-induced ODEs 20
including high concentrations of chlorine. In our sensitivity studies this counter-cycle appeared to have a substantial influence on the eventual ozone mixing ratios in several runs. As an example, Fig.10 shows the comparison between the base run Br2-M4 and Br2-M4-Cl2=5.0×10⁸molec cm−2s−1 under coastal air conditions. In this case Cl concentrations of up to 2.5×10⁻³pmol mol−1 released via Cl2 photolysis is sufficiently 25
high to “activate” the counter-cycle and therefore, slow down the ozone destruction via reduction of BrO and Br. After the sunrise on the first day, mixing ratios of ClO rapidly rise to a maximum of 7 pmol mol−1 (Fig. 10b) mostly via Reaction (1). This contributes to the slight decrease in O3 on the first day compared to the base run
ACPD
8, 7391–7453, 2008The chemistry influencing ODEs
M. Piot and R. von Glasow Title Page Abstract Introduction Conclusions References Tables Figures ◭ ◮ ◭ ◮ Back Close
Full Screen / Esc
Printer-friendly Version Interactive Discussion
(Fig.10a). As highlighted in this section, the high mixing ratios of Cl and ClO lead to the activation of the chlorine counter-cycle: CH3O2, HOx, and ROOH substantially increase (see Figs. 10d and e). Several hours after each sunrise of the model run, chlorine radicals undergo the sharp decrease attributed to the counter-cycle (see Fig.10b with mean values similar to observations fromPerner et al.,1999;Tuckermann et al.,1997) 5
and are converted to unreactive HCl (Fig. 10c). As a consequence, higher mixing ratios of CH3O2 increase reaction rates of Reactions (11–12), while reaction rates of Reactions (5, 13, 18 and 19) are higher due to increased HO2 and HCHO (see Fig. 10e). Again, bromine undergoes a shift in speciation from Br/BrO to HBr/HOBr (Figs.10f to h).
10
This case highlights that high concentrations of bromine together with chlorine may lead to unexpected halogen interactions. The eventual effect on ozone depends on the activation state of the chlorine counter-cycle.
The chemistry of BrCl-induced ODEs is similar to that of a Br2-induced ODE includ-ing a flux of chlorine. In the P4 ozone destruction, the release of chlorine via the flux 15
of BrCl (1.0×10⁸molec cm−2 s−1, see Table 4) is too small to “activate” the chlorine counter-cycle. The bromine chemistry in the BrCl-P4 case remains nearly identical to the chemistry described for the base run Br2-P4. Therefore, the required flux for BrCl to induce an equivalent P4 as for Br2-P4 is stochiometrically similar to the Br2flux. Such a flux of BrCl induces realistic loadings of chlorine in the model: ξClO∼2 pmol mol−1 20
(seePerner et al.,1999), ξCl∼4×10⁻⁴pmol mol−1 (seeJobson et al.,1994;Boudries and Bottenheim,2000), and ξCl2∼2 pmol mol−1(seeFoster et al.,2001). The BrCl-M4 base run does show a small influence of the counter-cycle on the bromine chemistry. This can be highlighted by increased concentrations of HBr compared to the concen-trations in Br2-M4 (increase of about 40%). Therefore, the BrCl flux required to induce 25
an equivalent M4 ODE as in the Br2case is slightly higher than the stochiometric ratio with Br2 (1.9×10⁸ compared to 2×9.0×107molec cm−2s−1). In addition, loadings of chlorine in the model do not differ substantially from the BrCl-P4 run. Mixing ratios of BrCl in BrCl-M4 reach 7 pmol mol−1, while they have a maximum of 5 pmol mol−1
ACPD
8, 7391–7453, 2008The chemistry influencing ODEs
M. Piot and R. von Glasow Title Page Abstract Introduction Conclusions References Tables Figures ◭ ◮ ◭ ◮ Back Close
Full Screen / Esc
Printer-friendly Version Interactive Discussion
in BrCl-P4. In the BrCl-M1 base run, the chlorine counter-cycle is clearly activated and it strongly affects the bromine chemistry by shifting reactive bromine to mainly HBr (10 to 20 times higher in BrCl- than Br2-induced ODEs, not consistent with predic-tions from other models, seeFan and Jacob,1992;Sander et al.,1997;Lehrer et al.,
2004). BrCl mixing ratios reach a maximum of 38 pmol mol−1 which is a rather high 5
value compared to measurements made byFoster et al.(2001). The required flux of BrCl, compared to Br2, is substantially higher than the stochiometric ratio (3.4×10⁹ compared to 2×1.5×109molec cm−2s−1), showing that the chlorine counter-cycle is activated. These studies show that only the chemistry of the BrCl-P4 and BrCl-M4 runs lies within the range of observations.
10
4.7 C2H4
Ethene (C2H4) chemistry is characterized by the three reactions listed in Sect.3.4. In this section we compare the base run Br2-M4 with Br2-M4-C2H4=0.8 nmol mol−1under coastal conditions (Fig.11). Such a high mixing ratio for C2H4corresponds to an upper limit, but this value lies within the variability of observations during Arctic spring (Doskey
15
and Gaffney,1992;Ariya et al.,1999).
Mixing ratios of OH (Fig.11c) and Cl (released from SSA; Fig. 11d) decrease, but the Cl chemistry does not affect the ozone/bromine concentration under these condi-tions (ξCl too low, but similar to measurements fromJobson et al.,1994;Boudries and
Bottenheim,2000). The increase in ξC2H4 reduces HOxlifetime via Reaction (33). 20
Therefore, this reaction tends to reduce the formation of HOBr from Br/BrO radi-cals. However, in the case of Br2-M4-C2H4=0.8 nmol mol−1 Reaction (34) is acceler-ated (see Fig. 11e). This reaction prevails over Reactions (32) and (33) during the whole model run and increases the formation of HBr. Thus, BrO mixing ratios de-crease strongly (Fig.11i). Clearly, the decrease of HOBr (Fig. 11g) reduces the effi-25
ciency of the bromine explosion mechanism and the shift of bromine speciation to HBr and its subsequent uptake to particles leads to a drastic increase in sulfate and sea
ACPD
8, 7391–7453, 2008The chemistry influencing ODEs
M. Piot and R. von Glasow Title Page Abstract Introduction Conclusions References Tables Figures ◭ ◮ ◭ ◮ Back Close
Full Screen / Esc
Printer-friendly Version Interactive Discussion
salt aerosol Br− (Fig.11h, not shown for sulfate aerosols). Br− concentrations in SSA are up to 20 mmol l−1 higher than in the base run Br2-M4. This scenario shows that the presence of large amounts of C2H4 notably reduces the efficiency of the bromine explosion. This and the conversion from Br atoms to less reactive HBr lead to less available bromine radicals for the depletion of ozone. The ozone mixing ratio drops 5
only to 11 nmol mol−1within four days, which is equivalent to a “P4” event.
However, it is important to note that the C2H4 destruction reactions may compete with each other, depending on the amount of C2H4in the model run. In order to assess the influence of Reaction (33) compared to Reaction (34), we performed additional model runs with ξC2H4=0.5 and 0.01 nmol mol−1. In Fig.12, we compare ozone mixing 10
ratios of the different runs with ozone in (A) Br2-M4 and (B) Br2-P4. In Fig.12a, these ratios for C2H4=0.8 and C2H4=0.5 nmol mol
−1
show that ozone for these runs is less depleted than for the base run, due to the reduction in the bromine explosion cycle, as explained above. Interestingly, however, ozone is also temporarily less depleted than in the base run under conditions of ξC
2H4=0.01 nmol mol
−1
(less C2H4than in the 15
base run). With low ξC
2H4 the reduced rate of Reaction (33) allows more HOxto react
with bromine radicals to form HOBr. Similarly, a reduction in the rate of Reaction (34) leads to less HBr. The increase and slight decrease of HOBr and HBr, respectively, induce a moderate acceleration of the SSA debromination compared to the base run. Nevertheless, as highlighted in previous sections, the formation of HOBr reduces Brx 20
via increased deposition at the surface.
As a consequence, less bromine radicals are available compared to the base run. The difference to the base run M4 is highest in the morning of day 3. Later, ozone rapidly decreases and becomes more depleted than in the base run M4. This change in ozone destruction is the result of a large decrease in reaction rate of Reaction (34). 25
At the end of the model run Br2-M4-C2H4=0.01 nmol mol−1, C2H4 is completely de-stroyed. Therefore, the concentration of Br atoms increases compared to the base run, which leads to a more efficient ODE on the last day. This specific time span highlights the importance of Reaction (34) in reducing the amount of available Br atoms, although
ACPD
8, 7391–7453, 2008The chemistry influencing ODEs
M. Piot and R. von Glasow Title Page Abstract Introduction Conclusions References Tables Figures ◭ ◮ ◭ ◮ Back Close
Full Screen / Esc
Printer-friendly Version Interactive Discussion
the rate coefficient for this reaction is small.
Under conditions of a P4 ODE, an increase of ξC
2H4 compared to 0.08 nmol mol
−1 (base run Br2-P4) leads, again, to a decrease in ozone depletion via the reduction of the bromine explosion and the conversion from Br atoms to HBr (see Fig.12b). The model run with ξC
2H4=0.01 nmol mol
−1
displays a similar chemistry as explained for the 5
case Br2-M4. However, C2H4 does not drop down to zero at the end of the run as in Br2-M4-C2H4=0.01 nmol mol−1. Therefore, Reaction (34) remains efficient during the whole model run. Ozone mixing ratios at the end of the model run (Fig.12b) remain slightly higher than in the base run P4.
This study highlighted that high concentrations of ethene strongly reduced the 10
bromine explosion and therefore, the ozone depletion. Low concentrations of ethene, however, allow substantial amounts of HOx to be present in the atmosphere, which shifts reactive bromine to less reactive HOBr. Such concentrations may then lead to a decrease in ozone destruction as well.
Prescribing a flux of 1.3×10⁸molec cm−2 s−1 of C2H4, as measured by Swanson
15
et al. (2002), showed only a very weak influence on ozone: ξO3 only increased by less than 1 nmol mol−1. Fluxes measured in the field seem to have no noticeable influence on the bromine/ozone chemistry, but notice that the resulting C2H4mixing ratios in the model only increases by 10 pmol mol−1 due to this prescribed flux. Only higher fluxes of C2H4may affect the halogen/ozone chemistry.
20
4.8 C2H6
First, we will discuss sensitivity studies on Br2-induced ODEs. The observed variability of C2H6 in the Arctic is relatively small (between 1 and 4 nmol mol−1, seeAriya et al.,
1999). When investigating realistic values for C2H6mixing ratios, we noted no relevant change in ozone. For a better understanding of the C2H6 chemistry, we also investi-25
gated the effects of higher mixing ratios (an order of magnitude higher than observed values, with ξC2H6=15 nmol mol−1, see Table3).
ACPD
8, 7391–7453, 2008The chemistry influencing ODEs
M. Piot and R. von Glasow Title Page Abstract Introduction Conclusions References Tables Figures ◭ ◮ ◭ ◮ Back Close
Full Screen / Esc
Printer-friendly Version Interactive Discussion
We compare now the base run Br2-M4 with Br2-M4-C2H6=15 nmol mol−1 under background conditions (Fig.13). In our model C2H6only reacts with OH and Cl with a rate coefficient for Reaction (35) approximately 500 times higher than for Reaction (36). Under Br2-M4 conditions, however, the concentration of Cl is very low: Reaction (35) is negligible compared to Reaction (36). The removal of OH radicals from the atmo-5
sphere by C2H6 (Reaction 36) is an important pathway reducing the concentration of HOx (Fig.13c and d) as well as HCHO (Fig.13e). As explained in previous sections this decrease in oxidant concentrations reduces the production of HOBr and HBr (see Fig. 13g) and slows the bromine explosion cycle down. In this investigation, the lim-itation in HOx prevails and increases the mixing ratio of BrO by at most 2 pmol mol−1 10
(Fig.13f). The more efficient BrO self-reaction leads to a faster recycling of bromine oxide and a stronger ozone destruction (with a maximum decrease of 2 nmol mol−1 compared to the base model run, Fig.13a). ODEs caused by Br2 emissions are en-hanced under high concentrations of ethane. Ethane cleanses the air from high reac-tive oxidants which hinder the BrO self-reaction. However, relareac-tively high mixing ratios 15
of ethane do not substantially affect the ozone chemistry.
We also investigated Cl2-induced ODEs with increased mixing ratios of C2H6. In all ODE cases (M1, M4 and P4), Reaction (35) prevailed and induced weaker depletions of ozone. C2H6effectively diminishes the availability of Cl atoms. Therefore, C2H6directly reduces the chlorine-induced ozone destruction chain. By prescribing 15 nmol mol−1 20
of C2H6 compared to 1.5 nmol mol−1 in the base runs, ozone only reached the M2 threshold compared to Cl2-M1, P4 compared to Cl2-M4, and no ODE compared to Cl2-P4, respectively.
This study shows that ethane is mainly important for chlorine-related chemistry via direct reaction between C2H6and Cl. Ethane does not influence the bromine chemistry 25
ACPD
8, 7391–7453, 2008The chemistry influencing ODEs
M. Piot and R. von Glasow Title Page Abstract Introduction Conclusions References Tables Figures ◭ ◮ ◭ ◮ Back Close
Full Screen / Esc
Printer-friendly Version Interactive Discussion
4.9 HONO, NO2, and RONO2
Field measurements in the Arctic spring have highlighted the production of HONO molecules originating from the snowpack. Zhou et al. (2001) measured hourly-averaged HONO flux in the range of 0–1.0×10⁹molec cm−2s−1 with a mean value of 5.0×10⁸molec cm−2s−1. In this section we investigate the importance of this mean 5
value for the flux of HONO. Figure 14 shows the comparison between Br2-P4 and Br2-P4-HONO=5.0×10⁸molec cm−2s−1 under background air conditions. At daytime, photolysis is the dominant loss for HONO (Reaction48). OH (Fig. 14c) and NO (see Fig.14e) radicals are rapidly produced.
As described earlier in this paper higher mixing ratios of OH induce a stronger pro-10
duction of HO2(mostly via Reaction7, Fig.14d). The presence of higher mixing ratios of HO2compared to the base run leads to a shift in bromine speciation from Br/BrO to HBr/HOBr (Figs.14h and i). Again, as described earlier, such HOBr mixing ratios accel-erate the aerosol debromination via the bromine explosion (Fig.14j), but its deposition on snow also substantially reduces the amount of available bromine. Furthermore, the 15
production of HOBr in the case of Br2-P4-HONO=5.0×10⁸molec cm−2s−1 induces a slow down in the rapid BrO self-reaction. These reactions contribute to the reduction of available highly reactive bromine (Fig.14g) for the ozone depletion.
In addition, NOx production from the photolysis of HONO accelerates the rates of Reactions (40) to (47). Reaction (42) accelerates the BrO recycling into Br atoms. 20
However, Reactions (40) and (41) rapidly produce BrNO2 and BrONO2 during day-time, with BrONO2 reaching maxima of about 2 pmol mol−1 (not shown). BrONO2, more reactive than BrNO2, may heterogeneously react with aerosol surfaces to convert halides into photolysable halogens (Reaction47). However, the aerosol debromination induced by this reaction pathway is about two orders of magnitude smaller than via 25
Reaction (14). Indeed, BrNO2 and BrONO2 rather represent a temporary gas phase reservoir of bromine. In this model run, deposition of BrONO2 was found important for the loss of bromine on the snow. We calculated that the total bromine deposition
ACPD
8, 7391–7453, 2008The chemistry influencing ODEs
M. Piot and R. von Glasow Title Page Abstract Introduction Conclusions References Tables Figures ◭ ◮ ◭ ◮ Back Close
Full Screen / Esc
Printer-friendly Version Interactive Discussion
contributed, at the end of the model run, more than 30% to the total amount of bromine in the run compared to 10% for the base run (not shown). Bromine deposition on snow is higher than the bromine release from the bromine explosion. Brx mixing ratios decrease (Fig.14f) and reduce the availability of reactive bromine (Fig. 14g). Conse-quently, O3 is destroyed less and displays a final mixing ratio of 16.5 nmol mol−1 after 5
the four simulated days compared to 12.0 for Br2-P4 (Fig.14a).
Under conditions of the prescribed flux of HONO from the snow, maximum NOx mixing ratios remain near 2 pmol mol−1, as opposed to undetectable values in the base run Br2-P4 (see Fig. 14e after the first simulated day). The flux of HONO induced a moderate acid displacement in SSAs (seeRobbins et al.,1959). The presence of NOx 10
leads to the production of HNO3 throughout the model run (via mainly Reaction 38, Fig.14k). The uptake of this strong acid in SSAs induces an increase in acidity (H+) and NO−3 ions. In our model run with a HONO flux, the SSA H+concentration is 5 to 10 times higher than in the base run, which modifies the equilibrium of reaction H++Cl− ↔HClaq to the right. Therefore, the uptake of HNO3leads to the outgassing of HCl. 15
Gas phase HCl chemistry is, however, driven at daytime by the increased release of Cl2 and BrCl in the gas phase compared to Br2 (Fig. 14l), as the equilibrium for Reaction (14) is also modified.
At night the absence of OH radicals stops the production of HNO3via Reaction (38). Therefore, the acid displacement in SSA is interrupted as well and HClgas is taken up 20
into aerosols. HCl reaches a maximum of 16 pmol mol−1 at the end of the model run (Fig.14l) and SSA chloride displays a net decrease over the model run (not shown).
These model results indicate that concentrations of NOx, under the influence of such a flux of HONO in Arctic regions, may be associated with high concentrations of gas phase chlorine, if chloride is present in aerosols (also see Hara et al., 2002). We 25
encourage field experiments to find evidences for this specific chemistry in order to confirm these results.
Under coastal air conditions, the presence of high mixing ratios of HOBr and BrONO2 with a higher number of SSAs containing Br−(due to the SSA production) induces more