HAL Id: hal-02111988
https://hal-amu.archives-ouvertes.fr/hal-02111988
Submitted on 26 Apr 2019
HAL is a multi-disciplinary open access
archive for the deposit and dissemination of
sci-entific research documents, whether they are
pub-lished or not. The documents may come from
teaching and research institutions in France or
abroad, or from public or private research centers.
L’archive ouverte pluridisciplinaire HAL, est
destinée au dépôt et à la diffusion de documents
scientifiques de niveau recherche, publiés ou non,
émanant des établissements d’enseignement et de
recherche français ou étrangers, des laboratoires
publics ou privés.
LES in a Concentric Annular Pipe: Analysis of Mesh
Sensitivity and Wall Pressure Fluctuations
Saptarshi Bhattacharjee, Guillaume Ricciardi, Stéphane Viazzo
To cite this version:
Saptarshi Bhattacharjee, Guillaume Ricciardi, Stéphane Viazzo. LES in a Concentric Annular Pipe:
Analysis of Mesh Sensitivity and Wall Pressure Fluctuations. Direct and Large-Eddy Simulation X,
pp.93-100, 2018, 978-3-319-63211-7. �hal-02111988�
of Mesh Sensitivity and Wall Pressure
Fluctuations
S. Bhattacharjee, G. Ricciardi and S. Viazzo
1
Introduction
Annular pipe flows have varied application in the domains of nuclear reactors, heat exchangers, drilling operations in oil industry etc. The first part of the paper (Sect.2) presents a comparison of large eddy simulations (LES) of turbulent flow in a con-centric annular pipe for 5 different mesh resolutions. Results are compared with benchmark DNS data. The second part (Sect.3) presents its interesting application of pipe flow in the nuclear field. Inside a pressurized water nuclear reactor (PWR) core, flow-induced vibrations due to spacer grids can cause damage to the structure. Understanding this behavior is a challenge. Here the effect of a ‘simplified’circular spacer grid on the vortex induced vibrations of the pipe is investigated. LES was performed with the CFD code Trio_U [9] which uses a hybrid finite volume based finite element approach [1]. Simulations were carried out on the Airain and Curie supercomputers at the Computing Center for Research and Technology (CCRT), Bruyères-le-Châtel, France [2].
S. Bhattacharjee (
B
)· G. RicciardiG. Ricciardi
e-mail: guillaume.ricciardi@cea.fr S. Bhattacharjee· S. Viazzo
Laboratoire de Mécanique, Modélisation et Procédés, Propres (M2P2),
UMR7340 CNRS, Aix-Marseille Université, Centrale Marseille, 13451 Marseille Cedex, France e-mail: stephane.viazzo@univ-amu.fr
93 French Alternative Energies and Atomic Energy Commission (CEA)-Cadarache Center,
DEN/DTN/STCP/LHC, 13108 St Paul lez Durance Cedex, France e-mail: saptarshi.bhattacharjee@outlook.com
94 S. Bhattacharjee et al.
2
Mesh Sensitivity Analysis for LES in a Concentric
Annular Pipe
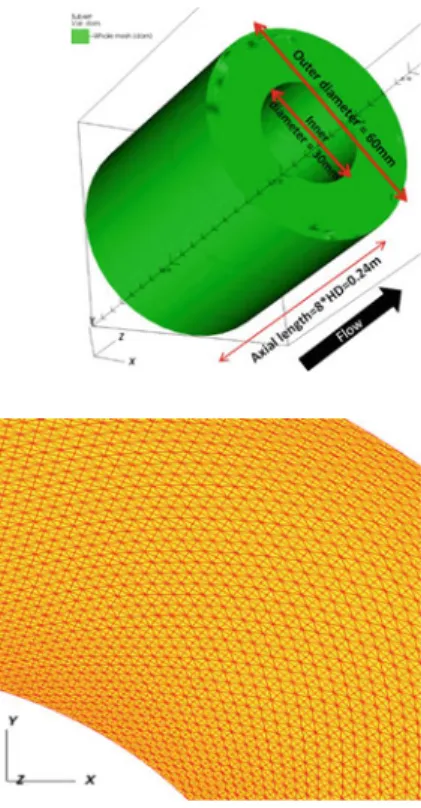
The outer and inner diameters of the pipe were 60 mm and 30 mm respectively. The radius ratio, i.e., the ratio between the inner and outer radii was 0.5. Water flowed through the pipe in axial direction. A schematic diagram is shown in Fig.1. The hydraulic diameter, defined as HD= 4Af low/Pwet, was 0.03 m where Af lowis the
surface area of duct cross-section and Pwetis the wetted perimeter. The bulk velocity
was 0.298 m/s. Reynolds number based on the bulk velocity and hydraulic diameter was 8900. The length of the domain was 0.24 m, i.e., 8 times hydraulic diameter.
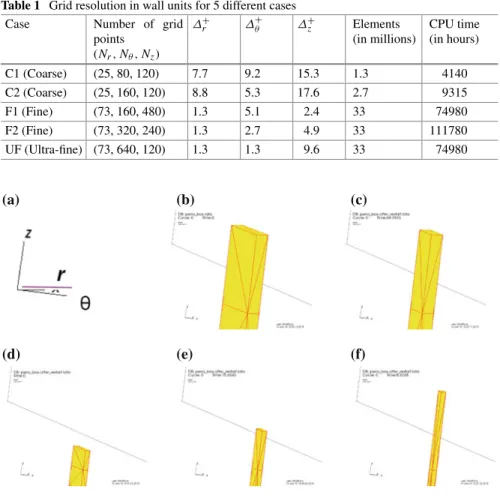
Fully structured tetrahedral meshes were generated with Gmsh [4] and Trio_U’s internal meshing tool. The grid was more refined near the boundary in radial direc-tion to study the near-wall behavior (Fig.2). It was uniform in axial and azimuthal directions. Five different mesh resolutions were considered. Table1shows the num-ber of grid points as well as the grid resolution in wall units in each direction for each simulation. Figure3a–f illustrate the stretching of the tetrahedral elements relative to each other.
Fig. 1 Schematic diagram
of the pipe
Fig. 2 Non-uniform grid
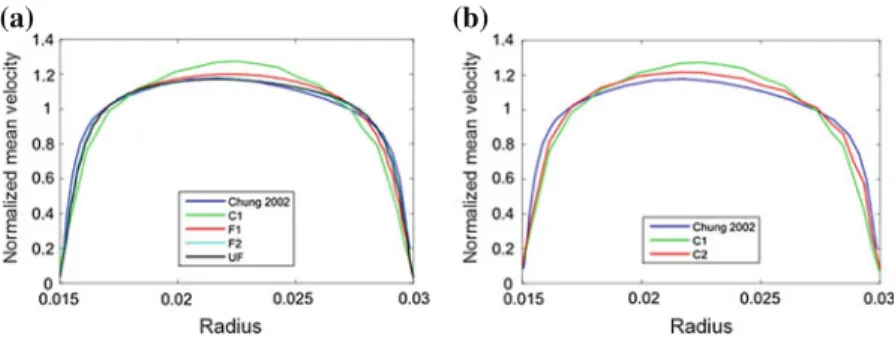
Table 1 Grid resolution in wall units for 5 different cases
Case Number of grid points (Nr, Nθ, Nz) Δ+ r Δ+θ Δ+z Elements (in millions) CPU time (in hours) C1 (Coarse) (25, 80, 120) 7.7 9.2 15.3 1.3 4140 C2 (Coarse) (25, 160, 120) 8.8 5.3 17.6 2.7 9315 F1 (Fine) (73, 160, 480) 1.3 5.1 2.4 33 74980 F2 (Fine) (73, 320, 240) 1.3 2.7 4.9 33 111780 UF (Ultra-fine) (73, 640, 120) 1.3 1.3 9.6 33 74980 (a) (b) (c) (d) (e) (f)
Fig. 3 a Axes, b C1 (Coarse), c C2 (Coarse), d F1 (Fine), e F2 (Fine), f UF (Ultra-fine)
Space discretization was done with the second order centered stabilized “EF_stab” scheme [6] and time discretization with the second order explicit Adams-Bashforth scheme. The wall-adaptive local eddy viscosity (WALE) model [7] was used to model the universal small scale eddies. In cases where the grid resolution near the wall is not of order 1, the Reichardt wall law [5] was used.
Due to the regular pattern of the grid, a constant velocity profile as initial condition was not sufficient to generate turbulence. So a fully developed turbulent flow field from another simulation (on a coarser mesh) was used as initial condition. Periodic boundary condition was applied axially. A momentum source term was added to maintain constant flow rate. Two point correlation coefficient between the velocity component in the streamwise (axial) direction is plotted in Fig.4. It falls to zero at half a period suggesting that the streamwise domain length is sufficient. No-slip condition was imposed on the inner and outer walls.
96 S. Bhattacharjee et al.
Fig. 4 Two point correlation for streamwise velocity
Fig. 5 Standard deviation of velocity for F2 case
(a) (b)
Fig. 6 a Comparison for fine meshes, b Comparison for coarse meshes
2.1
Results
The turbulent statistics were collected after the flow stabilized. The averaging was done over 25 flow traversals. For the case F2, standard deviation of radial and axial velocity was computed as shown in Fig.5. It is in good agreement with experimental data of [8]. A comparison of mean velocity profiles for 4 different simulations in Table1is presented in Fig.6a. Comparison of the coarse C1 profile with F1 shows an improvement due to the refinement in all directions. The F2 mesh was created with the same number of elements as F1 but the resolution in azimuth was doubled and
that in axial was halved. The profile for F2 agrees well with DNS of [3]. UF mesh also shows similar profile as F2. Hence one could go up to the resolution in wall units of the order of 10 in axial, 3 in azimuthal and 1.3 in radial to reproducing the benchmark result. It should be noted that the total number of elements was maintained for cases F1, F2, UF. The above sensitivity analysis shows that the mean velocity profile has a stronger dependence on azimuthal resolution compared to axial resolution for the 4 said meshes. A similar test was made with the coarse mesh. The azimuthal resolution in C1 was doubled to create C2 mesh. Again, Fig.6b shows a significant improvement in the profile from C1 to C2.
3
Pressure Fluctuations in an Annular Pipe
with a Circular Grid
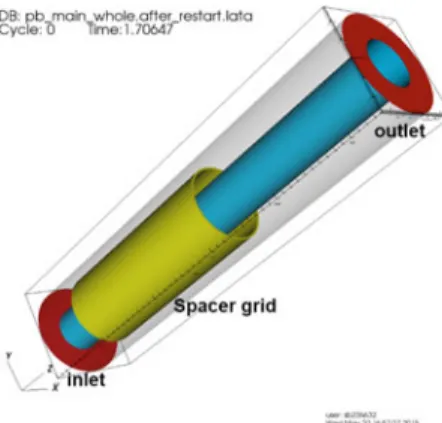
A realistic PWR core has a square spacer grid. However, creation of a square grid inside an annular pipe would lead to unstructured mesh (at least in its vicinity if we implement hybrid meshing). Since the aim is to understand the physics of the problem, we implemented a circular grid instead. As a result, generation of a fully structured mesh was possible. Also the domain became symmetric. This improved the speed of simulation. In order to make it more realistic, the ratio of hydraulic diameters between the inner and outer flow areas was kept the same for both types of grids. The pipe with the circular grid is shown in Fig.7. The length of the domain was 0.2688 m, i.e., approximately 9 hydraulic diameters.
Table2presents the grid resolutions in different directions. An attempt was made to keep in consideration the acceptable resolutions obtained in Sect.2.1. However, as seen from Table2, some compromise had to be made due to lack of computational time and resources. The domain consisted of 20.7 million tetrahedrons and simulation was carried out on 710 parallel processors. All numerical parameters were the same as in Sect.2except the boundary conditions at the inlet and outlet. A fully developed
Fig. 7 Annular pipe with
98 S. Bhattacharjee et al.
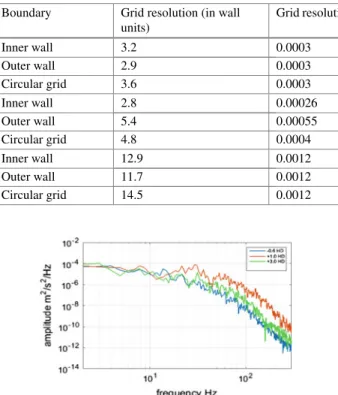
Table 2 Grid resolution
Direction Boundary Grid resolution (in wall units)
Grid resolution (in meters)
Radial Inner wall 3.2 0.0003
Outer wall 2.9 0.0003
Circular grid 3.6 0.0003
Azimuthal Inner wall 2.8 0.00026
Outer wall 5.4 0.00055
Circular grid 4.8 0.0004
Axial Inner wall 12.9 0.0012
Outer wall 11.7 0.0012
Circular grid 14.5 0.0012
Fig. 8 PSD of instantaneous velocity
turbulent velocity field was injected at the inlet at each time step (from a simultaneous LES). A constant pressure zero was imposed at the outlet.
3.1
Results
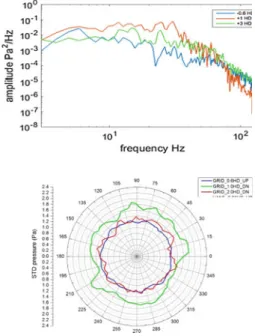
Instantaneous velocity fluctuations were analyzed in terms of power spectral density (PSD) at 3 heights: 0.6 HD upstream, 1 HD downstream and 3 HD downstream. Figure8shows that the amplitude of fluctuations 1 HD downstream is a decade higher than that upstream. At 3 HD, the amplitude is reduced but still higher than that upstream. This increase in fluctuation is due to the presence of the circular spacer grid. In Fig.9, the PSD of pressure fluctuations on the inner wall of the pipe shows that the amplitude of fluctuation is higher downstream compared to upstream. The fluctuations or amplitude of power decrease with frequency. Figure10 shows an angular distribution of standard deviation of the pressure field on the inner wall. The deviation increases by 50% at 1 HD downstream. The symmetric distribution is due to the symmetry of the grid.
Fig. 9 PSD of pressure
fluctuations on the inner wall
Fig. 10 Angular distribution
of standard deviation of pressure on the inner wall
4
Conclusion
A mesh sensitivity analysis with structured grids was performed in an annular pipe using LES. Velocity profiles for 5 different meshes were compared with benchmark DNS, following which an acceptable grid resolution of the order of 10 (axial), 3 (azimuthal) and 1.3 (radial) in wall units was proposed. It was observed that the results are more sensitive to azimuthal resolution than axial resolution. Presence of a circular spacer grid in the pipe increased the fluctuation downstream of the grid as seen from the PSD plots of velocity and wall pressure. As future work, it would be interesting to repeat the same study with a square spacer grid. Also the grid resolutions in Table2could be improved to reach the one discussed in Sect.2.1.
References
1. Bieder, U., Graffard, E.: Qualification of the CFD code Trio_U for full-scale reactor applications. Nucl. Eng. Des. 238, 671–679 (2008)
2. CCRT-Computing Center for Research and Technology, France. http://www-hpc.cea.fr/en/ complexe/tgcc-curie.htm
3. Chung, S.Y., Rhee, G.H., Sung, H.J.: Direct numerical simulation of turbulent concentric annular pipe flow Part 1: Flow field. Int. J. Heat Fluid Flow. 23, 426–440 (2002)
4. Geuzaine, C., Remacle, J.F.: Gmsh–A three dimensional finite element mesh generator with built-in pre- and post-processing facilities. Int. J. Numer. Methods Eng. 79, 1309–1331 (2009) 5. Hinze, J.O.: Turbulence. McGraw-Hill, New York (1959)
100 S. Bhattacharjee et al. 6. Kuzmin, D., Turek, S.: Multi dimensional FEM-TVD paradigm for convection-dominated flows.
Proc. ECCOMAS, Jyvaskyla. 24–28 July, 1–19 (2004)
7. Nicoud, F., Ducros, F.: Sub-grid scale stress modeling based on the square of the velocity gradient tensor. Flow Turbul. combust. 62, 183–200 (1999)
8. Nouri, J.M., Umur, H., Whitelaw, J.H.: Flow of Newtonian and non-Newtonian fluids in con-centric and eccon-centric annuli. J. Fluid Mech. 253, 617–641 (1993)
9. Trio_U-Computational Fluid Dynamics code version 1.7.0: French Alternative Energies and Atomic Energy Commission (CEA), France.http://www-trio-u.cea.fr