HAL Id: hal-00298108
https://hal.archives-ouvertes.fr/hal-00298108
Submitted on 10 Jun 2008
HAL is a multi-disciplinary open access
archive for the deposit and dissemination of
sci-entific research documents, whether they are
pub-lished or not. The documents may come from
teaching and research institutions in France or
abroad, or from public or private research centers.
L’archive ouverte pluridisciplinaire HAL, est
destinée au dépôt et à la diffusion de documents
scientifiques de niveau recherche, publiés ou non,
émanant des établissements d’enseignement et de
recherche français ou étrangers, des laboratoires
publics ou privés.
climate change in Angola (Ocean Drilling Program Site
1078)
L. M. Dupont, H. Behling, J.-H. Kim
To cite this version:
L. M. Dupont, H. Behling, J.-H. Kim. Thirty thousand years of vegetation development and climate
change in Angola (Ocean Drilling Program Site 1078). Climate of the Past, European Geosciences
Union (EGU), 2008, 4 (2), pp.107-124. �hal-00298108�
www.clim-past.net/4/107/2008/
© Author(s) 2008. This work is distributed under the Creative Commons Attribution 3.0 License.
of the Past
Thirty thousand years of vegetation development and climate
change in Angola (Ocean Drilling Program Site 1078)
L. M. Dupont1, H. Behling2, and J.-H. Kim3
1MARUM – Center for Marine Environmental Sciences, University of Bremen, Bremen, Germany
2Palynology and Climate Dynamics, Albrecht-von-Haller-Inst. for Plant Sciences, Univ. of G¨ottingen, G¨ottingen, Germany 3NIOZ, Texel, The Netherlands
Received: 13 December 2007 – Published in Clim. Past Discuss.: 31 January 2008 Revised: 7 May 2008 – Accepted: 22 May 2008 – Published: 10 June 2008
Abstract. ODP Site 1078 situated under the coast of
gola provides the first record of the vegetation history for An-gola. The upper 11 m of the core covers the past 30 thousand years, which has been analysed palynologically in decadal to centennial resolution. Alkenone sea surface temperature es-timates were analysed in centennial resolution. We studied sea surface temperatures and vegetation development dur-ing full glacial, deglacial, and interglacial conditions. Dur-ing the glacial the vegetation in Angola was very open con-sisting of grass and heath lands, deserts and semi-deserts, which suggests a cool and dry climate. A change to warmer and more humid conditions is indicated by forest expansion starting in step with the earliest temperature rise in Antarc-tica, 22 thousand years ago. We infer that around the period of Heinrich Event 1, a northward excursion of the Angola Benguela Front and the Congo Air Boundary resulted in cool sea surface temperatures but rain forest remained present in the northern lowlands of Angola. Rain forest and dry forest area increase 15 thousand years ago. During the Holocene, dry forests and Miombo woodlands expanded. Also in An-gola globally recognised climate changes at 8 thousand and 4 thousand years ago had an impact on the vegetation. Dur-ing the past 2 thousand years, savannah vegetation became dominant.
1 Introduction
The climate of tropical Africa is strongly coupled to the po-sition of the Intertropical Convergence Zone (ITCZ) and its southern African branch, the Congo Air Boundary (CAB)
Correspondence to: L. Dupont ([email protected])
(Leroux, 1983; Tyson, 1986). Shifts in the latitudinal po-sition of the ITCZ have been associated with the climate variability in the Sahara and Sahel, but much less is known about the connections with the climate in southern Africa (e.g. Nicholson, 2000). Our knowledge mainly comes from studies on east African lakes, which focus on the climate of East Africa and the Rift Mountains (e.g. Vincens et al., 2005, 2007; Bonnefille and Chali´e, 2000; Johnson et al., 2004). They are, therefore, less suitable to monitor the effects of ITCZ and CAB variability on climate and vegetation of west southern Africa.
Recording and understanding climate change in southern Africa is important because it opens a window to study the variability of both tropical and subtropical climate systems of the Southern Hemisphere. How does the Atlantic mon-soon in Angola change from glacial to interglacial? Does it have Northern or Southern Hemisphere timing? How much is the precipitation in Angola influenced by East Atlantic sea surface temperatures? What is the impact of changes in the Atlantic meridional overturning circulation?
The latitudinal position of the CAB is connected with the amount of rainfall and the duration of the rainy season. The land-ocean temperature contrast is associated with arid-ity, wind strength and wind direction. Both directly affect the vegetation. Earlier studies have shown that vegetation changes in Angola are sensitively recorded by pollen and spores in marine sediments along the coast (Shi and Dupont, 1997; Dupont and Behling, 2006). The marine material al-lows us to compare the pollen record with the sea surface temperature (SST) record from the same core and thus en-abling us a direct land-sea correlation.
We studied a high resolution marine core (ODP Hole 1078C) spanning the past 30 ka encompassing the Last Glacial Maximum, Deglaciation including Heinrich Event 1
ABF ITCZ CAB BOC SECC AC BCC cyclonic gyre July ABF ITCZ CAB BOC SECC AC BCC cyclonic gyre January
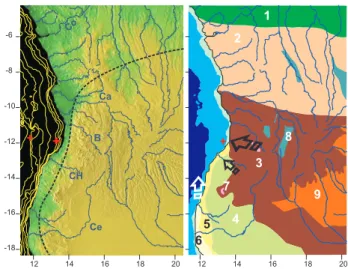
Fig. 1. Landcover of Africa (Bartholome et al., 2002), ocean surface currents of the eastern South Atlantic (Shannon and Nelsson, 1996), and
summer and winter position of important tropical frontal systems (Leroux, 1983). ITCZ, Intertropical Convergence Zone; CAB, Congo Air Boundary; ABF, Angola Benguela Front; SECC, South equatorial Counter Current; AC, Angola Current; BCC, Benguela Coastal Current; BOC, Benguela Ocean Current. Boundary of the state Angola in yellow. Boxes denote the detail shown in Fig. 2. Note that the extension of the tropical rain forest (light to dark green) is associated with humid conditions all year round occurring between the southernmost position of the ITCZ in January and the northernmost position of the CAB in July.
and the Younger Dryas period, and the Holocene. We aim to interpret fluctuations in the pollen assemblage in terms of vegetation change on the continent taking into account ef-fects of transport of pollen by wind and rivers. The thus reconstructed vegetation variability is compared to other African environmental records. We aim at a conceptual model of shifts in the latitudinal position of atmospheric and marine fronts explaining environmental changes in Angola that might be tested with numerical models.
2 Regional climate and ocean circulation and its impact on the modern vegetation of west southern Africa
Present-day climate in Angola ranges from the permanently wet climate of the Congo basin in the north to the dry sum-mer rain climates in the south. The Atlantic or west African monsoon controls the climate of the northernmost part dur-ing most of the year, while the middle and southern parts receive (Atlantic) moisture only during austral summer. An-gola is the southernmost region where the West African mon-soon brings rain (Fig. 1). The boundary is in the form of a low pressure area, the CAB (formerly Zaire Air Boundary), that annually migrates over Angola from its southern sur-face position around 20–15◦S in January (austral summer) to its northern position around 9–6◦S in July (austral win-ter) (Leroux, 1983). The CAB is part of the discontinuities that divide easterly trades and westerly monsoonal wind sys-tems over Africa and can be regarded as a southern branch of the ITCZ. The latitudinal position and annual migration
of these systems determines the timing and duration of the rainfall seasons. They are associated with the global ther-mal gradient and the strength and position of the Hadley Cell (Nicholson, 2000). However, sea surface temperatures and ocean circulation also have an impact on the position of the ITCZ.
The surface and shallow subsurface ocean circulation in the eastern Angola Basin is dominated by the South Atlantic cyclonic gyre consisting of the Benguela Ocean Current flowing northwards and westwards over the Walvis Ridge, the South Equatorial Counter Current flowing eastwards, and the Angola Current flowing southwards along the coast (Fig. 1). In the marine realm, as in the terrestrial one, an important frontal system exists off the coast of Angola in the form of the Angola Benguela Front (ABF) annually mi-grating between 17 and 14◦S. South of the ABF, the surface Benguela Coastal Current being a tongue of the Benguela Ocean Current flows northwards along the coast. North of the ABF, the Angola Current flows southwards and the Benguela Coastal Current can be traced as a shallow subsur-face current up to 5◦S (Peterson and Stramma, 1991; Schnei-der et al., 1995, 1997).
The ABF is recognizable by a sea surface temperature (SST) gradient of 4◦C per 1◦ of latitude and identifiable to a depth of at least 200 m. The front is most intense within 250 km from the coast. The position and the strength of the front are maintained through a combination of factors includ-ing coastal orientation, wind stress, and opposinclud-ing flows of the equatorward Benguela Coastal Current and the poleward An-gola Current (Shannon and Nelson, 1996). Within the limits
of the coastal orientation, there is a coupling between the po-sition of the ABF and the CAB on land. South of the front the zonal component of the wind stress over the ocean is east (SE trades) and north of the front the zonal component is west (SW monsoon). Strong SE trade winds will trigger both a cooling south of the ABF by increasing the upwelling along the coast and a warming north of the ABF due to stronger intrusion of warm equatorial waters by the Angola Current (Kim et al., 2003). Intense coastal upwelling occurs only south of the ABF, whereas directly north of it upwelling is seasonal and relatively weak (Wefer et al., 1998).
The position of the climatic and oceanic frontal systems is reflected in the vegetation of southern Africa. The southern boundary of the Congolian rain forest corresponds to the lat-itudinal July (austral winter) position of the CAB. The Zam-bezian phytogeographical region is extended in Angola con-sisting of different types of dry forest, woodland, savannah and edaphic grassland (Fig. 2: White, 1983). In the north of Angola the transition between the Zambezian and the Con-golian vegetation zones nowadays is mainly occupied by sec-ondary grassland and savannahs. However, surviving cloud forests of Congolian affinity exist occurring at altitudes be-tween 350 and 1000 m. Along the west coast, climate and vegetation are strongly influenced by the SST. Especially, the low SSTs of the upwelling area south of the ABF suppress coastal rain fall (Nicholson and Entekabi, 1987). As a result, the vegetation along the Angolan coast south of 15◦S has affinities with the Namib Desert (desert of the Moc¸amedes) and south of 11◦S with the Karoo-Namib shrubland (White,
1983).
The vegetation of Angola forms the transition between the tropical lowland rain forest of the Congo and the dry savan-nahs and deserts of the Kalahari and Namibia (Fig. 2). Its development is sensitive to climate change and shifts of the frontal systems described above. In this paper, we present a detailed pollen record of marine sediments of ODP Hole 1078C, which allows the study of the vegetation history of the past 30 ka during full glacial, deglacial, and interglacial conditions.
3 Material and methods
The material used is sediment from the upper 11 m ODP Site 1078 Hole C. The site is located outside the Bight of An-gola at 11◦55′S, 13◦24′E in 426 m deep water. The sedi-ments are composed predominantly of a moderately biotur-bated olive-gray silty clay with varying amounts of nanno-fossils and foraminifers (Wefer et al., 1998).
The age model is established after radiocarbon AMS mea-surements on foraminifer tests and molluscs carried out at the Leibniz-Laboratory, University of Kiel, Germany (Kim et al., 2003; R¨uhlemann et al., 2004). Extension of the age model uses eight dates (Table 1: S. Mulitza, personal com-munication, 2007) calibrated after Fairbanks et al. (2005)
us-12 14 16 18 20 -18 -16 -14 -12 -10 -8 -6 12 14 16 18 20 1 2 3 7 4 5 6 8 9 Co Ca B CH Ce
Fig. 2. Left, topography, bathemetry, and major rivers of the study
area. Topography after GLOBE http://www.ngdc.noaa.gov/mgg/ topo/globe.html (Hastings and Dunbar, 1998). Bathymetric con-tours of 100, 200, 500, 1500, 2000, 2500, 3000, and 3500 m are shown. Red crosses give the locations from left to right of GeoB 1016 and ODP Sites 1079/1078, respectively. Major rivers in blue, Congo River (Co), Cuanza River (Ca), Balombo River (B), Cuhal da Hanha (CH), and Cunene River (Ce). The Balombo River probably is the more important provider of terrestrial input to the coring site, because marine surface currents flow southwards along the Angolan coast. Dashed line denotes the average July (austral winter) position of the Congo Air Boundary (Leroux, 1983). Right, major rivers, predominant offshore wind directions, and simplified phytogeogra-phy after White (1983). 1 (dark green), Congolian rain forest; 2 (light brown), transition between Congolian forest and Zambezian savannah and forest; 3 (dark brown), Zambezian dry forest and sa-vannah; 4 (light green), Mopane sasa-vannah; 5 (yellow), Nama Karoo semi-desert; 6 (white), Namib desert; 7 (pink), Afromontane forest; 8 (blue green), edaphic grassland; 9 (orange), Damdo woodland. Black arrows show the predominant wind direction to the study site during fall and winter; white arrow shows the predominant wind di-rection during spring (simplified after Dupont and Wyputta, 2003). During summer and partly during spring, wind is blowing mostly from the ocean and does not bring pollen. Water depths between 0–130 m, 130–2000 m, and 2000–4000 m are distinguished by dif-ferent shades of blue. Red cross denotes the position of ODP Site 1078.
ing a marine reservoir effect of 400 years (1R=0). All ages are expressed in 1000 years calibrated BP abbreviated as ka. Dates at 10.71 and 10.21 m below sea floor (mbsf) have been discarded, because the shell fragments might have been dis-placed to lower levels by burrowing.
Preparation of palynological samples follows standard procedures. In brief, 3–4 cm3 sediment was decalcified with diluted HCL (ca. 1%) and treated with HF (ca. 40%) for several days to remove silicates. Samples were sieved over an 8 µm mesh using ultrasonic sieving removing parti-cles smaller than 10–12 µm. Pollen samples were mounted in glycerine jelly, microscopically examined by H. Behling
Table 1. AMS radiocarbon dates of ODP Site 1078C below 9.80 mbsf (S. Mulitza, personal communication 2007). Calibration using R=400
after Fairbanks et al. (2005).
Lab. No Core/Section Interval (cm) Depth (mbsf) Material 14C age (a) Error Calibrated age range (a)
KIA13030 2H-3 20–22 9.91 fract. mollusk 21 340 +220/−210 24 799–25 415
KIA13008 2H-3 30–32 10.01 fract. mollusk 22 780 +260/−250 26 586–27 146
KIA13028* 2H-3 50–52 10.21 fract. mollusk 16 960 +/−130 19 522–19 838
KIA13027* 2H-3 100–102 10.71 fract. mollusk 22 850 +260/−250 26 661–27 220
KIA13023 2H-4 70–72 11.91 fract. mollusk 30 250 +630/−590 34 282–35 567
KIA13038 2H-5 60–62 13.31 fract. mollusk 33 880 +1010/−890 37 357–39 780
KIA13007 2H-5 130–132 14.01 Nacariua wolfi (snail) 36 780 +1560/−1300 40 444–42 791
KIA13006 2H-CC 17–19 16.48 planktic forams 44 850 +5190/−3130 >45 000
* dates not used in the age model
and L. M. Dupont. Pollen grains were identified using several publications (Ybert, 1979; Bonnefille and Riol-let, 1980; K¨ohler and Br¨uckner, 1982; Sowunmi, 1973, 1995), the African Pollen Database http://medias.obs-mip.fr/ pollen/, and a reference collection. Samples are counted rou-tinely up to 300 pollen grains (without fern spores). How-ever, some samples turned out to be too poor to reach that goal: five samples have a sum of total pollen between 150 and 200 (at 3.8, 20.6, 22.0, 30.0, and 31.7 ka), two samples between 100 and 150 (at 4.0 and 19.9 ka). These samples neither show exceptionally low diversity nor domination of a single taxon. Charcoal particles have been counted from the pollen slides. Percentages are expressed on the total number of pollen and fern spores, which is denoted in Fig. 5.
Detailed information on analytical techniques used for the determination of long-chain alkenones can be found in the study by Kim et al. (2002). We calculated the alkenone un-saturation index from U37K′=[C37:2]/([C37:2]+[C37:3]), where C37:2 and C37:3 represent the di- and triunsaturated C37 alkenones, respectively (Prahl and Wakeham, 1987). The U37K′ values were converted into temperature values apply-ing the culture calibration U37K′=0.034 ∗ T +0.039 by Prahl et al. (1988), which has also been validated by core-top com-pilations (M¨uller et al., 1998). The precision of the mea-surements (±1σ ) was better than 0.003 U37K′units (or 0.1◦C), based on replicate extractions on different days of two lab-oratory internal reference sediments (CC 2107-3 and CC 1706-2) from the South Atlantic.
4 Age model and sedimentation rates
The age depth model is shown in Fig. 3. The upper 9.80 m (0–22 ka) has been dated by Kim et al. (2003) and R¨uhlemann et al. (2004). This age model uses the calibra-tion of Calib and the marine calibracalibra-tion curve (Stuiver and Reimer, 1993; Hughen et al., 2004). The lower dates
(Ta-ble 2: S. Mulitza, personal communication, 2007) are out-side the range of the marine calibration curve and have been calibrated using Fairbanks et al. (2005). Except for the low-ermost date, the material consisted out of mollusc shell frag-ments. Some radiocarbon ages seem to occur at different levels, which can be explained by burrowing down of the molluscs. We therefore consequently chose the upper ones to include in the age model. Calibration ranges increase with age and the uncertainty of the calibration.
For the calibration of the radiocarbon dates, we have ap-plied a reservoir effect of 400 years as suggested by the present day marine reservoir correction database (Butzin et al., 2005). Although there are no direct measurements in the vicinity of ODP Site 1078, we think this is justifiable because the site is just outside the coastal upwelling range and the in-fluence of the open ocean is more pronounced than at sites north or south of it (Wefer et al., 1998). Simulations for the glacial ocean indicate an increase in the surface reservoir age to maximal 600 years (Butzin et al., 2005). An extra shift of 200 years in the glacial dates would not significantly change our age model.
The sedimentation rates for ODP Site 1078 that result from linear interpolation between the calibrated radiocarbon ages are also given in Fig. 3. Until 27 ka sedimentation rates range between 22 and 35 cm/ka, but are rather imprecise. Between 10–9.8 mbsf (27–22 ka) sedimentation rates drop to low val-ues of about 4 cm/ka. This estimate is supported by three ages, if we reject the datum’s at lower levels (see above). Moreover, a concentration of shells and molluscs have been found at those levels both in Hole C, used in this study, and in the neighbouring Hole B (Wefer et al., 1998). The very low sedimentation might have occurred during the last glacial lowest sea-level period. This seems to be much too early, but a recent publication provided evidence that the period of low-est sea-level must have occurred between 26 and 21 ka ago (Peltier and Fairbanks, 2006).
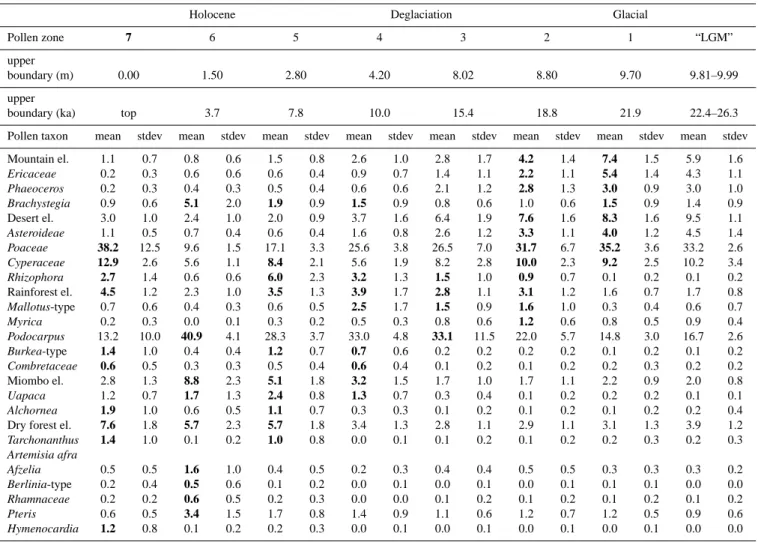
Table 2. Percentage mean and standard deviation per zone for selected pollen taxa and groups (listed in the appendix) and ordered after the
earliest maximum occurrence. “LGM” period of lowest sea level at the site (see Sect. 4); el. = elements.
Holocene Deglaciation Glacial
Pollen zone 7 6 5 4 3 2 1 “LGM”
upper
boundary (m) 0.00 1.50 2.80 4.20 8.02 8.80 9.70 9.81–9.99
upper
boundary (ka) top 3.7 7.8 10.0 15.4 18.8 21.9 22.4–26.3
Pollen taxon mean stdev mean stdev mean stdev mean stdev mean stdev mean stdev mean stdev mean stdev
Mountain el. 1.1 0.7 0.8 0.6 1.5 0.8 2.6 1.0 2.8 1.7 4.2 1.4 7.4 1.5 5.9 1.6 Ericaceae 0.2 0.3 0.6 0.6 0.6 0.4 0.9 0.7 1.4 1.1 2.2 1.1 5.4 1.4 4.3 1.1 Phaeoceros 0.2 0.3 0.4 0.3 0.5 0.4 0.6 0.6 2.1 1.2 2.8 1.3 3.0 0.9 3.0 1.0 Brachystegia 0.9 0.6 5.1 2.0 1.9 0.9 1.5 0.9 0.8 0.6 1.0 0.6 1.5 0.9 1.4 0.9 Desert el. 3.0 1.0 2.4 1.0 2.0 0.9 3.7 1.6 6.4 1.9 7.6 1.6 8.3 1.6 9.5 1.1 Asteroideae 1.1 0.5 0.7 0.4 0.6 0.4 1.6 0.8 2.6 1.2 3.3 1.1 4.0 1.2 4.5 1.4 Poaceae 38.2 12.5 9.6 1.5 17.1 3.3 25.6 3.8 26.5 7.0 31.7 6.7 35.2 3.6 33.2 2.6 Cyperaceae 12.9 2.6 5.6 1.1 8.4 2.1 5.6 1.9 8.2 2.8 10.0 2.3 9.2 2.5 10.2 3.4 Rhizophora 2.7 1.4 0.6 0.6 6.0 2.3 3.2 1.3 1.5 1.0 0.9 0.7 0.1 0.2 0.1 0.2 Rainforest el. 4.5 1.2 2.3 1.0 3.5 1.3 3.9 1.7 2.8 1.1 3.1 1.2 1.6 0.7 1.7 0.8 Mallotus-type 0.7 0.6 0.4 0.3 0.6 0.5 2.5 1.7 1.5 0.9 1.6 1.0 0.3 0.4 0.6 0.7 Myrica 0.2 0.3 0.0 0.1 0.3 0.2 0.5 0.3 0.8 0.6 1.2 0.6 0.8 0.5 0.9 0.4 Podocarpus 13.2 10.0 40.9 4.1 28.3 3.7 33.0 4.8 33.1 11.5 22.0 5.7 14.8 3.0 16.7 2.6 Burkea-type 1.4 1.0 0.4 0.4 1.2 0.7 0.7 0.6 0.2 0.2 0.2 0.2 0.1 0.2 0.1 0.2 Combretaceae 0.6 0.5 0.3 0.3 0.5 0.4 0.6 0.4 0.1 0.2 0.1 0.2 0.2 0.3 0.2 0.2 Miombo el. 2.8 1.3 8.8 2.3 5.1 1.8 3.2 1.5 1.7 1.0 1.7 1.1 2.2 0.9 2.0 0.8 Uapaca 1.2 0.7 1.7 1.3 2.4 0.8 1.3 0.7 0.3 0.4 0.1 0.2 0.2 0.2 0.1 0.1 Alchornea 1.9 1.0 0.6 0.5 1.1 0.7 0.3 0.3 0.1 0.2 0.1 0.2 0.1 0.2 0.2 0.4
Dry forest el. 7.6 1.8 5.7 2.3 5.7 1.8 3.4 1.3 2.8 1.1 2.9 1.1 3.1 1.3 3.9 1.2
Tarchonanthus 1.4 1.0 0.1 0.2 1.0 0.8 0.0 0.1 0.1 0.2 0.1 0.2 0.2 0.3 0.2 0.3 Artemisia afra Afzelia 0.5 0.5 1.6 1.0 0.4 0.5 0.2 0.3 0.4 0.4 0.5 0.5 0.3 0.3 0.3 0.2 Berlinia-type 0.2 0.4 0.5 0.6 0.1 0.2 0.0 0.1 0.0 0.1 0.0 0.1 0.1 0.1 0.0 0.0 Rhamnaceae 0.2 0.2 0.6 0.5 0.2 0.3 0.0 0.0 0.1 0.2 0.1 0.2 0.1 0.2 0.1 0.2 Pteris 0.6 0.5 3.4 1.5 1.7 0.8 1.4 0.9 1.1 0.6 1.2 0.7 1.2 0.5 0.9 0.6 Hymenocardia 1.2 0.8 0.1 0.2 0.2 0.3 0.0 0.1 0.0 0.1 0.0 0.1 0.0 0.1 0.0 0.0
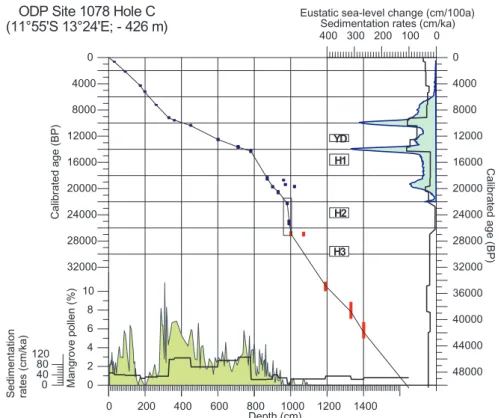
After 22 ka sedimentation rates increase again to levels between 20 and 40 cm/ka and jump to levels around 1 m/ka shortly before 14 ka. We associate the strong increase in sed-imentation rates with the rapid sea-level rise during Meltwa-ter Pulse 1a dated between 14.6–14.3 ka (Fairbanks, 1989; Hanebuth et al., 2000). The levels of high sedimentation rates between 8 and 3 mbsf (14–9 ka) shows raised Rhizophora pollen percentages. This increased relative abundance of mangrove pollen comes together with increased amounts of other mangrove materials and is interpreted as sedimentation of eroded mangrove peat (Kim et al., 2005). Sedimentation levels remain high until 9 ka, when they drop again to levels between 25 and 40 cm/ka.
Thus the history of sea-level change at ODP Site 1078 as reconstructed with our age model fits well into the global picture, which makes us more confident about the age model itself.
5 Results
Alkenone-derived SSTs showed a typical glacial-interglacial warming trend, ranging from 21◦to 24◦C over the last 30 ka (Fig. 4). During the glacial period, alkenone-derived SSTs varied between 21◦ and 23◦C and decreased to the lowest
value of 20.9◦C at 16.3 cal ka during Heinrich Event 1.
Afterwards, alkenone-derived SSTs increased towards the Holocene, showing a warm period during the Younger Dryas. During the Holocene, alkenone-derived SSTs continued to increase to a core-top value of 24.9◦C with a slight cooling around 5 cal ka.
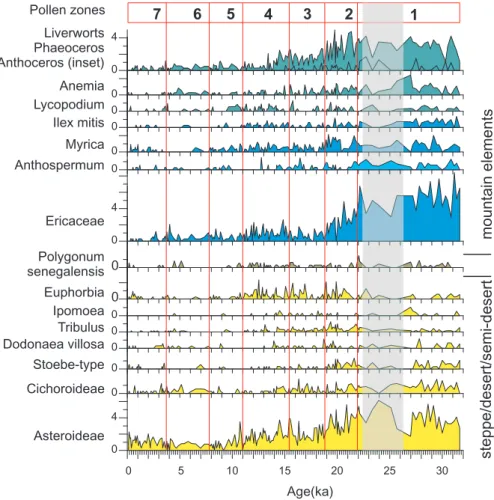
Based on the relative abundance of the most conclusive pollen taxa, seven pollen zones (PZ) have been distinguished. In this section, each zone is briefly characterised. Aver-age percentAver-age values per pollen zone are given for selected pollen taxa in Table 2. Percentages of groups and selected pollen taxa are given in Figs. 5–7. Appendix A lists the pollen taxa within each group.
0 200 400 600 800 1000 1200 1400 Depth (cm) 32000 28000 24000 20000 16000 12000 8000 4000 0 C a lib ra te d a g e (BP) 400 300 200 100 0 Eustatic sea-level change (cm/100a)
Sedimentation rates (cm/ka)
48000 44000 40000 36000 32000 28000 24000 20000 16000 12000 8000 4000 0 C a lib ra te d a g e (B P) 0 2 4 6 8 10 Ma n g ro ve p o lle n (% ) 0 40 80 120 Se d ime n ta ti o n ra te s (cm/ k a )
ODP Site 1078 Hole C (11°55'S 13°24'E; - 426 m)
YD
H1
H2
H3
Fig. 3. Age model for ODP Hole 1078C (Kim et al., 2003; R¨uhlemann et al., 2004; Mulitza, personal communication, 2007). Denoted in
blue are the age ranges calibrated with Calib using the marine04 calibration set (Hughen et al., 2004). Denoted in red are the age ranges calibrated after Fairbanks et al. (2005). Bottom shaded curve and left axis, pollen percent of Rhizophora (mangrove tree); bottom line and far left axis, sedimentation rates against depth; right shaded curve and upper axis, eustatic sea-level change after Fleming et al. (1998); right line and upper axis, sedimentation rates against age. YD, Younger Dryas; H1, H2, H3, Heinrich Events 1, 2, 3, respectively.
PZ 1: 25 samples between 11.16 (lowermost sample anal-ysed) and 9.70 m, dated between 31.7–21.9 ka. The record is poor between 9.99 and 9.81 m (26.3–22.4 ka), but not systematically different from the rest of the zone (see Ta-ble 2). Radiocarbon dates indicate very low sedimentation rates (∼4 cm/ka) for this part of the zone. Maximum per-centages of the mountain elements including pollen of Eri-caceae, Myrica and Ilex cf. mitis, as well as spores of the fern Anemia and liverworts (Phaeoceros, Anthoceros) are found. High pollen percentages of Asteroideae, Stoebe-type, Poaceae, and other desert elements, e.g. Tribulus occur as well as raised percentages of Brachystegia.
PZ 2: 19 samples between 9.70–8.80 m, dated between 21.9–18.8 ka. Gradual increase in the pollen concentration (Fig. 4) and a decline in percentages of desert and mountain elements are found. Myrica percentages are still relatively high. First rise in Rhizophora pollen percentages. Increase in percentages of Podocarpus and rain forest elements in-cluding Mallotus-type.
PZ 3: 23 samples between 8.80–8.02 m, dated between 18.8–15.4 ka. Maximum Podocarpus percentages occur par-allel to a minimum in sea surface temperatures as inferred from alkenones (Fig. 4: Kim et al., 2003). Of the rain forest
elements only percentages of Mallotus-type and Tetrorchid-ium are raised. Rhizophora percentages also increase.
PZ 4: 43 samples between 8.02–4.20 m, dated between 15.4–10.0 ka. Pollen accumulation rates are dominated by the sedimentation rates (Fig. 4). Increase of pollen percent-ages of Uapaca and Brachystegia and the sum of Miombo elements. Rain forest percentages are relatively high and so are the values for a number of constituents: Tetrorchidium, Lophira, Celtis, and Alchornea. Rhizophora percentages also rise (Fig. 3), parallel to the global eustatic sea-level curve (Fleming et al., 1998).
PZ 5: 15 samples between 4.20–2.80 m, dated between 10.0–7.8 ka. Percentages of Olea decrease, those of Miombo elements including Brachystegia and Uapaca are high, centages of dry forest with Burkea-type increase, and per-centages of rain forest elements decline with the exception of Alchornea. High percentages of Tarchonanthus/Artemisia afra also occur. Rhizophora and Cyperaceae percentages are maximal between 9–8 ka. Protea pollen occur shortly be-fore 8 ka, when also Poaceae and Cyperaceae percentages are enhanced. Pollen concentrations are high and exceed on average 104grains per ml.
0 10 20 30 100 1000 10000 0 0.5 1 0 4 8 12 16 20 24 28 32 20 21 22 23 24 25 1000 10000 0 2 1 3 7 6 5 4 3 2 1 Age (ka) AR (cn ts/ cm²/ ka ) Po lle n (/ ml ) SST (° C ) Se d ime n ta ti o n ra te s (m/ ka ) Ra te se a le ve l ch a n g e (cm/ a ) Pollen zones
ODP Site 1078 Hole C,11°55’ S 13°24’ E, -426m
100
Fig. 4. From top to bottom. Pollen zones. Alkenone based sea surface temperatures (red line, upper right axis). Accumulation rates of total
pollen per cm2and ka (green line, upper left axis). Total pollen concentration (green line) and Podocarpus pollen concentration (blue line) per ml sediment (middle right axis). Sedimentation rates in m per ka (shaded, lower left axis) and rates of sea-level change (line, lower right axis) after Fleming et al. (1998).
PZ 6: 17 samples between 2.80–1.50 m, dated between 7.8–3.7 ka. Maximum percentages are found for Podocar-pus, Miombo elements including Brachystegia, Afzelia, Berlinia-type, and Uapaca. Furthermore percentages of Rhamnaceae pollen (small pollen grains probably from Zizi-phus) and Pteris spores are raised. From the dry forest ele-ments Adansonia digitata and Lannea-type have higher val-ues. Minimal Poaceae and Rhizophora percentages occur and Cyperaceae percentages are low. Pollen influx (accu-mulation rates) of Podocarpus and Miombo elements stay at the same level, but decline for Poaceae, Cyperaceae, Rhi-zophora, dry forest and rain forest elements.
PZ 7: 34 samples between 1.50–0 m, dated between 3.7 ka and modern. Maximum percentages of Poaceae and Cyper-aceae occur. PoCyper-aceae percentages reach their absolute max-imum after 2 ka. Percentages are raised again for Rhi-zophora and rain forest elements, in particular Alchornea and Elaeis guineensis. Also dry forest elements are better rep-resented including Hymenocardia, Tarchonanthus/Artemisia afra, Protea, Burkea-type, and Combretaceae.
6 Vegetation development in Angola in relation to cli-mate change
ODP Site 1078 located on the lower shelf only 50 km from the shore is in an ideal position to collect pollen from the mainland. Directly east of the sampling site, the land rises steeply to elevations exceeding 1000 m; highest peaks in the Huambe Mountains are just over 2000 m. Fluvial transport of pollen is important, because the site is situated on the shelf in the vicinity of several rivers of which the Balombo River is the most important draining all ranges of the mountains. Because of the marine surface currents flowing southwards along the Angolan coast, discharge by the Balombo River and other smaller rivers nearby is more likely to contribute material than that of rivers such as the Cuhal do Hanha hav-ing their estuaries south of ODP Site 1078. The river col-lects pollen from a wide range of vegetation types passing at present through Afromontane vegetation, wetter Zambezian Miombo woodland and bushy Karoo-Namib shrubland along the coast (White, 1983). Almost 2◦ north of the site, the
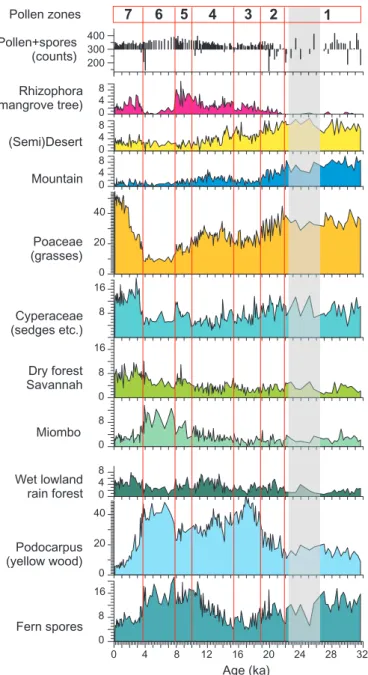
0 8 16 Miombo 0 8 16 0 20 40 0 4 8 0 8 8 16 0 20 40 0 4 8 0 4 8 0 4 8 12 16 20 24 28 32 Rhizophora (mangrove tree) (Semi)Desert Mountain Poaceae (grasses) Cyperaceae (sedges etc.) Dry forest Savannah Wet lowland rain forest Podocarpus (yellow wood) Fern spores 0 4 8 Age (ka) 6 5 4 3 2 1 7 Pollen zones 200 300 400 Pollen+spores (counts)
Fig. 5. Percentages of pollen taxa and groups (listed in appendix). Counts of total pollen and fern spores being the basis of the percent
calculation are given on top. Shaded area indicates samples with low sedimentation rates and poor content.
southernmost mangrove swamps on the Atlantic coast of Africa are situated along the Longa River (Spalding et al., 1997). Southwest of ODP Site 1078, Moc¸amedes bushland and desert stretches along the coast of southern Angola and Namibia. Further inland in Angola, Mopane scrub wood-lands occur. Aeolian transport of pollen to ODP Site 1078 is mainly expected during austral fall and winter when the lower troposphere flow is from the SE (Dupont and Wyputta, 2003). Source areas for fluvial and aeolian pollen largely overlap. An extensive discussion of pollen transport to and pollen distribution in marine sediments along the southwest African coast is given in Rommerskirchen et al. (2003), Dupont and Wyputta (2003), and Dupont et al. (2007).
6.1 Glacial
The lowermost part of the record, PZ1, covers the glacial between 31.7 and 21.9 ka. As discussed above, it includes the Last Glacial Maximum (defined as the period of low-est global sea-level). From the high pollen percentages of mountainous elements, including Ericaceae, Myrica and Ilex accompanied with high relative abundances of pollen of Poaceae and Asteraceae, we infer that open mountain-ous vegetation with heather species (Ericaceae), compos-ites (Asteraceae), and grasses (Poaceae) was wide-spread (Fig. 6). Ericaceae and Ilex mitis are typical elements from the Afromontane vegetation (White, 1983). Palgrave
0 5 10 15 20 25 30 0 4 0 0 0 0 0 0 0 0 4 0 0 0 0 0 4 Age(ka) 6 5 4 3 2 1 7 Liverworts Phaeoceros Anthoceros (inset) Anemia Lycopodium Ilex mitis Myrica Ericaceae Euphorbia Polygonum senegalensis Ipomoea Tribulus Dodonaea villosa 0 Anthospermum Stoebe-type Cichoro deaei Asteroideae Pollen zones st e p p e /d e se rt /se mi -d e se rt mo u n ta in e le me n ts
Fig. 6. Percentages of selected pollen taxa from desert, semi-desert, or open mountainous vegetation (pollen sums are given in Fig. 5).
Shaded area denotes samples with low sedimentation rates and poor content.
(2002) mentions several Myrica species from mountain ar-eas. Also Anthospermum species have been associated with ericaceous mountain vegetation (Scott, 1982). No pollen of Restionaceae has been found. We, therefore, do not expect to have Ericaceae pollen originating from southern source ar-eas other than the regional mountains (Dupont and Behling, 2006).
Apart from the Afromontane vegetation, the existence of dry woodlands, probably at lower altitudes is suggested by the occurrence of pollen of Brachystegia and spores of Ane-mia. The Flora Zambesiaca (Schelpe, 1970) describes the present habitat of Anemia angolensis in the undergrowth of dry woodland at altitudes between 600–1525 m. Pollen from composites and grasses probably had their sources not only from Afromontane vegetation but from desert and semi-desert vegetation along the coast, as well. Extension of semi-desert and semi-desert is also indicated by the regular occurrence of Tribulus and Stoebe-type pollen. Is this extension a result of a northward shift of the Angola Benguela Front (ABF) and in-creased upwelling along the coast? Alkenone measurements indicate SSTs (Fig. 4) were around 22◦C (Kim et al., 2003) 2 to 3 degrees lower than today. Increased upwelling,
how-ever, should have lowered the SST below the general cooling of the glacial ocean, which is estimated at 4–5◦C for the east equatorial Atlantic (Niebler et al., 2003). Comparison of sev-eral SST profiles with a coarser timely resolution between 5◦ and 20◦S did not indicate a shift of the ABF north of 12◦S during the glacial (Schneider et al., 1995). Thus, there is little indication of upwelling of cooler intermediate waters.
The open mountainous vegetation and the expansion of desert and semi-desert suggest a cooler and drier climate in Angola during the glacial. Our data corroborate terres-trial mountain records, especially in east Africa, of an open glacial landscape covered with a grass- and ericaceous-rich vegetation, e.g. Sacred Lake at 0◦S 37◦E (Coetzee, 1967), and Kashiru at 3◦S 30◦E (Bonnefille and Riollet, 1988; Bon-nefille and Chali´e, 2000). However, in Congo at Ngamalaka Pond (4◦S 15◦E) located at lower altitudes and nearer to the equator, no mountain elements were found (Elenga et al., 1994). Forest growth in the mountains might have been impeded by low temperatures at higher altitudes, dry condi-tions, and/or due to low glacial atmospheric carbon dioxide levels (Jolly and Haxeltine, 1997).
0 5 10 15 20 25 30 0 4 0 0 0 0 4 0 0 2 0 0 2 0 0 2 0 0 0 0 0 0 0 2 0 2 0 4 8 0 0 4 Pteris Berlinia-type Brachystegia Afzelia Uapaca Rhamnaceae Buxus-type madagascarica Combretaceae Adansonia digitata Lannea-type Cassia-type Burkea-type Pterocarpus-type Tarchonanthus/Artemisia afra Protea Hymenocardia Elaeis guineenseis Alchornea Celtis Lophira 0 Spermacoce Tetrorchidium Mallotus-type Age (ka)
6
5
4
3
2
1
7
Pollen zones 0 Olea 0 10 20 30 Charcoal particlesw
e
t
lo
w
la
n
d
f
o
re
st
d
ry
fo
re
s
t
a
n
d
sa
va
n
n
a
h
Mi
o
mb
o
w
o
o
d
la
n
d
Fig. 7. Percentages of selected pollen taxa from rain forest, dry forest and woodland, and Miombo woodland (pollen sums are given in
Fig. 5). Charcoal percentages are also expressed on the total of pollen and spores. Shaded area denotes samples with low sedimentation rates and poor content.
Between 21.9 and 18.8 ka, PZ2, the vegetation in An-gola gradually changes. The relative abundance of pollen from open vegetation types (Afromontane and desert) de-clines, and tree pollen percentages of Podocarpus (Fig. 5) and Mallotus-type (Fig. 7) rise. Probably, Podocarpus trees were spreading in the mountains, while rainforest started to expand in the northern lowlands with pioneer trees such as Mallotus (Maley and Brenac, 1998). Other Afromontane trees such as Ilex mitis and Myrica are still present (Fig. 6). The gradual increase in pollen concentration (see Fig. 3)
sug-gests higher terrestrial – probably fluvial – input. Change to warmer and more humid conditions after the glacial thus starts much earlier in Angola than in West Africa north of the equator as indicated by the Niger and Sanaga River discharge increasing not before 14–15 ka (Adegbie et al., 2003; Lezine and Cazet, 2005; Weldeab et al., 2007).
South of the equator, at the Bateke Plataeu in Congo around Ngamalake Pond (4◦S), humid forest elements in-vade an open landscape as early as 24 ka (Elenga et al., 2004). Around 22 ka, contemporaneously with the Angolan
12 14 16 18 20 -18 -16 -14 -12 -10 -8 -6
July austral winter ( ) position of CAB
-30° 0° 30° 0° 30° ka 10 -5 1 January
of ITCZ (and CAB) (austral summer) position
22-19k
a
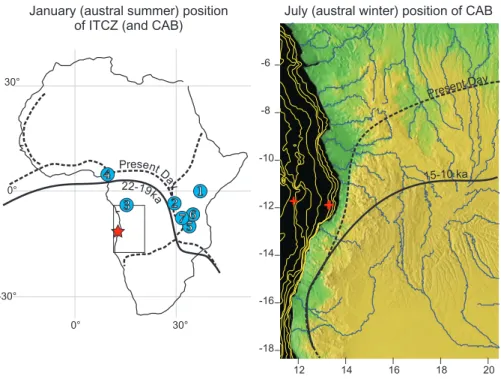
Fig. 8. Conceptual model of shifted average latitudinal positions of the Congo Air Boundary (CAB) and Intertropical Convergence Zone
(ITCZ) during Deglaciation. Left, ITCZ January position for 22–19 ka (line). Dashed line denotes the present-day average January position of the ITCZ system (Leroux 1983). Star shows the position of ODP Site 1078 and numbers the locations of published sites mentioned in the discusion. 1, Sacred Lake (Coetzee 1967); 2, Kashiru (Bonnefille and Riollet, 1988; Bonnefille and Chali´e, 2000); 3, Ngamalaka Pond (Elenga et al., 1994); 4, Barombi Mbo (Maley and Brenac, 1998); 5, Lake Malawi (Johnson et al. 2004); 6, Lake Masoko (Vincens et al. 2007); 7, Lake Rukwa (Vincens et al., 2005). Box denotes the area shown in detail. Right, CAB July position for 15–10 ka (line) projected on the GLOBE topography (see Fig. 2). Dashed line shows the present-day average July position of the CAB (Leroux, 1983). Crosses denote the locations from left to right of core GeoB 1016 and ODP Sites 1079/1078, respectively.
sequence, the lake level of Lake Malawi (10◦S 34◦E) rises after the glacial lowstand indicating increased precipitation in the East African mountains (Johnson et al., 2004). Further-more, semi-deciduous forest elements became established around Lake Masoko (9◦S 34◦E) just north of Lake Malawi suggesting the dry season became as short as 3 to 4 months (Vincens et al., 2007). Glacial woodland and bushland with Afromontane elements around Lake Rukwa (8◦S 33◦E) in
Tanzania, however, indicate that the climate was still rather cool and dry (Vincens et al., 2005).
Expansion of rain forest in the northern lowlands of An-gola also suggests increased precipitation, which is possible if the winter migration of the CAB migrated less northwards than in the period before. Then the CAB position would re-main sufficiently to the south to allow Atlantic rain pene-trating during most of the year in the northern lowlands of Angola. The spread of forest between 22 and 19 ka is too early to be an effect of rising carbon dioxide levels, because the CO2rise after the glacial is dated by Monnin et al. (2001) between 17 and 15.4 ka. Moreover, the pollen diagram from Lake Barombi (4◦N 9◦E) in Cameroon indicates an open-ing of the forest and increase of grasslands from ca. 24 ka on (2014C ka, Maley and Brenac, 1998). The development
north and south of the equator proceeding in opposite direc-tions would fit with a southern average position of the ITCZ coupled to a southern position of the CAB (Fig. 8). Our in-terpretation fits the study of Johnson et al. (2004) inferring a southern average position of the ITCZ between 23 and 19 ka based on the increased productivity in Lake Malawi coupled to northerly winds over the lake.
6.2 Deglaciation
The pollen diagram for the period between 18.8 and 15.4 ka, PZ3, covering Heinrich Event 1, is dominated by Podocarpus (Fig. 5). Podocarpus trees produce much aerodynamically well-equipped pollen and are, therefore, overrepresented in the pollen record, especially when wind transport is impor-tant. Still, there are few other elements represented save for Mallotus and Tetrorchidium from the rain forest (Fig. 7). Thus, although rain forest remained present in the northern lowlands, Podocarpus forest might have been locally abun-dant in the mountains. Unfortunately, the marine record of Podocarpus for this period is not consistent, because a comparable Podocarpus pollen maximum is missing in the nearby core of GeoB1016 (location given in Fig. 2 left; Shi
and Dupont, 1997), but present in core GIK16867 (3◦S 5◦E)
further north along the trajectory of the trade winds (Dupont et al. 1996). The terrestrial pollen records in Cameroon and Congo indicate a mixture of semi-deciduous forests and grasslands but neither an open savannah nor a Podocarpus forest (Elenga et al., 1994; Maley and Brenac, 1998; Elenga et al., 2004). Precipitation estimates based on deuterium of terrestrial plant waxes from a core off the Congo River mouth indicate minimal humidity in the Congo Basin (Schefuß et al., 2005).
During this period SSTs reach a minimum of 21◦C and the temperature difference with data from a site located 5 de-grees of latitude further south (GeoB1023) is minimal (Kim et al., 2003). Kim et al. concluded that because of the small SST difference between 12 and 17◦S, the SE trade winds must have been weak. During the same period, biomarker based annual temperature estimates for the Congo Basin in-dicate lowest temperatures of the past 25 ka (Weijers et al., 2007). The low SSTs at 12◦S suggest a northern position of the ABF, over or even north of the location of the site. The CAB took a northern position again, at least during austral summer. The associated SE trade winds probably reached further northward and might have brought more Podocarpus pollen grains with them to the site increasing the representa-tion of Podocarpus both in absolute values (pollen concen-tration, Fig. 4) and relative ones (pollen percentages, Fig. 5). Another implication is that upwelling over the site intensi-fied. This upwelling would have increased the reservoir ef-fect in the radiocarbon dates and the material consequently might be several centuries younger than dated by our age model. If we assume a younger age of 15–18 ka for this pollen zone, i.e. 4 to 8 centuries younger, it would still in-clude the period of Heinrich Event 1.
According to our age model, sedimentation rates increase strongly to values around 1 m/ka at 14.3 ka which correlates with Meltwater Pulse 1a and global sea-level rise (Fairbanks, 1989; Hanebuth et al., 2000). Higher sedimentation rates in-creased the accumulation of all pollen types, but Rhizophora pollen from the mangroves is overrepresented (Fig. 5). A raised representation of mangroves both in relative pollen abundance and by biomarkers during this time is explained by erosion of coastal mangrove peat during transgression and sea-level rise (Kim et al., 2005).
After Heinrich Event 1, between 15.4 and 10.0 ka (PZ4), the representation of the lowland rain forest becomes stronger. Not only pioneer trees such as Mallotus, Celtis, and Alchornea occurred, but also Tetrorchidium and Lophira, indicating increase and maturing of the forest. During this period – just before the Holocene – the lowland rain forest probably reached its southernmost extension (Fig. 7). Apart from the expansion of the lowland rain forest, elements from dry forest and woodlands, such as Burkea-type and Com-bretaceae, and from the Miombo woodlands, such as Ua-paca and Brachystegia, are increasingly represented. The Podocarpus record goes slightly down and that of Olea rises
indicating a change in the mountain forest composition. The Younger Dryas period is not distinguished as such in our pollen record, but part of a longer period of favourable con-ditions for forest growth.
Most African records show a first return to moister condi-tions after the glacial around 15 ka, or slightly later (e.g. Ma-ley and Brenac, 1998; Gasse, 2000; Gasse and Van Campo, 2001; Barker et al., 2004; Lezine and Cazet, 2005). Deu-terium based precipitation estimates are high between 15 and 12 ka and low between 12 and 11 ka (Schefuß et al., 2005). In the Congo Basin increased precipitation resulted subse-quently (at 13.5 ka) in a large palaeo-discharge event (Mar-ret et al., 2001). Interruption and (Mar-return to arid conditions during the Younger Dryas period is clear in the records from north of the equator (e.g. Hoelzmann et al., 2004). South of the equator, Lake Malawi shows an increase of produc-tivity during the Younger Dryas period interpreted as the ef-fect of strong northerly winds over Lake Malawi connected to a southern position of the ITCZ (Johnson et al., 2004). The pollen record of Lake Masoko shows an abrupt and irre-versible change in the flora of the Younger Dryas period sug-gesting the climate changed from a mild short (3–4 months) dry season to a distinctive dry period of no less than 5 to 6 months (Vincens et al., 2007). Some records from west southern Africa indicate wetter conditions that might be as-sociated with the Younger Dryas (Shi et al., 2000). Others, from eastern South Africa, indicate cooler and possibly drier conditions (e.g. Scott, 1982; Holmgren et al., 2003) but many are inconclusive concerning the Younger Dryas period (Scott et al., 1995).
The strong development of the rain forest and the initial development of the woodlands in Angola suggest an early southward shifting of the CAB during winter and summer (Fig. 8). The summer latitude might have been comparable to those of today and the winter latitude might have been further to the south causing a southward shift of the area with more or less humid conditions all year round. SSTs rose strongly indicating that the ABF, and with it the area of coastal up-welling, probably shifted poleward, south of the site. The large difference in SSTs between 12 and 17◦S suggest strong trade winds, in particular during the Younger Dryas period (Kim et al., 2003).
6.3 Holocene
During the early Holocene, between 10.0 and 7.8 ka (PZ5), dry forest and Miombo woodlands became increasingly im-portant while rain forest elements retreated, but for the pio-neer tree Alchornea (Fig. 7). Miombo woodland is nowadays the prevalent vegetation on well drained soils of the main plateau in Angola and other parts of the Zambezian region (White 1983). The woodlands are dominated by species of Brachystegia, often accompanied by Julbernardia or Isober-linia (included in the BerIsober-linia-type). Associates are Afzelia, Uapaca, and Pericopsis. Decline in the representation of
most rain forest elements suggests a northward shift of the winter CAB more or less to its modern position. Mangrove peat erosion increased during Meltwater Pulse 1b around 10 ka (Flemming et al., 1998) and the high total pollen in-put afterwards is associated with more river discharge.
The occurrence of Tarchonanthus/Artemisia afra and Pro-tea shortly before 8 ka might indicate disturbance of dry forests vegetation (see below). Also the slight increase in the representation of Poaceae and Cyperaceae suggests a for-est decline. This disturbance is contemporaneous with the “8.2 ka” event, which has been recognised in equatorial West Africa as an intermittent period of reduced Sanaga discharge associated with a reduction of the West African Monsoon (Weldeab et al., 2007b).
Afterwards, forest composition changed at 7.8 ka. Until 3.7 ka (PZ6) Podocarpus dominates in the mountains and other mountainous elements, such as Olea, are not repre-sented (Figs. 5, 7). The representation of grasses is mini-mal indicating that open vegetation had become rare (Fig. 6). Dry forests included Adansonia digitata and Lannea (Fig. 7). The high representation of Brachystegia, Afzelia, Berlinia-type, and Uapaca suggests a large expansion of the Miombo woodland. However, pollen percentages of Rhamnaceae, probably Ziziphus, and spore percentages of Pteris are also raised, indicating increased swamp forest vegetation. Among the genus Brachystegia there is one species B. laurentii oc-curring in wetter types of the rain forest. Also among Afzelia, the rain forest species A. africana might be present, but its present-day occurrence in the Congolian rain forest is only north of the equator (White, 1983). The genus Uapaca in-cludes rain forest species, as well. Thus, an alternative al-beit less-likely explanation to the spreading of the Miombo woodland would be the expansion of wetter types of rain forest. In both interpretations, savannahs were replaced by closed forest.
At 3.7 ka, the vegetation drastically changed again. The occurrence of Rhizophora pollen grains (Fig. 5) during this period indicates marine transport from the north as the mod-ern southmod-ernmost distribution of mangroves is along the River Longa (10◦S, Spalding et al., 1997). Supply of Rhi-zophora pollen through erosion of older mangrove peat strata is implausible, because global sea-level did not rise much during this period.
Typical for the past 3.7 ka (PZ7) is the dramatic increase in the representation of Cyperaceae and grasses (Fig. 5). After 2 ka, the relative abundance of Poaceae pollen is even higher than during glacial times. The increase in Cyperaceae pollen percentages might be a localised phenomenon, the increase in grass pollen percentages is more regional as it is found as well in GeoB1016, located further offshore on the lower continental slope at 3411 m water depth (Shi and Dupont, 1997; Dupont et al., 2007). We find the high representa-tion of grasses associated with more forest elements but not with increased relative abundance of desert or mountain el-ements. We, therefore, infer a strong increase of the
savan-nah. The modern savannah forest mosaic of northern Angola might have come into existence around two thousand years ago. The patchy character of the forests is underlined by the increased representation of light-loving trees such as Al-chornea and the oil palm, Elaeis guineensis (Fig. 7).
Other changes are found in the composition of the dry forest, in which Burkea, Hymenocardia (possibly H. acida), Protea, and Tarchonanthus (possibly T. camphoratus) and/or Artemisia afra must have been prominent (Fig. 7). The lat-ter taxa are associated with fire. Tarchonanthus camphora-tus regenerates very well after disturbance by cutting or fire (Kiruki and Njung’e, 2007), Artemisia afra often colonizes burnt areas in mountains (Beentje, 1994), Protea grows in mountainous grasslands that are burnt, and Hymenocardia acida is also fire hardy (White, 1983). However, there is no increase in the amount of charcoal particles relative to the amount of pollen and spores. The amount of charcoal parti-cles relative to the pollen sum is especially high during the glacial (Fig. 7). The continuity of the charcoal record indi-cates that fire always played a role in the vegetation devel-opment. We can only explain the occurrence of more fire-hardy elements by assuming a change but not necessarily an increase in the fire regime that favoured these specific trees.
The development in Angola fits the general trend of a humid early and middle Holocene followed by a drier late Holocene (Marchant and Hooghiemstra, 2004). The savan-nah minimum and probably most humid phase in Angola from 7.8 to 3.6 ka falls during the maximum northward ex-tension of the Sahelian vegetation from 7.8 to 5.7 ka (Hoelz-mann et al., 2004) but lasts longer. The humid phase in An-gola ended around the same time as the second of two aridifi-cation steps (around 6.7–5.5 ka and 4.0–3.6 ka) indicated by lake levels of the Sahara-Sahel region (Gasse, 2000). Only the first aridification step is recorded in the dust flux record of ODP Hole 658C as the end of the African Humid period (De-Menocal et al., 2000; Adkins et al., 2006). Also west equa-torial pollen records and the deuterium record for the Congo Basin indicate a sharp drop in humidity around 3 ka, which favoured the opening of the forest and the spread of savan-nahs (Elenga et al., 2004; Schefuß et al., 2005). A reforesta-tion after 1 ka as suggested by the pollen records from Con-golian sites (Vincens et al., 1999) is not found in our record. In East Africa Holocene precipitation levels became increas-ingly variable after 4 ka and declined after 2 until 0.5 ka (Bonnefille and Chali´e, 2000). For southern Africa numer-ous proxies indicate a temperature optimum shortly before 7.5 ka and increase in summer rainfall. Aridification set in soon after 5 ka (Scott and Lee-Thorp, 2004).
Thus, the Holocene climatic changes proceed largely par-allel in northern, southern and equatorial Africa. Important changes in the average position or latitudinal migration of the tropical frontal systems (ITCZ and CAB), however, should have caused changes in the opposite direction. It seems that these frontal systems were in place during the Holocene and that the aridification of the past 4 to 2 ka cannot be explained
by a southward shift of the average position of the CAB and ITCZ over Africa.
We might look to other than climatic causes for the veg-etation changes in Angola two thousand years ago. Yet, ar-chaeological data are scarce. Along tributaries of the Congo River in the central Congo Basin earliest findings date be-tween 400 and 100 BC (Wotzka, 1995). In Angola, the ear-liest known ceramics originate from a site close to Luanda, and are no older than the second century AD (Lanfranchi and Clist, 1991). In northern Namibia, early ceramics date back to the first centuries AD. These finds suggest an economy based on small cattle herding and hunting (Bostoen, 2007). Still, it seems difficult to conceive that small cattle herding and hunting would have an impact big enough to explain the environmental change recorded in the marine sediments. Moreover, the increase in savannah vegetation already started shortly after 4 ka, almost two millennia earlier than the ear-liest pottery findings in Angola. Much more corroborating terrestrial evidence is needed before human impact can be postulated as an important driver of the savannah increase and changes in forest composition around 0 BC.
7 Conclusions
The marine pollen record of ODP Hole 1078C provides a detailed history of the Angolan vegetation development since the last glacial, which we interpret as follows.
– From 31.7 ka (the beginning of the record) until 21.9 ka
open mountainous vegetation with heather species, composites, and grasses was important, but dry wood-lands also existed. Desert and semi-desert extended rather far to the north.
– Between 21.9 and 18.8 ka Podocarpus trees spread in
the mountains, while rain forest started to expand in the northern lowlands.
– From 18.8 to 15.4 ka rain forest remained present in the
northern lowlands and Podocarpus forest might have been locally abundant in the mountains.
– After 15.4 ka the Olea record indicates a change in the
mountain forest composition. Until 10.0 ka rain for-est was important, but woodland elements were also present.
– The Holocene started with dry forest and Miombo
woodlands expanding while rain forest elements re-treated.
– After a disturbance around 8 ka Podocarpus forest
dom-inated between 7.8 and 3.7 ka. During this period, ei-ther Miombo woodland or wetter types of rain forest expanded and replaced open savannah vegetation.
– Savannahs became increasingly important after 3.7 and
again after 2 ka. Forests probably became patchy grow-ing light-lovgrow-ing and fire-hardy trees.
Glacial SSTs fluctuate around 22◦C until 19 ka and show a prominent minimum of ca. 21◦C at 16 ka. From this mini-mum SSTs rise continuously to mid and late Holocene levels between 24 and 25◦C. During the past 7 ka, a slight cooling
by half a degree occurred between 5 and 4 ka.
After the cool and dry climate of the last glacial the change to more humid conditions started very early in An-gola (22 ka). The early amelioration is probably related to the early warming on Antarctica. The CAB might have shifted to the south (Fig. 8).
Between 18.8 and 15.4 ka (around Heinrich Event 1), low SSTs indicate a northern position of the ABF implying per-manent upwelling along the coast and strong SE trade winds. Conditions were cool but probably not arid. During this early stage there is a different development in Angola than in the Congo Basin or in West Africa where the climate was cold and dry.
After Heinrich Event 1, the climate in Angola became wet-ter and warmer and possibly even wetwet-ter than during most of the Holocene. No return to glacial conditions was found for the Younger Dryas period. The average position and the lat-itudinal migration of the CAB and ITCZ might have been further south than during the Holocene (Fig. 8).
During the early Holocene the average position of the CAB was probably already close to its present position and the modern West African monsoon system in place.
Appendix A
Grouping of pollen types
Steppe/desert/semi-desert
Acanthaceae (Barleria, Justicia/Monechma, Petalidium), Aizoaceae, Amaranthaceae (Gomphrena-type), Amaran-thaceae/Chenopodiaceae, Arecaceae (Phoenix), Asteraceae (Atractylis-type, Asteroideae, Cichoroideae, Pentzia-type, Stoebe-type), Boraginaceae (Cordia, Heliotropium), Burs-eraceae (Boswellia), Campanulaceae, Capparaceae (Cad-aba, Cleome, Maerua-type), Caryophyllaceae, Convolvu-laceae (Convolvulus-type, Ipomoea-type, Merremia), Cras-sulaceae (Kalanchoe), Cucurbitaceae (Citrullus), Euphor-biaceae (Chrozophora, Euphorbia), Fabaceae (Crotalaria, Indigofera-type, Parkinsonia, Rhynchosia-type, Tephrosia), Geraniaceae (Pelargonium), Liliaceae (Aloe-type), Mal-vaceae, Neuradaceae, Nyctaginaceae (Boerhavia), Plan-taginaceae (Plantago), Polygonaceae (Calligonum), Sal-vadoraceae (Salvadora persica), Sapindaceae (Dodon-aea viscosa), Scrophulariaceae (Walafrida), Solanaceae (Solanum), Sterculiaceae (Hermannia, Hermannia stricta-type), Thymelaeaceae, Tiliaceae (Corchorus), Verbenaceae
(Phyla nodiflora), Welwitschiaceae (Welwitschia), Zygo-phyllaceae (Nitraria, Tribulus, Zygophyllum)
Dry forest and savannah
Acanthaceae (Blepharis-type, Hypoestes-type) Anac-ardiaceae (Lannea-type, Sclerocarya-type birrea), An-nonaceae, Araliaceae (Cussonia), Arecaceae (Cocos nucifera), Asteraceae (Tarchonanthus/Artemisia afra-type), Balanitaceae (Balanites), Bignoniaceae (Spathodea), Bom-bacaceae (Adansonia, Bombax, Ceiba pentandra), Buxaceae (Buxus madagascarica-type) Caesalpiniaceae (Bauhinia-type, Burkea, Cassia-type, Colophospermum mopane, Detarium, Dialium-type, Piliostigma), Capparaceae (Boscia-type, Capparis), Celastraceae (Maytenus-type), Clusiaceae (Garcinia), Conneraceae (Cnestis-type), Cu-curbitaceae (Coccinia, Luffa), Euphorbiaceae (Acalypha, Antidesma, Bridelia, Croton-type, Hymenocardia, Se-curinega), Fabaceae (Baphia-type, Dalbergia, Erythrina, Ormocarpum, Papilionoideae p.p., Pterocarpus-type, Sesba-nia-type), Flacourtiaceae (Flacourtia), Linaceae (Hugonia), Loganiaceae (Strychnos), Malphigiaceae (Triapsis), Meli-aceae (Pseudocedrela), Mimosaceae (Mimosa pigra), Myrsinaceae (Maesa lanceolata-type), Nyctaginaceae p.p., Olacaceae (Olax), Oleaceae (Jasminum/Schrebera), Proteaceae (Protea), Ranunculaceae (Clematis-type), Ru-biaceae (Canthium, Kohautia, Psydrax-type subcordata, Rubiaceae monade, Rytigynia-type, Spermacoce-type, Stip-ularia africana, Tarenna), Rutaceae (Teclea, Zanthoxylum), Sapindaceae (Allophylus, Cardiospermum), Sapotaceae (Butyrospermum), Sterculiaceae (Dombeya, Sterculia-type), Tiliaceae (Grewia)
Miombo woodland
Caesalpiniaceae (Afzelia, Berlinia-type, Brachystegia, Para-macrolobium), Euphorbiaceae (Uapaca), Fabaceae (Pericop-sis)
Mountain elements
Aquifoliaceae (Ilex cf. I. mitis), Ericaceae, Geraniaceae (Geranium), Lamiaceae (Ocimum), Myricaceae (Myrica), Myrsinaceae (Myrsine africana), Oleaceae (Chionanthus-type, Olea, Olea capensis), Podocarpaceae (Podocar-pus), Rubiaceae (Anthospermum), Restionaceae, Sapotaceae (Chrysophyllum)
Wet lowland forest (rain forest)
Anacardiaceae (Sorindeia-type), Apocynaceae (Ade-nium, Funtumia-type), Arecaceae (Elaeis guineen-sis), Bignoniaceae (Stereospermum), Caesalpiniaceae (Daniellia-type, Duparquetia orchidacea, Mezoneuron-type, Tamarindus/Cryptosepalum, Tessmannia), Celas-traceae/Hippocrateaceae, Euphorbiaceae (Alchornea,
Klaineanthus, Mallotus-type, Martretia, Phyllanthus, Tetrorchidium), Icacinaceae (Iodes), Leeaceae (Leea), Loranthaceae (Tapinanthus-type), Meliaceae (Khaya-type, Manilkara), Mimosaceae (Entada-type, Pentaclethra), Moraceae p.p., (Bosqueia), Myristicaceae (Pycnanthus), Myrtaceae (Sysygium), Ochnaceae (Lophira, Sauvage-sia), Araliaceae (Schefflera), Rubiaceae (Coffea-type, Crossopteryx, Cuviera, Gaertnera, Ixora-type, Morinda, Mussaenda, Psydrax-type parviflora, Sabicea, Sher-bournea), Sapindaceae (Blighia-type), Sterculiaceae (Cola cordifolia, Cola nitida-type, Melochia), Ulmaceae (Celtis, Holoptelea), Urticaceae, Vitaceae (Cissus)
Swamps
Acanthaceae (Hygrophila-type), Agavaceae (Dracaena), Alismataceae (Alisma plantago-aquatica ), Arecaceae (Borassus-type, Hyphaene-type, Raphia-type), Bignoni-aceae (Kigelia-type), BurserBignoni-aceae (Canarium), Caesalpini-aceae (Monopetalanthus-type), ClusiCaesalpini-aceae/Guttiferae (Sym-phonia globulifera), Dispacaceae (Cephalaria), Droser-aceae (Drosera), EuphorbiDroser-aceae (Macaranga), FabDroser-aceae (Aeschynomene), Halorrhagaceae (Myriophyllum), Irvin-giaceae (Irvingia), Meliaceae (Trichilia), Mimosaceae (Pseudoprosopis), Nymphaeaceae (Nymphaea), Onagraceae (Ludwigia), Passifloraceae (Adenia), Potamogetaceae (Pota-mogeton), Rhamnaceae, Rubiaceae (Gardenia, Psychotria), Salicaceae (Salix), Sapindaceae (Aporrhiza), Typhaceae (Typha angustifolia-type, Typha latifolia), Utriculariaceae (Utricularia), Xyridaceae (Xyris)
Acknowledgements. We thank Irina Nickeleit, Oliver Lackmann, and Eric Ehlers for their help with the preparation of the samples. We are indepted to Stefan Mulitza who provided the unpublished radiocarbon dates. Annie Vincens and Guillaume Buchet helped to identify the pollen of Buxus-type madagascarica. We thank Francoise Chali´e and an anonymous referee for their constructive reviews. Financial support was given by the Deutsche Forschungs-gemeinschaft (DFG). Data are available in PANGAEA.
Edited by: C. Hatt´e
References
Adegbie, A. T., Schneider, R. R., R¨ohl, U., and Wefer, G.: Glacial millennial-scale fluctuations in central African precipita-tion recorded in terrigenous sediment supply and freshwater sig-nals offshore Cameroon, Palaeogeogr. Palaeocl., 197, 323–333, 2003.
Adkins, J., DeMenocal, P., and Eshel, G.: The ”African hu-mid period” and the record of marine upwelling from excess 230Th in Ocean Drilling Program Hole 658C, Paleoceanography, 21(PA4203), 1–14, 2006.
Barker, P., Talbot, M. R., Street-Perrot, F. A., Marret, F., Scourse, J., and Odada, E.: Late Quaternary climatic variability in intertrop-ical Africa, in: Past Climate Variability through Europe and Africa, Springer, Dordrecht, The Netherlands, 118–138, 2004.
Bartholome, E., Belward, A. S., Achard, F., Bartalev, S., Carmona-Moreno, C., Eva, H., Fritz, S., Gregoire, J.-M., Mayaux, P., and Stibig H.-J.: GLC2000: Global Land Cover mapping for the year 2000, http://www-gem.jrc.it/glc2000/, European Commis-sion, 2002.
Beentje, H.: Kenya trees, shrubs and lianas, National Museum of Kenya, Nairobi, Kenya, 1994.
Bonnefille, R. and Chali´e, F.: Pollen-inferred precipitation time-series from equatorial mountains, Africa, the last 40 kyr BP, Global Planet. Change, 26, 25–50, 2000.
Bonnefille, R. and Riollet, G.: Pollens des savanes d’Afrique orien-tale, ´Editions du Centre National de la Recherche Scientifique, Paris, France, 1980.
Bonnefille, R. and Riollet, G.: The Kashiru pollen sequence (Bu-rundi). Palaeoclimatic implications for the last 40,000 yr. B.P. in tropical Africa, Quaternary Res., 30, 19–35, 1988.
Bostoen, K.: Pots, words and the Bantu problem: on lexical re-constructionand early African history, J. Afr. Hist., 48, 173–199, 2007.
Butzin, M., Prange, M., and, Lohmann, G.: Radiocarbon simula-tions for the glacial ocean: the effects of wind stress, Southern Ocean sea ice and Heinrich events, Earth Planet. Sci. Lett., 235, 45–61, 2005.
Coetzee, J. A.: Pollen analytical studies in east and southern Africa, Palaeoecol. Afr., 3, 1–146, 1967.
DeMenocal, P. B., Ortiz, J., Guilderson, T., and Sarnthein, M.: Coherent high- and low-latitude climate variability during the Holocene warm period, Science, 288, 2198–2202, 2000. Dupont, L. M. and Behling, H.: Land-sea linkages during
deglacia-tion: High-resolution records from the eastern Atlantic off the coast of Namibia and Angola (ODP site 1078), Quatern. Int., 148, 19–28, 2006.
Dupont, L. M. and Wyputta, U.: Reconstructing pathways of aeo-lian pollen transport to the marine sediments along the coastline of SW Africa, Quaternary Sci. Rev., 22, 157–174, 2003. Dupont, L. M., Shi, N., Jahns, S., and Marret, F.: Podocarpus in
West Africa during the Late Pleistocene, Palaeoecol. Afr., 24, 85–101, 1996.
Dupont, L. M., Behling, H., Jahns, S., Marret, F., and Kim, J.-H.: Variability in glacial and Holocene marine pollen records offshore from west southern Africa, Veg. Hist. Archaeobot., 16, 87–100, 2007.
Elenga, H., Schwartz, D., and Vincens, A.: Pollen evidence of late Quaternary vegetation and inferred climate changes in Congo, Palaeogeogr. Palaeocl., 109, 345–356, 1994.
Elenga, H., Maley, J., Vincens, A., and Farrera, I.: Palaeoenvi-ronments, palaeoclimates and landscape development in Atlantic Equatorial Africa: a review of key sites covering the last 25 kyrs, Past Climate Variability through Europe and Africa, Springer, Dordrecht, The Netherlands, 181–198, 2004.
Fairbanks, R. G.: A 17,000-year glacio-eustatic sea level record: influence of glacial melting dates on the Younger Dryas event and deep ocean circulation, Nature, 342, 215–230, 1989. Fairbanks, R. G., Mortlock, R. A., Chiu, T.-C., Cao, L., Kaplan,
A., Guilderson, T. P., Fairbanks, T. W., Bloom, A. L., Grootes, P. M., and Nadeau, M.-J.: Radiocarbon calibration curve spanning 0 to 50,000 years BP based on paired230Th/234U/238U and14C dates on pristine corals, Quaternary Sci. Rev., 24, 1781–1796, 2005.
Fleming, K., Johnston, P., Zwartz, D., Yokoyama, Y., Lambeck, K., and Chappell, J.: Refining the eustatic sea-level curve since the Last Glacial Maximum using far- and intermediate-field sites, Earth Planet. Sci. Lett., 163, 327–342, 1998.
Gasse, F.: Hydrological changes in the African tropics since the Last Glacial Maximum, Quaternary Sci. Rev., 19, 189–211, 2000.
Gasse, F. and Van Campo, E.: Late Quaternary environmental changes from a pollen and diatom record in the southern trop-ics (Lake Tritrivakely, Madagascar), Palaeogeogr. Palaeocl., 167, 287–308, 2001.
Hanebuth, T., Stattegger, K., and Grootes, P. M.: Rapid flooding of the Sunda shelf: A Late-Glacial sea level record, Science, 288, 1033–1035, 2000.
Hastings, D. A. and Dunbar, P. K.: Development & assessment of the Global Land One-km Base Elevation digital elevation model (GLOBE), ISPRS Archives, 32, 218–221, 1998.
Hoelzmann, P., Gasse, F., Dupont, L.M., Salzmann, U., Staub-wasser, M., Leuschner, D. C., and Sirocko, F.: Palaeoenvi-ronmental changes in the arid and sub arid belt (Sahara-Sahel-Arabian Peninsula) from 150 kyr to present, Past Climate Vari-ability through Europe and Africa, Springer, Dordrecht, The Netherlands, 219–256, 2004.
Hughen, K. A., Baillie, M. G. L., Bard, E., Bayliss, A., Beck, J. W., Bertrand, C., Blackwell, P. G., Buck, C. E., Burr, G., Cutler, K. B., Damon, P. E., Edwards, R. L., Fairbanks, R. G., Friedrich, M., Guilderson, T. P., Kromer, B., McCormac, F. G., Manning, S., Bronk Ramsey, C., Reimer, P. J., Reimer, R. W., Remmele, S., Southon, J. R., Stuiver, M., Talamo, S., Taylor, F. W., Van Der Plicht, J., and Weyhenmeyer, C. E.: Marine04 Marine radiocar-bon age calibration, 26–0 ka BP, Radiocarradiocar-bon, 46, 1059–1086, 2004.
Johnson, T. C., Brown, E. T., and McManus, J.: Diatom productiv-ity in Northern Lake Malawi during the past 25 000 years: impli-cations for the position of the Intertropical Convergence Zone at millennial and shorter time scales, Past Climate Variability through Europe and Africa, Springer, Dordrecht, The Nether-lands, 93–116, 2004.
Jolly, D. and Haxeltine, A.: Effect of low glacial atmospheric CO2 on tropical African montane vegetation, Science, 276, 786–788, 1997.
Kim, J.-H., Schneider, R. R., M¨uller, P. J., and Wefer, G: Interhemi-spheric comparison of deglacial sea-surface temperature patterns in Atlantic eastern boundary currents, Earth Planet. Sci. Lett., 194, 383–393, 2002.
Kim, J.-H., Schneider, R. R., Mulitza, S., and M¨uller, P. J.: Recon-struction of SE trade-wind intensity based on sea-surface tem-perature gradients in the Southeast Atlantic over the last 25 kyr, Geophys. Res. Lett., 30, 2144–2147, 2003.
Kim, J.-H., Dupont, L. M., Behling, H., and Versteegh, G. J. M.: Impacts of rapid sea-level rise on mangrove deposit erosion: ap-plication of taraxerol and Rhizophora records, J. Quaternary Sci., 20, 221–225, 2005.
Kiruki, H. and Njung’e, J.: Population density, structure and early growth characteristics of Tarchonanthus camphoratus ina wood-land at Naivashe, Kenya, Afr. J. Ecol., 45, 31–40, 2007. K¨ohler, E. and Br¨uckner, P.: Die Pollenmorphologie der
afrikanis-chen Buxus- und Notobuxus-Arten (Buxaceae) und ihre system-atische Bedeutung, Grana, 21, 71–82, 1982.