HAL Id: lirmm-00659473
https://hal-lirmm.ccsd.cnrs.fr/lirmm-00659473
Submitted on 12 Jan 2012HAL is a multi-disciplinary open access
archive for the deposit and dissemination of sci-entific research documents, whether they are pub-lished or not. The documents may come from teaching and research institutions in France or abroad, or from public or private research centers.
L’archive ouverte pluridisciplinaire HAL, est destinée au dépôt et à la diffusion de documents scientifiques de niveau recherche, publiés ou non, émanant des établissements d’enseignement et de recherche français ou étrangers, des laboratoires publics ou privés.
Approximate Common Intervals in Multiple Genome
Comparison
Pierre Riou, Eric Rivals, Annie Chateau
To cite this version:
Pierre Riou, Eric Rivals, Annie Chateau. Approximate Common Intervals in Multiple Genome Com-parison. BIBM’11: Bioinformatics and Biomedicine, Nov 2011, Atlanta, United States. pp.131-134, �10.1109/BIBM.2011.96�. �lirmm-00659473�
Approximate Common Intervals in Multiple Genome Comparison
Annie Chateau, Pierre Riou,Eric Rivals
LIRMM, UMR 5506 CNRS, Universit´e Montpellier 2, Montpellier, France {annie.chateau, pierre.riou, eric.rivals}@lirmm.fr
September 20, 2011
Abstract
We consider the problem of inferring approximate common intervals of multiple genomes. Genomes are modelled as sequences of homologous genes families identifiers, and approx-imate common intervals represent conserved regions possibly showing rearrangements, as well as repetitions, or insertions/deletions. This problem is already known, but existing approaches are not incremental and somehow limited to special cases. We adopt a simple, classical graph-based approach, where the vertices of the graph represent the exact common intervals of the sequences (i.e., regions containing the same gene set), and where edges link vertices that differ by less than δ elements (with δ being parameter). With this model, approximate gene clusters are maximal cliques of the graph: computing them can exploit known and well designed algorithms. For a proof of concept, we applied the method to several datasets of bacterial genomes and compared the two maximal cliques algorithms, a static and a dynamic one. While being quite flexible, this approach opens the way to a combinatorial characterization of genomic rearrangements in terms of graph substructures.
Introduction
Comparative genomics at the genes order level aims at studying genomes relationships from a global viewpoint to explain either their rearrangement history during evolution, or the actual similarities and differences between species, strains, or even individuals. Previous works, which represented genomes as ordered list of genes, have brought evidences that conserved gene clusters are biologically relevant [9, 6], e.g. for inferring gene functions.
Here, we focus on the comparison of closely related species to infer shared genes clusters called approximate common intervals. This study is in the line of previous works that considered simpler cases. The simplest case consists in computing exact common intervals between two signed permutations. An efficient algorithm was proposed by Uno and Yagiura in [13]. Since then, a lot of papers have been published on the same model of permutations, with varying or generalizing contexts. A complete survey of these works is proposed in [4]. These methods are efficient, however they neglect gene insertions/deletions or repetitions, which are known to occur frequently in genomes. Modeling genomes by sequences, rather than by permutations, was proposed in [3]. First algorithms that find common intervals carrying the same gene set have been exhibited in [11], thereby accounting for differences in terms of repeats. Then more complex methods were designed for finding approximate common clusters, but these are dedicated to a specific distance between gene sets [2, 5, 1].
Our aim is two-fold: first to investigate a general, graph-based approach that accommodates any notion of distance and offers incremental computation, second to provide a proof of concept
Copie d’auteur/Author’s Copy the clusters found are biologically meaningful. Rather than directly computing the approximate common intervals, we first build a graph in which cliques represent approximate common in-tervals (a classical framework that has not yet been applied in this context, to our knowledge). This graph is an interesting, combinatorial object per se: cliques, as well as connected com-ponents, and maybe other structures may reveal evolutionary information. Moreover, clique computation is a sub-problem in our framework, which is delegated to dedicated algorithms, for the sake of modularity. We compared two alternative solutions: a dynamic one, which allows to add a new genome to an existing comparison, and a static one, which proves relatively efficient on graphs obtained with bacterial genomes.
In Section 1, we present useful definitions and state the problem. Section 2 describes the algorithms for computing the graph, In Section 3, we present an overview of the results obtained on bacterial datasets.
1
Definitions
Genomes are modelled by sequences of integers representing families of homologous DNA se-quences, basically genes, but one could use any markers of interest. We suppose that the families are given a priori. We use a linear model, but the circular case can be addressed by the same techniques and definitions.
In what follows, S1, . . . , Sk are k sequences over an alphabet Σ of finite size σ, and n is the maximal length of these sequences. For a sequence w of size |w|, we denote by w[i] the ith element of w, and w[a, b] the substring of w between positions a and b.
Definition 1 (Character set) Given a sequence w of size |w|, its character set C(w) is defined by C(w) := {w[i] : 1 ≤ i ≤ |w|}.
Definition 2 (Left- and right-maximality) Let w be sequence. A substring w[a, b] of w is left-maximal (resp. right-maximal) with respect to w, if a = 1 or a > 1 and w[a−1] /∈ C(w[a, b]) (resp. b = |w| or b < |w| and w[b + 1] /∈ C(w[a, b])). The substring w[a, b] is maximal, if it is left-maximal and right-maximal.
Definition 3 (Location) A location of a set of characters C on a sequence w is an interval [a, b] such that C(w[a, b]) = C.
1.1 Approximate common interval
Definition 4 (Exact common interval of p sequences) A common interval of p sequences is a set E of substrings from p ≤ k sequences among S1, ..., Sk such that for all the pairs (w1, w2) ∈ E2, C(w1) = C(w2). A common interval is maximal if it contains only maximal substrings.
In all what follows, we only consider maximal common intervals.
To introduce a notion of approximation, we have to define a distance between character sets. A possible choice for the distance d is the maximum set-distance defined for two sets A and B by: d(A, B) = max{|A\B|, |B\A|}. The main advantage of this distance is that it is less restrictive than the symmetric difference used in [2, 5, 1]. Therefore it is interesting if we want to limit it to little values because it may allow us to find substitions in the sequences. This distance will be used in the experimental part, but the definitions and algorithms work with any kind of distance between sets.
Definition 5 (Approximate common interval) Given an integer δ > 0, a δ-approximate common interval of p sequences is a set E of substrings from p ≤ k sequences among S1, ..., Sk such that for all the pairs (w1, w2) ∈ E2, d(C(w1), C(w2)) < δ.
An approximate common interval is a set of regions of several genomes that have similar gene content. Biologically, it may be syntenic regions or co-expressed genes. Remark that for δ = 1, the approximate common intervals are exactly the common intervals and the locations may contain internal rearrangements, repetitions, as well as insertions/deletions.
The algorithm presented in Section 2 intends to detect the approximate common intervals. To prevent from considering a lot of biologically irrelevant cases, we introduce two additional parameters in our problem, which are:
• s is the minimum size of considered character sets, eliminating substrings with non-intersecting character sets;
• q indicates the minimum number of sequences that must be concerned by the locations of a given character set.
Then, we generalize the problem to: Given s, δ and q three integers, and a set-distance d, list all sets E of maximal substrings of size at least s on at least q sequences between S1, ..., Sk such that for each pair (w1, w2) ∈ E2, d(C(w1), C(w2)) < δ.
1.2 The δ-graph
Definition 6 (δ-graph) Given an integer δ, a minimum character set size s, a quorum pa-rameter q and a set-distance d, the δ-graph of k sequences is the graph whose vertices are the character sets corresponding to substrings of size at least s that are located on at least q genomes. An edge links two vertices A and B if d(A, B) < δ.
Note that, if q = 1, the approximate common intervals are the cliques of this graph. However, if q > 1, the equivalence is no longer true, but we gain in computation time and flexibility.
Definition 7 (Connected cluster) Given k sequences S1, ..., Sk, and three integers s, q and δ, a connected cluster of these sequences is a set E of substrings from S1, ..., Sk such that the set {C(w) : w ∈ E} is a connected component of the δ-graph of S1, ..., Sk.
This notion enlarges the notion of clique, and it may prove biologically relevant. With connected clusters, we can for instance analyse rearrangement events.
2
Method
Each genome is represented as an ordered list of its genes. To account for unequal gene content and duplications, we chose to identify each gene by the Hogenom gene family [10] it belongs to. Our system first extracts the genome representations from Hogenom files, builds the δ-graph for the k genomes, computes its cliques and maximal connected components (CC), then allows a general visualisation of the entire graph or detailed view of its CC. The algorithms for graph construction and maximal cliques computation are described below.
Copie d’auteur/Author’s Copy
2.1 Construction of the graph
In the δ-graph, a vertex represents the character set of an exact common interval, while edges link vertices whose character sets differ by less than δ genes according to the distance d. A vertex stores its size and the list of its locations in the order in which they are found on the genomes. For a location we record the genome identifier and the interval in gene positions of the location. All vertices are stored in a list sorted on character sets’ cardinality. To compute the distance between a character set and that of a location, we maintain a hash-table containing all the positions of any gene on each genome. The processing of each sequence is done in two distinct steps. The genomes are first processed to detect substrings that are maximal with respect to their character set. Each maximal substring is then processed by calling a second algorithm with the character set and the location as input.
In order to compute all the maximal substrings of a genome Si, we define b, e as the start and end positions of the current substring, and ξ as the character set of Si[b, e]. The set ξ and its size t are initialised and updated as b and e move on Si.
A second algorithm processes a maximal substring and its character set ξ to update the graph. First, we check whether there exists a vertex for ξ in the current δ-graph. When not, we just create a new vertex containing the current substring as its first location. If such vertex V exists, we append the current substring in the location list of V . In case where V now has at least one location on q genomes, we compute the distance between V and each vertex W such that |C(W )| lies in range [|ξ| − δ, |ξ| + δ], and add a new edge if this distance is < δ.
Theorem 1 The algorithm described in the previous paragraphs builds the δ-graph in O(k2n5) time and O(k2n4) space.
2.2 Computation of the maximal cliques in the graph
Given the definition of δ-graph, for q = 1, an approximate common interval of the k genomes is a maximal clique in δ-graph. We studied two alternative algorithms to compute all the maximal cliques in δ-graph: a static and a dynamic one. In [12, 8], the authors describe an algorithm for computing maximal cliques dynamically during the building of the graph. We provide, to our knowledge, the first implementation of this algorithm. The second algorithm is called MACE ([7]). It computes the maximal cliques once the graph is built. We use an implementation from its authors, which takes at most O(k3n6) time in our setup.
The first method can be used when one needs to output the cliques as the genomes are processed or if one adds new genomes to an already existing graph; in the latter case, it avoids computing the maximal cliques from scratch on the whole graph. As illustrated in our result (table 1), the algorithm MACE is faster for a non dynamic application.
2.3 Computation of the maximal connected component in the graph
The maximal connected components (CC) of δ-graph are the connected clusters of genes of the input genomes. Each vertex belongs to only one connected component. CC are computed dynamically during the graph construction. Each CC is represented as a list of vertices, in which each element is linked back to its CC. Thus, for a given vertex finding its CC is done in constant time. Since each CC also stores its size, the fusion of two CC is done in Θ(n), where n denotes the size of the smallest CC. Therefore, computing the CC during graph construction does not increase the algorithm complexity.
3
Results
Our algorithms are applied on three bacterial datasets, which differ in term of number of genomes, genome similarity, and of gene numbers. It allows to study which factor impacts the running time and graph complexity.
3.1 Material
The δ-graphs from some bacterial genomes from the Escherichia and Ehrlichia genus were com-puted. Three distinct datasets were formed:
DS1 contains two genomes of Escherichia coli: Escherichia coli K12 MG1655 and Escherichia coli K12 W3110
DS2 contains five bacterial genomes of Escherichia: Escherichia coli K12 MG1655, Escherichia coli Sakai, Escherichia coli atcc8739, Escherichia coli uti89 and Escherichia fergusonii
DS3 contains six Ehrlichia genomes: Anaplasma phagocytophilum, Ehrlichia canis str. Jake, Ehrlichia chaffeensis str. Arkansas, Ehrlichia ruminantium str. Gardel, Ehrlichia ruminantium str. Welgevonden and Neorickettsia sennetsu
3.2 Experimental results
DS1 DS2 DS3
Alphabet size 3078 5471 2325
# genomes 2 5 6
Graph constr. time 8,9 hours 42 hours 40 minutes Dynamic cliques computation time 1.5s 0.8s 0.3s Static cliques computation time 0.5s 0.2s 0.03s # cliques 405590 200563 30365 # CC 15 37 25 # vertices 211339 107665 16605 # edges 637173 324968 48197
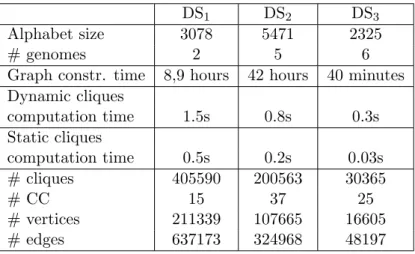
Table 1: Comparing the δ-graph size, the algorithms output and running time on three real datasets when run with parameters s = 3, δ = 2, and q = 2.
Table 1 compares the running time and the δ-graph built for each dataset. The alphabet size clearly impacts δ-graph construction time as one would expect. Also, the size of δ-graph depends on the genomes’ similarity. For example, the two genomes of E. coli K12 strains (DS1) are very closely related and give rise to a bigger graph than that obtained for five Escherichia genomes (DS2), which are less similar.
When comparing the two cliques computation algorithms, one notices that the static version runs much faster. Our graphs have small densities, ranging from 2.85 × 10⁻⁵ to 3.5 × 10⁻⁴, and the implemented algorithm has been optimized for sparse graphs: this likely explains our observation. This suggests that considering the graph structural properties may help optimizing the algorithm and improving its running times.
Copie d’auteur/Author’s Copy
4
Conclusion
We consider a graph-based model of approximate common intervals for multiple genome com-parison. We provide an implementation to build a graph with potentially interesting information on rearrangement events, and develop an interface and visualisation tools to analyse this graph. This method can be used to help in the task of annotation of genomes and also to infer homology relationships between genes. To give a biological proof of concept, we chose and investigated one connected component of the Escherichia dataset for its size allowed a visual representation and it illustrates an apparent ”substitution” of genes between two species. This analysis yields some reasonable evidence of a missed gene in the annotation of a well studied, and pathogenic strain of Escherichia coli, one of the most studied species. A possible homology, or even orthol-ogy relationship can be proposed between the proteins of the three species under consideration. These results are not shown here and will be presented in a longer article.
Future research avenues include exploring the graph properties, and characterizing the sub-graphs generated by different types of genomic rearrangements. We already know that inser-tions/deletions cause a disturbance in the graph connexity, and that inversions provide trian-gular structures with anomalies, but these observations could be refined and extended.
Other research efforts would complement this study: the optimization of the graph construc-tion in order to analyse more genomes and more complex genomes is one of them. It would also be interesting from a biological viewpoint to study the influence of the parameter δ. In our experiments, we set δ = 2 to enable visualising the graph and its components, but this remains a strong constraint on the similarity between the character sets. Releasing δ would enlarge the locations involved in connected components.
The flexibility of this framework is a major advantage. Although choosing a distance measure may not be easy, it allows to investigate new distances, for instance by considering weights based on confidence in the orthology relationship, or other structural and fonctional characteristics.
Acknowledgments
AC, PR, and ER are supported by the French National Research Agency (CoCoGen project) [BLAN07-1 185484]. PR benefits from a grant from French Minister for Research and Educa-tion. This work is supported by IBISA contract no 048518.
References
[1] A. Amir, L. Gasieniec, and R. Shalom. Improved approximate common interval. Informa-tion Processing Letters, 103(4):142–149, 2007.
[2] S. B¨ocker, K. Jahn, J. Mixtacki, and J. Stoye. Computation of median gene clusters. In RECOMB, pages 331–345, 2008.
[3] C. Chauve, Y. Diekmann, S. Heber, J. Mitxacki, S. Rahmann, and J. Stoye. On common intervals with errors. Forschungsberichte der Technischen Fakult¨at, Abteilungsinformation-stechnik/Uni. Bielefeld, report 2006-02, October 2006.
[4] S. Heber, R. Mayr, and J. Stoye. Common intervals of multiple permutations. Algorithmica, 60:175–206, 2011.
[5] K. Jahn. Efficient computation of approximate gene clusters based on reference occurrences. Lecture Notes in Computer Science, 6398/2011:264–277, 2011.
[6] X. Ling, X. He, and D. Xin. Detecting gene clusters under evolutionary constraint in a large number of genomes. Bioinformatics, 25(5):571–577, 2009.
[7] K. Makino and T. Uno. New algorithms for enumerating all maximal cliques. In Algorithm Theory - SWAT 2004, volume 3111 of Lecture Notes in Computer Science, pages 260–272. Springer Berlin / Heidelberg, 2004.
[8] T. J. Ottosen and J. Vomlel. Honour thy neighbour—clique maintenance in dynamic graphs. In proceedings of the Fifth EuropeanWorkshop on Probabilistic Graphical Models, 2010.
[9] R. Overbeek, M. Fonstein, M. D’Souza, G. D. Pusch, and N. Maltsev. The use of gene clusters to infer functional coupling. PNAS, 96(6):2896–2901, 1999.
[10] S. Penel, A. muriel Arigon, J. fran¸cois Dufayard, A. sophie Sertier, V. Daubin, L. Duret, M. Gouy, and G. Perri`ere. Databases of homologous gene families for comparative genomics. BMC Bioinformatics, 10, 2009.
[11] T. Schmidt and J. Stoye. Quadratic time algorithms for finding common intervals in two or more sequences. Proceedings of the 15th Annual Symposium on Combinatorial Pattern Matching, 2004.
[12] V. Stix. Finding all maximal cliques in dynamic graphs. Computational Optimization and Applications, 27(2):173–186, 2004.
[13] T. Uno and M. Yagiura. Fast algorithms to enumerate all common intervals of two permu-tations. Algorithmica, 26:2000, 2000.