Constitutive Equations and Failure Criteria
for Amorphous Polymeric Solids
by
BARKER
Brian Paul Gearing
MASSACHUSETTS INSTITUTEB.S. Mechanical Engineering
OFTEH-LGUniversity of Maryland at College Park, 1996
OCT 2 5 2002j
S.M. Mechanical Engineering
LIBRARIES
Massachusetts Institute of Technology, 1999
Submitted to the Department of Mechanical Engineering
in partial fulfillment of the requirements for the degree of
Doctor of Philosophy
at the
MASSACHUSETTS INSTITUTE OF TECHNOLOGY
September 2002
©
Brian Paul Gearing, MMII. All rights reserved.
The author hereby grants to MIT permission to reproduce and
distribute publicly paper and electronic copies of this thesis document
in whole or in part.
A uthor ...
....
t-Depa tment of MechanicM'Engineering
August 9, 2002
Certified by...
...--..
Lallit Anand
Professor of Mechanical Engineering
Thesis Supervisor
Accepted by...
.----.
Constitutive Equations and Failure Criteria
for Amorphous Polymeric Solids
by
Brian Paul Gearing
Submitted to the Department of Mechanical Engineering on August 9, 2002, in partial fulfillment of the
requirements for the degree of Doctor of Philosophy
Abstract
Anand & Gurtin (2002) have recently developed a continuum theory for the elastic-viscoplastic deformation of amorphous solids. Their theory is motivated by and builds on the work of Parks, Argon, Boyce, Arruda, and their co-workers (e.g. Boyce et al.,
1988; Arruda & Boyce, 1993) on modeling the plastic deformation of amorphous
polymers. The theory of Anand & Gurtin (2002) carefully accounts for restrictions placed on constitutive assumptions by frame-indifference and by a new mathematical definition of an amorphous material based on the notion that the constitutive relations for such materials should be invariant under all rotations of the reference configuration and, independently, all rotations of the relaxed configuration. Also, they explicitly account for the dependence of the Helmholtz free energy on the plastic deformation in a thermodynamically consistent manner, a dependence which leads directly to a backstress in the underlying flow rule. In addition to the standard kinematic and stress variables, their theory contains two internal variables: a variable s > 0 that
represents an isotropic intermolecular resistance to plastic flow; and an unsigned variable rq that represents the local free-volume.
In this thesis, we extend the work of Anand & Gurtin (2002) to model the de-formation and fracture response of amorphous glassy polymers which exhibit both a ductile mechanism of fracture associated with large plastic stretches and subsequent chain scission and a brittle mode of fracture. For polymers such as polycarbonate
(PC), the brittle fracture mode is characterized by a mechanism of elastic cavitational
failure, which results in cleavage-type fracture similar to that observed in brittle frac-ture of metals. In contrast, polymers such as polymethylmethacrylate (PMMA) and polystyrene (PS) exhibit a brittle mode of fracture characterized by craze initiation,
flow, and breakdown.
To model crazing, we introduce a continuum constitutive relation which contains the three ingredients of crazing - initiation, widening, and breakdown - in a suitable statistically-averaged sense. We allow for local inelastic deformation due to shear yielding in possible concurrence with that due to crazing, and introduce a craze initi-ation criterion based on the local maximum principal tensile stress reaching a critical
value which depends on the local mean normal stress. After crazing has initiated, our continuum model represents the transition from shear-flow to craze-flow by a change in the viscoplastic flow rule, in which the dilational inelastic deformation associated with craze-plasticity is taken to occur in the direction of the local maximum principal stress. Finally, for situations in which the local maximum tensile stress is positive, craze-breakdown and fracture is taken to occur when a local tensile plastic craze strain reaches a critical value. We apply our model to the techologically important polymer, polymethylmethacrylate. We show that the constitutive model and fracture criteria, when properly calibrated, are able to reasonably-well predict the macroscopic load-displacement curves, and local aspects of the craze-flow and fracture processes in (a) a thin plate with a circular hole under tension, and (b) notched-beams in four-point bending.
For amorphous glassy polymers which show ductile tearing and brittle cavitational fracture, as in the case of the fracture behavior of PC, we modify the model of Anand
& Gurtin (2002) for large elastic volume changes to accommodate the experimental
observation of the key role of the hydrostatic tension in the nucleation of internal cracks. To model fracture we introduce two simple local fracture criteria: (i) Brittle fracture is taken to occur when a local elastic volumetric strain reaches a failure value;
(ii) Ductile fracture will be taken to occur when a measure of the plastic stretch of
the polymer chains reaches a critical value. We show that the constitutive model and fracture criteria, when suitably calibrated, are able to quantitatively capture the notch-sensitive fracture response exhibited by notched-beams of polycarbonate in bending.
To further demonstrate the capabilities of the constitutive model, we study the micro-indentation behavior of PC and PMMA. Our work in this area builds upon the development of novel flexure-based apparatuses for mechanical testing at the small scale. Details of our nano- and micro-indentation apparatuses as well as a biaxial compression/shear apparatus are presented. We analyze Berkovich and conical micro-indentation and perform parametric studies with dimensional analysis to elucidate the key material parameters that determine the indentation response. Our study of the forward problem in indentation motivates a framework for the reverse problem in indentation of amorphous glassy polymers. We show that an applicaton of our proposed reverse approach is able to reasonably-well predict the macroscopic stress-strain behavior of polystyrene (PS) in simple compression.
Thesis Supervisor: Lallit Anand
Acknowledgments
First and foremost, I would like to express my sincere gratitude to Professor Lallit Anand for his support and guidance over the last six years. His demand of impeccable standards and fastidiousness for detail will continue to inspire me. I would also like to thank Professor Mary Boyce, Professor Mark Spearing, and Professor Subra Suresh for serving on my thesis committee.
Many thanks to Ray Hardin, Una Sheehan, Leslie Regan, and Joan Kravit for their support, which always far exceeded administrative details.
I would like to thank my research partners over the past years. To Sauri
Gudlaval-leti for our resonance in developing the small scale testing machines; I look forward to our future collaboration. To Cheng Su for his meticulous work on the polycarbonate beam bending experiments.
Infinite thanks to the Mechanics and Materials family here at MIT. To Nici Ames, Jeremy Levitan, Matt Busche, Chief Bass, Tom Arsenlis, Dora Tzianetopoulou, Ra-jdeep Sharma, Mats Danielsson, Ethan Parsons, Franco Capaldi, Cheng Su, Yujie Wei, Jin Yi, Yu Qiao, Hang Qi, Nuo Sheng, and Yin Yuan. Cheers to our future friendships.
To Prakash Thamburaja - thank you for being both a best friend as well as esteemed colleague. While I will miss our great times in Boston, I shall look forward to our friendship around the globe. May you always continue to be blessed by great karma.
Finally, I would like to thank my family for always supporting me through my academic endeavors and for always being there for me. My special thanks to Rose Zitelli for all of the prayers and support!
This research was supported by the Singapore-MIT Alliance and the DuPont-MIT Alliance.
Contents
1 Introduction 18
2 Deformation and fracture due to shear-yielding and crazing 22
2.1 Introduction . . . . 22
2.2 Constitutive equations for plastic deformation. Fracture criteria . . . 26
2.2.1 Modification of the constitutive equations for craze initiation, flow, and breakdown . . . . 31
2.3 Estimation of material parameters for PMMA . . . . 36
2.4 Investigation of predictive capabilities of the model . . . . 44
2.4.1 Tension of a thin plate with a circular hole . . . . 44
2.4.2 Notched-beam bending . . . . 45
2.5 Concluding remarks . . . . 48
3 Notch-sensitive fracture of polycarbonate 51 3.1 Introduction . . . . 51
3.2 Constitutive equations for plastic deformation. Fracture criteria . . . 54
3.2.1 Modification of the model for large elastic volume changes . . 58
3.3 Estimation of material parameters for PC . . . . 60
3.4 Investigation of predictive capabilities of the model . . . . 66
3.4.1 Compression experiments . . . . 66
3.4.2 Notched-beam bending . . . . 69
4 Micro-indentation of amorphous polymeric solids
4.1 Introduction . . . . 4.2 Constitutive model .... ...
4.2.1 Isotropic metallic materials . . . .
4.2.2 Amorphous polymeric materials . . . . 4.3 Experimental and numerical simulation of sharp-indentation
4.3.1 Indentation of A16061-T6 . . . . 4.3.2 Indentation of PC and PMMA . . . . 4.4 Param etric study . . . . 4.5 Guidelines for property extraction . . . . 4.6 Application to sharp-indentation of polystyrene . . . . 4.7 Concluding remarks . . . . References
A Function inverse to the Langevin function
B Guideline for model calibration
C Instrumented indentation apparatus
C.1 Microindentation apparatus ...
C.2 Nanoindentation apparatus . . . . D Biaxial compression/shear apparatus
E Vendor list F Figures G Tables 75 . . . . 75 . . . . 79 . . . . 79 . . . . 81 . . . . 84 . . . . 84 . . . . 88 . . . . 93 . . . . 96 . . . . 100 . . . . 103 104 110 111 114 114 117 119 124 126 240
List of Figures
F-1 Evolution of s, § and r with yP. . . . . 127
F-2 An idealization of craze plasticity where the macroscopic averaged ten-sile craze strain rate P is determined by the thickening rate 3 of crazes at an average spacing h. After Argon (1999), Figure 7. . . . . 128 F-3 Stress-strain response of PMMA in simple compression, together with
a fit of the constitutive model. . . . . 129 F-4 Plane strain tension of PMMA. True stress-strain responses for
spec-imens loaded to stress levels prior to the peak stress. Each test has been shifted horizontally in order to elucidate individual responses. The residual strain upon unloading is indicated above each curve. . . 130
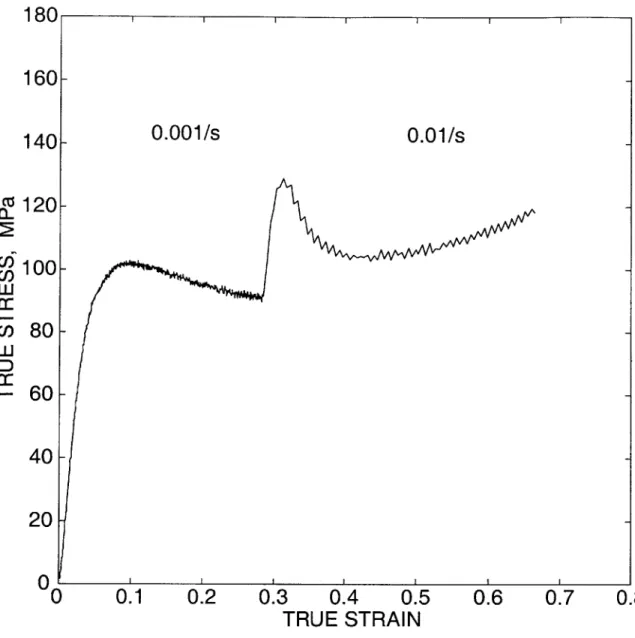
F-5 Strain rate increment experiment on PMMA in simple compression.
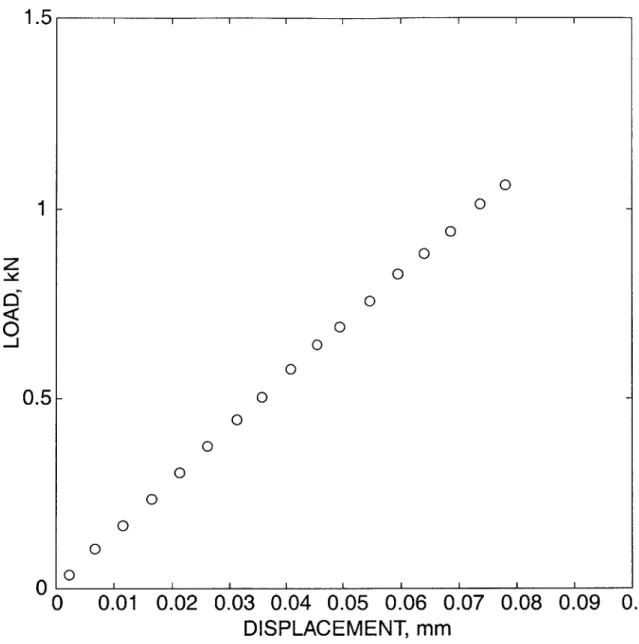
The strain rate of -0.001/s is increased to -0.01/s. . . . . 131 F-6 Experimental load-displacement curve for a smooth-bar tension
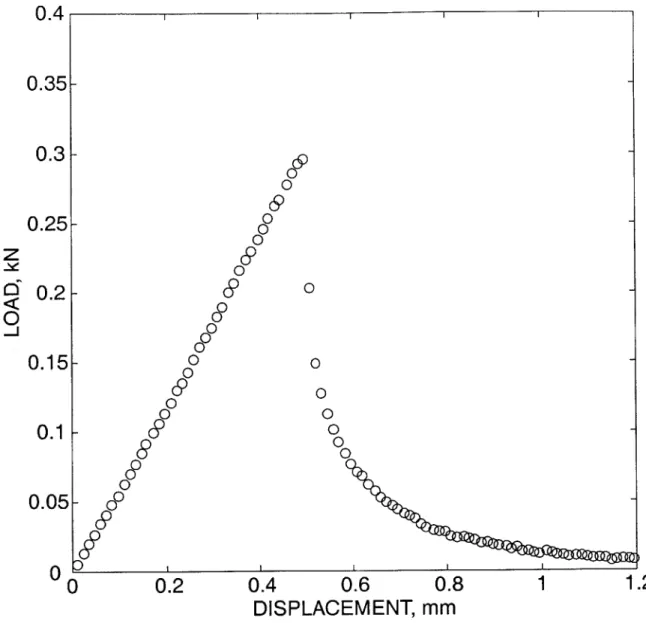
exper-im ent on PM M A. . . . . 132 F-7 Experimental load-displacement curve for a notched-bar tension
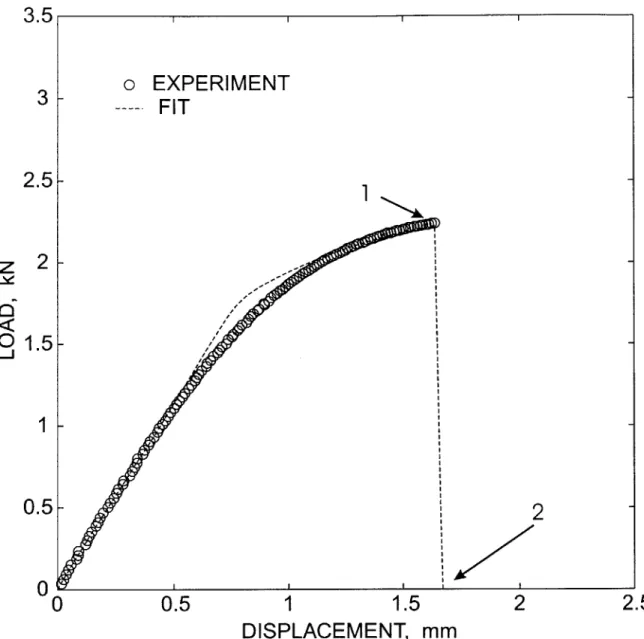
exper-im ent on PM M A. . . . . 133 F-8 Experimental load-displacement curve for an ASTM standard PMMA
compact tension specimen (without a sharp fatigue pre-crack). . . . . 134 F-9 Mesh design used to simulate the CTS experiment under mode I
load-ing conditions: (a) full mesh and (b) detail of fine mesh at the notch-root. 135
F-10 Fit of the craze-initiation criterion to the experimental data from
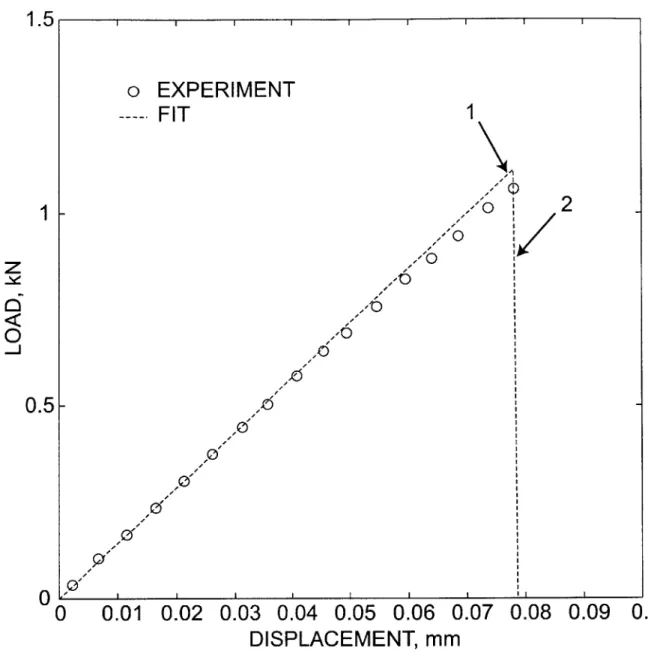
F-11 Experimental and calculated load-displacement curves for a smooth-bar tension specim en. . . . . 137
F-12 Contours of (a) a, and (b) o at incipient craze-flow, location 1 of Fig. F-11; (c) Mesh at location 2 of Fig. F-11 showing fracture. Note that fracture has occurred at multiple locations in the gauge section. 138 F-13 Experimental and calculated load-displacement curves for a
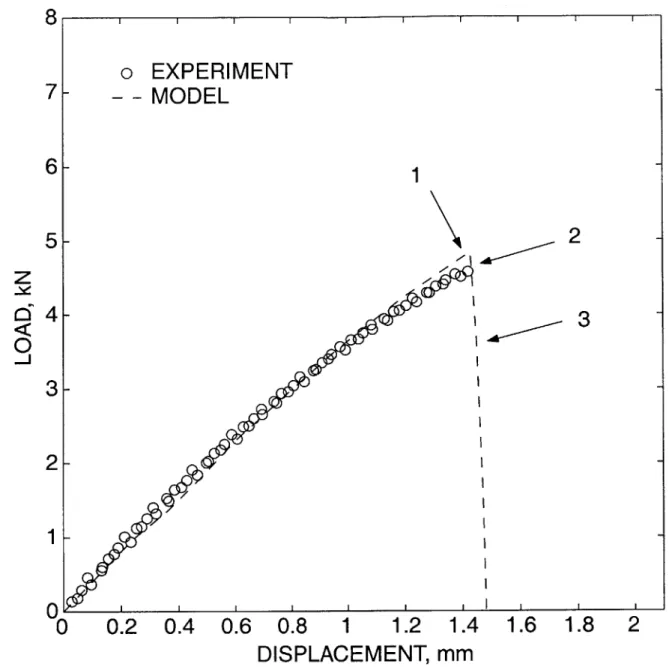
notched-bar tension specimen. . . . 139 F-14 Contours of (a) a1 and (b) a at incipient craze-flow, location 1 marked
in Fig. F-13. . . . . 140
F-15 Contours of (a) a1 and (b) a after craze-fracture has propagated part of the way into the cross-section, location 2 marked in Fig. F-13. . . . 141 F-16 Experimental and calculated load-displacement curves for a notched
compact tension specimen. . . . . 142
F-17 Contour plots of (a) a,, (b) a, and (c) 0P at incipient craze-flow, location 1 marked in Fig. F-16. For clarity of presentation, the contour plots
are focused on the region in the vicinity of the notch-root. . . . . 143
F-18 Contour plots of (a) a,, (b) o, and (c) EP after craze-fracture has
prop-agated part of the way into the cross-section, location 2 marked in Fig. F-16. For clarity of presentation, the contour plots are focused on the region in the vicinity of the notch-root. . . . . 144
F-19 Fit of the ductile failure criterion in plane strain compression: (a)
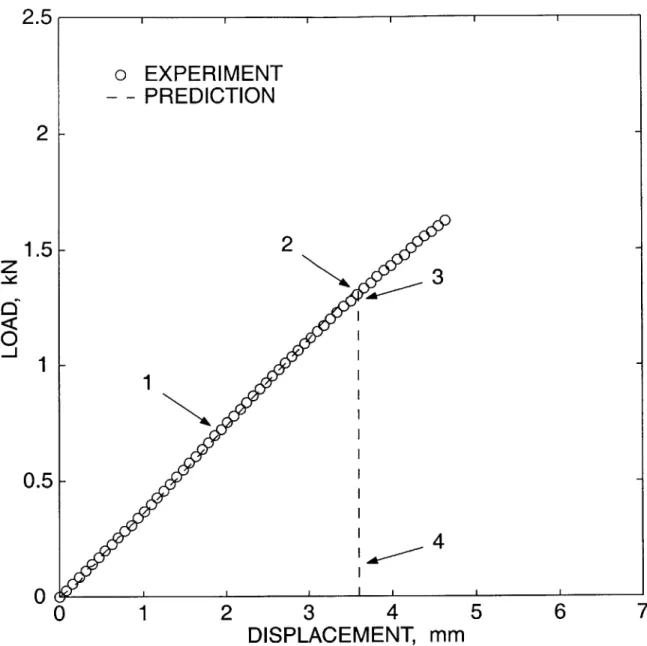
Load-displacement curve. (b) Contour plot showing values of AP at the point of ductile fracture. . . . . 145 F-20 Fracture of thin PMMA plates with circular windows; (a) Specimen
geometry with dimensions in mm. (b) Detail of the finite element mesh in the vicinity of the hole. . . . . 146 F-21 Fracture of thin PMMA plates with circular windows; comparison of
the experimentally-measured and numerically-predicted load-displacement curves. ... ... 147
F-22 (a) Image of fractured specimen showing crack-branching and fractured ligaments. Loading direction is vertical. (b) Result from corresponding num erical calculation . . . . 148
F-23 Contour plots of a, at (a) location 1, (b) location 2, and (c) location 3 indicated on the numerical curve in Fig. F-21. Loading direction is
in the vertical. . . . . 149 F-24 Contour plots of a at (a) location 1, (b) location 2, and (c) location 3
indicated on the numerical curve in Fig. F-21. Loading direction is in the vertical. . . . . 150 F-25 Comparison of the predicted load-displacement response for the
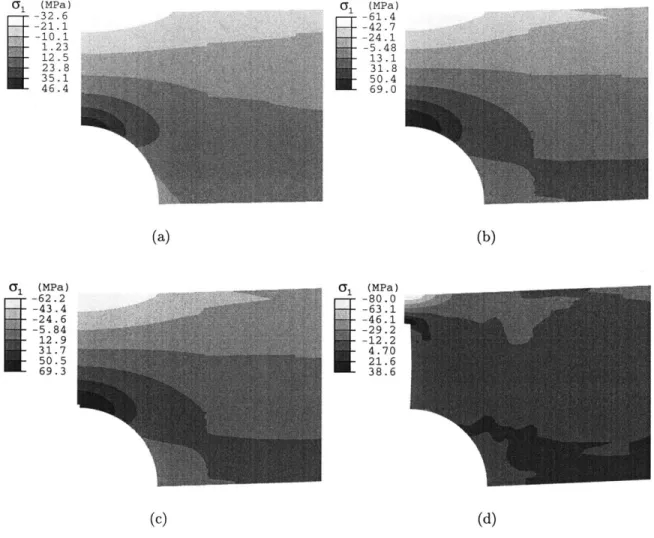
blunt-notched beam in bending against the experiment. . . . . 151 F-26 Prediction of the fracture process in blunt-notch beam bending.
Con-tour plots of o- corresponding to (a) location 1, (b) location 2, (c) location 3, and (d) location 4, as indicated on the predicted curve in Fig. F-25. Brittle fracture initiates at the notch-root as indicated in (c).152
F-27 Prediction of the fracture process in blunt-notch beam bending.
Con-tour plots of a corresponding to (a) location 1, (b) location 2, (c) location 3, and (d) location 4, as indicated on the predicted curve in Fig. F-25. Brittle fracture initiates at the notch-root as indicated in (c).153
F-28 Comparison of the predicted load-displacement response for the
sharp-notched beam in bending against the experiment. . . . . 154
F-29 Craze initiation criterion showing the location of experimental points
for the blunt and sharp-notched beam bending experiments. . . . . . 155 F-30 Four-point bending of a sharp-notched beam. Contour plots of a1 and
a at (a) location 1, and (b) location 2 indicated in Fig. F-28. Brittle
fracture occurs along the specimen centerline. . . . . 156 F-31 Functional relationship prescribed between the mean normal stress and
the elastic volumetric strain. The initial slope is the ground state bulk modulus K, and the cavitation fracture energy per unit volume is 1'c. 157 F-32 Stress-strain response for simple compression of PC. . . . . 158
F-33 Plane strain tension of PC. Engineering stress-strain response for a
specimen loaded through its peak load. . . . . 159
F-34 Plane strain tension of PC. True stress-strain responses for specimens loaded to stress levels prior to the peak stress. Each test has been shifted horizontally in order to elucidate individual responses. The residual strain upon unloading is indicated above each curve. . . . . . 160 F-35 Strain rate increment experiment on PC in simple compression. The
initial true strain rate of -0.001/s is increased to -0.01/s as indicated. 161 F-36 Detail of the stress-strain curve of Fig. F-35 showing the calculation
of the strain-rate sensitivity parameter m. The indicated construction line is extrapolated back to the strain at which the rate increment is im posed. . . . . 162 F-37 Fit of the constitutive model to the stress-strain response of PC in
sim ple com pression. . . . . 163 F-38 Fit of the ductile fracture criterion in simple tension; experimental and
numerical load-displacement curves. . . . . 164
F-39 Model fit of ductile fracture in uniaxial tension: Contour plots of
evo-lution of AP for locations (b) 1, (c) 2, and (d) 3 as indicated on the numerical curve in Fig. F-38 . . . . 165
F-40 Fit of the brittle fracture criterion in tension of a notched bar PC
specimen; experimental and numerical load-displacement curves. . . . 166
F-41 Fit of the brittle fracture criterion in tension of a notched-bar PC specimen; contour plots of o- at (a) location 1 and (b) location 2 as indicated in Fig. F-40. . . . . 167
F-42 Experimental stress-strain curves showing the reverse yield effect ob-served for PC in simple compression. . . . . 168
F-43 Numerically predicted stress-strain curves for the loading-unloading response of PC in simple compression. . . . . 169
F-44 Simple and plane strain compression experiments on PC with corre-sponding model results. . . . . 170
F-45 Load-displacement curves for plane strain compression experiments on
PC with corresponding model results. . . . . 171
F-46 Plane strain compression experiment "A" of Fig. F-45: (a) Experimen-tal specimen. (b) Numerically predicted specimen showing contours of
-yP for direct comparison with (a). . . . . 172
F-47 Plane strain compression experiment "B" of Fig. F-45: (a) Experimen-tal specimen. (b) Numerically predicted specimen showing contours of
-yP for direct comparison with (a). . . . . 173
F-48 Geometry of four-point bending experiments. All specimens have a 50 mm nominal width. . . . . 174 F-49 Load-displacement curve for four-point bending of a blunt-notched PC
beam . . . . . 175 F-50 Four-point bending of a blunt notched PC specimen: Micrographs of
unloaded specimen cross-sections are shown at: (a) location 1, (b) location 2, and (c) location 3 as indicated on the load-displacement curve in Fig. F-49. . . . . 176 F-51 Mesh used for four-point bending of the blunt-notched beam: (a) whole
mesh using half-symmetry. (b) detail of the mesh at the notch-root. . 177 F-52 Experimental and numerically predicted load-displacement curves for
four-point bending of a blunt-notched PC beam. . . . . 178 F-53 Prediction of the fracture process in blunt-notch beam bending.
Con-tour plots of AP corresponding to (a) location 1, (b)location 2, (c) location 3, and (d) location 4 as indicated on the predicted curve in Fig. F-52. Ductile failure initiates at the notch root as indicated in (c) and propagates into the beam as seen in (d). . . . . 179
F-54 Load-displacement curve for four-point bending of a sharp-notched PC
beam. The location indicated by "x" is the location of fracture. . . . 180
F-55 (a) Micrograph of unloaded specimen cross-section at incipient
frac-ture. The crack initiates at the apex of the plastic zone; (b) close-up of the crack at the apex of the plastic zone . . . . 181
F-56 Mesh used for four-point bending of the sharp-notched beam: (a) whole
mesh using half-symmetry. (b) detail of the mesh at the notch-root. . 182 F-57 Experimental and numerically predicted load-displacement curves for
four-point bending of a sharp-notched PC beam. . . . . 183 F-58 Prediction of the fracture process in sharp-notch beam bending.
Con-tour plots of a- corresponding to (a) location 1, (b) location 2, (c) location 3, and (d) location 4, as indicated on the predicted curve in Fig. F-57. Brittle fracture initiates ahead of the notch root as indicated in (b). . . .. ... . ... . ... . . . .. . . . . 184
F-59 Prediction of the fracture process in sharp-notch beam bending.
Con-tour plots of AP corresponding to (a) location 1, (b)location 2, (c) location 3, and (d) location 4 as indicated on the predicted curve in Fig. F-57. Ductile failure initiates at the notch root as indicated in (c) after brittle fracture initiates ahead of the notch. . . . . 185 F-60 Fit of the constitutive model for isotropic polycrystalline metals to
large deformation simple compression of A16061-T6. . . . . 186 F-61 Berkovich indentation of A16061-T6: (a) P-h curves with model
predic-tions. (b) Optical micrograph of residual indent morphology for test to 3.27 N. (c) Numerically predicted morphology for test to 3.27 N. 187 F-62 (a) Mesh design used for Berkovich indentation simulations; (b)
De-tailed view of area in direct contact with the indenter tip. (c) DeDe-tailed view of a coarse mesh design. The indenter is modeled using a rigid surface (not shown). . . . . 188
F-63 Comparison of experimentally-measured and numerically-predicted
in-dentation profiles corresponding to a maximum load of 3.27 N and 10pm depth, as well as a maximum load of 7.40 N and 15pm depth are shown. Each profile is shown in a plane which is perpendicular to one of the faces of the indent; the trace from the deepest point of the indent, up the indent and onto and along the surface being indented is shown. The baseline for the profile height is at 0 pm. Material:
A 16061-T 6 . . . . 189
F-64 Fit of the constitutive model to simple compression of (a) PC and (b) P M M A . . . . 190 F-65 Berkovich indentation of PC: (a) P-h curves with model predictions.
(b) Optical micrograph of residual indent morphology for test to 2.5 N.
(c) Numerically predicted morphology for test to 2.5 N. . . . . 191 F-66 Berkovich indentation of PMMA: (a) P-h curves with model
predic-tions. (b) Optical micrograph of residual indent morphology for test to 3.30 N. (c) Numerically predicted morphology for test to 3.30 N. 192 F-67 Model result compared with experimental data for Berkovich
inden-tation of PMMA with a dwell time of 300 s at a peak load of 2.40
N . . . . . 193 F-68 Model predictions of the loading curve for Berkovich indentation of
PMMA conducted at the three indicated loading rates. . . . . 194
F-69 Comparison of experimentally obtained P-h curves for PC using a
con-ical indenter versus a Berkovich indenter geometry. . . . . 195 F-70 Conical indentation with model predictions: (a) P-h curves for PC. (b)
P-h curves for PM MA. . . . . 196 F-71 Sensitivity of the P-h curves for indentation of PC to variations of
±10% in the included angle of the conical indenter. . . . . 197 F-72 (a) Contour plot of the equivalent plastic shear strain
fyP
at a peak loadof 2.80 N for conical indentation of PC. (b) Fit of an elastic-perfectly plastic model to simple compression of PC. . . . . 198
F-73 Prediction of conical indentation of PC using an elastic-perfectly
plas-tic rate-dependent model with pressure sensitive plasplas-tic flow: (a) P-h curves; (b) Residual indent profile focused on the region of material pile-up . . . . 199
F-74 Model predictions of the sensitivity of the P-h curve to variations in the pressure sensitivity parameter a. . . . . 200
F-75 Sensitivity of the P-h curves for conical indentation of PC to variations
of ±20% in (a) E and (b) so. . . . . 201
F-76 Unloading analysis for Berkovich indentation of PMMA: (a) Results
for a 205 mN peak load with a loading rate of 25 mN/s and various unloading rates. (b) Results for three peak load levels at equal loading and unloading rates. (c) P-h curves for a peak load of 2.80 N and three different loading and unloading rates. The values of E were calculated using the data given in Table I. . . . . 202
F-77 Berkovich indentation of PMMA with loading rate-jumps imposed from
stages 1 to 2 and from stages 3 to 4. Values of the calculated rate sensitivity parameter m are given for each rate-jump test . . . . 203 F-78 Berkovich and spherical indentation of PMMA with corresponding
model predictions of the loading curves. . . . 204
F-79 Berkovich indentation of polystyrene: (a) P-h curve used to estimate E from the initial unloading slope. (b) P-h curve with a rate-jump
imposed during the loading portion for the estimation of m and vo. (c) Fit to the loading curves of Berkovich and spherical indentation to estim ate so and a. . . . 205
F-80 Comparison of the experimentally obtained stress-strain curves in
sim-ple compression against the predicted responses based upon a reverse approach for sharp-indentation: (a) Monotonic loading at -0.001/s. (b) Strain-rate jump experiment. . . . . 206
F-81 Comparison of the numerical solution of L-- (AP/AL) to a series
ap-proximation using twenty-five terms. The comparison is shown for a
single element fit of our model to the stress-strain curve of PMMA in compression. The series approximation is within 1% of the numerical solution at a value of AP/AL = 0.99. . . . .
F-82 Stress-strain curves for simple compression of PC under monotonic
loading at -0.001/s and -0.01/s compared to a strain rate jump exper-iment from -0.001/s to -0.01/s .. . . . .
F-83 Detail of the stress-strain curve for the strain rate jump experiment in
Fig. F-82 showing the calculation of the strain rate sensitivity param-eter m. The indicated construction line is extrapolated back to the
strain at which the rate increment is imposed. . . F-84 Stress-strain curve for simple compression of PC
strain rate of -0.001/s. The material parameters indicated regions are displayed on the curve. . . . F-85 Sensitivity of the model stress-strain curve for PC F-86 Sensitivity of the model stress-strain curve for PC F-87 Sensitivity of the model stress-strain curve for PC F-88 Sensitivity of the model stress-strain curve for PC F-89 Sensitivity of the model stress-strain curve for PC F-90 Instrumented microindentation apparatus. The
mits the load from the voice coil to the sample to
. . . . 209
at a constant true that dominate the
to variations to variations to variations to variations to variations centerpiece" be indented. in b. in r7C. in go. in AR. in AL. trans-210 211 212 213 214 215 . . . . 216 F-91 Key dimensions of the microindenter. All radii are 4 mm. . . . . F-92 Calibration curve for the system spring stiffness of the microindenter. F-93 Calibration curve for the driving electronics of the microindenter. . .
F-94 Acquired displacement vs. output voltage during an indentation test.
F-95 P-h curves for indentation of fused silica at 5 mN/s. . . . . F-96 Exemplary P-h curves for indentation of a variety of materials loaded
at 50 m N /s. . . . .
F-97 Instrumented nanoindentation apparatus. . . . . 217 218 219 220 221 222 223 207 208
F-98 Key dimensions of the nanoindenter. All radii are 4 mm. . . . . 224
F-99 Calibration curve for the system spring stiffness of the nanoindenter. 225
F-100 Calibration curve for the driving electronics of the nanoindenter. . . 226
F-101 Berkovich indentation of fused silica; P-h curves obtained with the nanoindentation apparatus. . . . . 227
F-102 Berkovich indentation of fused silica; comparison of P-h curves for the microindentation and nanoindentation apparatuses. . . . . 228 F-103 Biaxial compression/shear apparatus. . . . . 229
F-104 Key dimensions of the biaxial compression/shear apparatus. . . . . . 230 F-105 Calibration curves for the spring stiffnesses of the normal and shear
axes of the biaxial compression/shear apparatus. . . . . 231 F-106 Frictional response of an A16111/tool steel interface at a normal force
of 1 N . . . . 232 F-107 Coefficient of friction for an A16111/tool steel interface at a normal
force of 1 N . . . . 233 F-108 Rate sensitivity of a dry PC/tool steel interface at a normal force of
750 m N . . . . 234
F-109 Frictional response of MEMS interfaces at a normal force of 2 N. . . 235
F-110 Coefficient of friction for MEMS interfaces at a normal force of 2 N. 236
F-111 Relative displacement for MEMS interfaces at a normal force of 2 N. 237
F-112 Scratch testing of PC using a conical indenter tip at 10 [m/s: (a) scratch morphology for a test conducted at a fixed normal force of 174 mN; (b) cross-section of the scratch . . . . 238 F-113 Scratch testing of PC using a conical indenter tip at 10 pm/s;
List of Tables
G.1 Experimental values used for the calculation of E from the P-h curves shown in Fig. F-76. The "Error" is calculated relative to the reference value of E = 3.11 GPa. . . . . 241
Chapter 1
Introduction
Anand & Gurtin (2002) have recently developed a continuum theory for the elastic-viscoplastic deformation of amorphous solids. Their theory is motivated by and builds on the work of Parks, Argon, Boyce, Arruda, and their co-workers (e.g. Boyce et al.,
1988; Arruda & Boyce, 1993) on modeling the plastic deformation of amorphous
polymers. The theory of Anand & Gurtin (2002) carefully accounts for restrictions placed on constitutive assumptions by frame-indifference and by a new mathematical definition of an amorphous material based on the notion that the constitutive relations for such materials should be invariant under all rotations of the reference configuration and, independently, all rotations of the relaxed configuration. Also, they explicitly account for the dependence of the Helmholtz free energy on the plastic deformation in a thermodynamically consistent manner, a dependence which leads directly to a backstress in the underlying flow rule. In addition to the standard kinematic and stress variables, their theory contains two internal variables: a variable s > 0 that represents an isotropic intermolecular resistance to plastic flow; and an unsigned variable r that represents the local free-volume.1
In this thesis, we extend the work of Anand & Gurtin (2002) to model the de-formation and fracture response of amorphous polymeric solids which exhibit both a
'It is commonly believed that the evolution of the local free-volume is the major reason for the
highly non-linear stress-strain behavior of glassy materials which precedes the yield-peak and gives
ductile mechanism of fracture associated with large plastic stretches and subsequent chain scission and a brittle mode of fracture which depends upon the class of polymer under consideration. For polymers such as polycarbonate (PC), the brittle fracture mode is characterized by a cavitational mechanism,2 which results in a cleavage-type
of fracture similar to that observed in brittle fracture of metals. In contrast, polymers such as polymethylmethacrylate (PMMA) and polystyrene (PS) are well-known to craze at room temperature in the absent of solvents.
To model crazing in amorphous polymeric solids, we introduce a continuum consti-tutive relation which contains the three ingredients of crazing - initiation, widening, and breakdown - in a suitable statistically-averaged sense. We allow for local inelastic deformation due to shear yielding in possible concurrence with that due to crazing, and introduce a craze initiation criterion based on the local maximum principal tensile stress reaching a critical value which depends on the local mean normal stress. After crazing has initiated, our continuum model represents the transition from shear-flow to craze-flow by a change in the viscoplastic flow rule, in which the dilational inelastic deformation associated with craze-plasticity is taken to occur in the direction of the local maximum principal stress. Finally, for situations in which the local maximum tensile stress is positive, craze-breakdown and fracture is taken to occur when a local tensile plastic craze strain reaches a critical value. We have calibrated the consti-tutive parameters in our model for PMMA under normal dry conditions. We show that our model, when suitably calibrated and implemented, is able to reasonably-well predict the macroscopic load-displacement curves, and local aspects of the craze-flow and fracture processes in (a) a thin plate with a circular hole under tension, and (b) notched beams in four-point bending.
For amorphous polymeric solids which exhibit ductile tearing and brittle cavita-tional fracture, similar to the fracture behavior of PC, we modify the model of Anand
& Gurtin (2002) to account for large elastic volume changes to accommodate the
experimental observation of the key role of the hydrostatic tension in the nucleation of internal cracks. To model the fracture we introduce two simple local fracture:
(i) Brittle fracture is taken to occur when a local elastic volumetric strain reaches
a failure value; (ii) Ductile fracture will be taken to occur when a measure of the plastic stretch of the polymer chains reaches a critical value. We show that our the-ory, when suitably implemented and calibrated, is able to quantitatively predict the experimentally-observed ductile failure response of blunt-notched beams, as well as the competition between the brittle and ductile mechanisms in more sharply-notched beams of polycarbonate in bending.
Our fracture experiments on PC and PMMA are concerned with applications when specimens dimensions are on the order of mm and loads are in the range of kN. As a final application for this thesis, we consider experimentation and constitutive model-ing when dimensions of the specimens are on the order of nm to Pm with forces in the
pN to N range. We present novel flexure-based apparatuses for mechanical testing at
the small scale. As an application for our newly developed experimental capabilities, we investigate the forward problem in indentation of amorphous polymeric solids, with specific application to PC and PMMA. After demonstrating the applicability of the constitutive model for predicting the indent morphologies and load-displacement, or P-h curves, we elucidate through a parametric study and dimensional analysis the key material parameters that determine the indentation response. The results of our study of the forward approach, parametric studies, and dimensional analysis motivate a framework for the reverse problem in indentation of amorphous polymeric solids. We propose a first attempt at the reverse approach by extracting material parameters for polystyrene (PS) from Berkovich indentation experiments and com-paring the predicted stress-strain curves against the experimental results in simple compression under monotonic loading and loading with an imposed strain-rate jump. The predicted stress-strain responses are found to be in reasonable accord with the macroscopic stress-strain curves for PS.
The plan of the thesis is as follows. In Chapter 2, we present our constitutive model for the deformation and fracture response of glassy polymers due to shear-yielding and crazing. We demonstrate the determination of material parameters for PMMA and show our predictions of the deformation and fracture response of thin plates with
circular windows and notched-beams in four-point bending. Chapter 3 presents the constitutive equations proposed to model the deformation and fracture response of materials undergoing elastic cavitational failure. The model is utilized to capture the notch-sensitive fracture behavior of PC observed in four-point bending experiments on blunt and sharp-notched beams. Chapter 4 details our study of the forward and reverse problem in indentation of amorphous polymeric solids, which draws upon the experimental capabilities for mechanical testing at the small scale. The novel testing apparatuses - flexure-based designs for a microindenter, nanoindenter, and biaxial compression/shear apparatus - are presented in the Appendices. We note that each chapter has been composed as separate papers to allow for self-contained reading, therefore some redundancy in the presentation exists.
Chapter 2
Deformation and fracture due to
shear-yielding and crazing
2.1
Introduction
Under stress states where the maximum principal stress is compressive, amorphous glassy polymers typically show extensive plastic deformation by a "shear yielding" mechanism which involves profuse densely-packed microscopic shear bands; the ma-terial shows substantial ductility, and eventual fracture occurs at large stretches by a chain-scission mechanism. In contrast, under stress states where the maximum prin-cipal stress is tensile, glassy polymers may at first show a little (or no) macroscopic inelastic deformation due to shear yielding, but then the mechanism of inelastic de-formation switches to "crazing". An individual craze is a thin plate-like microscopic region in the material with a microstructure distinguished by a dense array of fib-rils (interspersed with elongated voids) which span the boundaries of the individual crazes. The plate boundaries of the crazes are typically oriented perpendicular to the maximum principal stress direction, and the dominant inelastic deformation occurs
by craze widening in the local maximum principal stress direction. Macroscopically,
however, the material shows little ductility, and the nominally brittle fracture occurs
by craze breakdown, crack-formation and crack-growth to failure. In most high
polymethyl-methacrylate (PMMA),1 fracture under stress states where the maximum principal stress is tensile, is preceded by this craze initiation, widening, and breakdown process (cf., e.g., Kambour, 1973; Kramer, 1983).
A significant advance in modeling the plastic deformation of amorphous
poly-mers by shear-yielding has been made by Parks, Argon, Boyce, Arruda, and their co-workers (e.g. Park et al., 1985; Boyce et al., 1988; Arruda & Boyce, 1993), and by Wu & Van der Giessen (1993); more recently, Anand & Gurtin (2002) have reformu-lated the theory within a rigorous thermodynamic framework. In contrast, although the phenomenon of crazing has been widely studied over the past four decades, and considerable understanding of the micro-mechanisms of crazing and cracking in amor-phous polymers has been developed (cf., e.g., Kambour, 1973; Amdres, 1973; Argon
& Hannoosh, 1977; Kramer, 1983; Narisawa & Yee, 1993; Donald, 1997.), the
incorpo-ration of this understanding into an engineering tool for the quantitative prediction of the deformation and fracture response of glassy polymers is just beginning to emerge
(e.g., Estevez et al., 2000; Tijssens et al., 2000a; Tijssens et al., 2000b; Socrate et al., 2001).
Most studies on fracture of glassy polymers are based on the standard framework of linear elastic fracture mechanics (e.g. Kinloch & Young, 1983; Williams, 1984). However, as noted by Estevez et al. (2000), this approach ignores the process of initi-ation, widening and breakdown of crazes, and cannot be used when shear yielding of the material may be occurring at other locations in the body, especially when there are no initial sharp cracks in the body. Classical fracture mechanics cannot deal with crack nucleation, and the numerical simulation of crack propagation has also been a challenge for this classical theory. The recent work of Van der Giessen and co-workers (Estevez et al., 2000; Tijssens et al., 2000a; Tijssens et al., 2000b) and Socrate et al. (2001) is based on "cohesive surface" modeling of craze initiation, growth and break-down.2 Cohesive surface modeling of fracture started more than 40 years ago with
'But not polycarbonate, which does not craze under normal circumstances in the absence of solvents.
the work of Barenblatt (1959) and Dugdale (1960). In recent years, cohesive surface models have been widely used to numerically simulate fracture initiation and growth
by the finite-element method (e.g., Xu & Needleman, 1994; Camacho & Ortiz, 1996).
Typically, a set of cohesive surfaces are introduced in the finite element discretization
by the use of special interface elements which obey a non-linear interface
traction-separation constitutive relation which provides a phenomenological description for the complex microscopic processes that lead to the formation of new traction-free crack faces. The loss of cohesion, and thus crack nucleation and extension occurs
by the progressive decay of interface tractions. The interface traction-separation
re-lation usually includes a cohesive strength and cohesive work-to-fracture. Once the local strength and work-to-fracture criteria across an interface are met, decohesion occurs naturally across the interface, and traction-free cracks form and propagate along element boundaries. An important characteristic of this methodology for mod-eling fracture initiation and propagation is that macroscopic fracture criteria, based on elastic or elastic-plastic analyses, such as K, = K1C or J, = J1C, are not needed, because material strength and toughness, and crack nucleation and propagation are all characterized by the local traction-separation relation and the cohesive surface methodology.3 Of special note is that the interface constitutive model used by Van
der Giessen and co-workers (Estevez et al., 2000; Tijssens et al., 2000a; Tijssens et al., 2000b) is an elastic-viscoplastic traction-separation relation which accounts for the three separate stages of craze initiation, widening, and breakdown. While Van der Giessen and co-workers have produced informative two-dimensional parametric numerical studies on craze initiation, crack formation and crack growth around
circu-3There are still at least two key issues that need to be addressed in the cohesive surface modeling
of fracture: (a) While it is relatively straightforward to construct a traction-separation relation for normal separation across an interface to model mode I conditions, elastic-plastic traction-separation relations for combined opening and sliding, together with the experimental methods needed to determine the parameters that might enter such coupled interface constitutive relations, are not well-developed, even for two-dimensional problems, and this issue is expected to be substantially more complicated in three dimensions. (b) The cohesive interface approach numerically restrains the orientation of crack nucleation and propagation. Once a finite element mesh is chosen, the crack can only nucleate and grow along the element boundaries. In the case of crazing, the initial element boundaries may not be aligned perpendicular to the evolving local maximum principal stress direction.
lar holes in plates under far-field tension, and in cracked plates under mode I loading conditions, much work remains to be done to correlate their parametric studies with actual experimental results, and to develop a truly predictive numerical capability for engineering design.
The purpose of the present chapter is to present an alternative approach to
model-ing the competition between shear-yieldmodel-ing and crazmodel-ing, and to develop the framework of an engineering tool for the quantitative prediction of the deformation and fracture response of glassy polymers. Instead of attempting to represent each individual craze
with an interface element, we will use a continuum constitutive relation which con-tains the three ingredients of crazing - initiation, widening, and breakdown - in a suitable statistically-averaged sense. Our model shall not account for the typical fine microstructural details of crazing; instead, for the continuum level of interest here, the inelastic deformation due to crazing will be defined as an average over a microstructural representative volume element that contains enough plate-like craze regions to result in an acceptably smooth process at the macroscopic level (prior to fracture). We will allow for local inleastic deformation due to shear yielding in pos-sible concurrence with that due to crazing, and introduce a simple craze initiation criterion based on the local maximum principal tensile stress reaching a critical value which depends on the local mean normal stress. After crazing has initiated, our con-tinuum model will represent the transition from shear-flow to craze-flow by a change in the viscoplastic flow rule, in which the dilational inelastic deformation associated with craze-plasticity will be taken to occur in the direction of the local maximum principal stress.4 Finally, in order to model fracture we shall adopt a simple rule: for situations in which the local maximum tensile stress is positive, fracture will be taken to occur when a local tensile plastic craze strain reaches a critical value.
We have implemented our constitutive model in the finite-element computer pro-gram ABAQUS/Explicit (ABAQUS, 2001) by writing a user material subroutine.
4
By incorporating such a constitutive model which allows for a local switch in the flow rule from
shear-flow to craze-flow, we avoid a priori assumptions concerning the orientation and location of interface elements for crazing, assumptions which are inherent in the cohesive interface approach.
This finite-element program permits the modeling of failure, when user-specified crit-ical values of certain parameters are reached, by an element-removal technique. By employing an appropriately dense (but computationally efficient) finite element mesh, we shall show that it is possible to predict, with reasonable quantitative accuracy, the major features of the macroscopic deformation and fracture behavior of components made from glassy polymers which craze.
In particular, we shall demonstrate that our model, when suitably implemented and calibrated against a suite of experiments to determine the constitutive parameters in the model for PMMA, is able to reasonably-well predict the macroscopic load-displacement curves, and local aspects of the craze-flow and fracture processes in (a) a thin plate with a circular hole under tension, and (b) notched beams in four-point bending, made from this important glassy polymer.
The plan of the chapter is as follows. In Section 2.2 we develop our constitutive model. In Section 2.3 we describe our experiments to calibrate the material param-eters in the model for PMMA; we limit our study to experiments performed under normal dry conditions. In Section 2.4 we verify the predictive capabilities of our constitutive model and computational procedures for the deformation and fracture response of notched components made from PMMA. We close in Section 2.5 with some final remarks.
2.2
Constitutive equations for plastic deformation.
Fracture criteria
In this section we begin by summarizing the constitutive model for plastic deformation of amorphous polymeric materials by the shear-yielding mechanism (Anand & Gurtin, 2002). The (isothermal) model is based on the mutliplicative decomposition, F =
FeFP, of the deformation gradient F into elastic and plastic parts, Fe and FP (Kroner,
1960; Lee, 1969).5 The theory also contains two internal variables: a variable s > 0
5
Notation: V and Div denote the gradient and divergence with respect to the material point X in the reference configuration; grad and div denote these operators with respect to the point
that represents an isotropic intermolecular resistance to plastic flow; and an unsigned variable r7 that represents the local free-volume.6 Then, in terms of the variables
Helmholtz free energy per unit volume of the relaxed configuration,
T, T = TT, Cauchy stress,
F, detF > 0,
FP, det FP = 1,
s, s > 0,
and the definitions
deformation gradient,
plastic part of the deformation gradient, isotropic resistance to plastic flow, free-volume, Fe = FFP- 1, det Fe > 0, Ce = FeTFe, E' = i (C e - , T e = ReTTRe, a- = 1trT, T = T -
-elastic deformation gradient, elastic right Cauchy-Green strain, elastic strain,
stress conjugate to the elastic strain Ee,
mean normal stress, deviatoric stress,
left Cauchy-Green tensor corresponding to FP,
B= BP - }(trBP)1,
AP= ftrBP,
DP= sym(FPFP-1), trDP = 0,
deviatoric part of BP, effective plastic stretch, plastic stretching,
the constitutive equations, under the approximative assumption of small elastic stretches, are:
x = y(X, t) in the deformed configuration, where y(X, t) is the motion; a superposed dot denotes
the material time-derivative. Throughout, we write F- 1 = (Fe)-1, FP-T = (FP) T, etc. We write symA, skwA, respectively, for the symmetric, and skew parts of a tensor A. Also, the inner product of tensors A and B is denoted by A -B, and the magnitude of A by JAI = v/A A.
'It is commonly believed that the evolution of the local free-volume is the major reason for the
highly non-linear stress-strain behavior of glassy materials, which precedes the yield-peak and gives
BP = FPFPT
1. Free Energy:
The Helmholtz free energy is taken in the noninteractive form
V) = V)e(Ee) + OP(AP), (2.1)
where 0e is an elastic free energy, and OP a plastic free energy. The elastic free energy is taken in the standard form for small elastic stretches
e = GIE e0 2 + -K~trEe12, (2.2)
2
where G and K are the elastic shear and bulk moduli, respectively. In amor-phous polymeric materials the major part of OP arises from an "entropic" con-tribution, and motivated by statistical mechanics models of rubber elasticity,7 is taken in the specific form
=RAL2 LIAL)
AP
x+ln( smnhx X y-ln( Y) (2.3)AL smnhy
x = L-1 P y =L 1
,
(2.4)where L-1 is the inverse' of the Langevin function L(...) = coth(... .)( . This functional form for OP involves two material parameters: PR, called the rubbery modulus, and AL, called the network locking stretch.
2. Equation for the stress:
Te 2GEe + K(trEe)1. (2.5)
DEe
7
Cf., Treloar, 1975; Arruda & Boyce, 1993; Anand, 1996.
8To evaluate x = - (y) for a given y in the range 0 < y < 1, we numerically solve the non-linear
equation f(x) = L(x) - y = 0 for x. For numerically intensive calculations we approximate the Langevin-inverse by the first 26 terms of its Taylor series expansion; see Appendix A.
3. Equation for back stress:9 Sback = 2symo
(
OBPBP = pBp, with 1 OOP AL 3APOAP 3AP/ (2.6) (2.7) -1 AP (AL)The back stress modulus p -+ oo as AP -+ AL, since [-1(z) -+ oc as z -+1.
4. Flow rule:
The evolution equation for FP is
FF = DPFP, FP(X, 0) = 1, (2.8)
with DP given by the flow rule
=
IT'
- SbackI,VP = VO , 0
< m < 1,
and vP = vIDP 1,
are an equivalent shear stress and equivalent plastic shear strain-rate, respec-tively. Here, vo is a reference plastic shear strain-rate, a a pressure sensitivity parameter, and m a strain-rate sensitivity parameter. The limit m -+ 0 ren-ders (4.4) rate-independent, while m = 1 renren-ders (4.4) linearly viscous. The
equivalent plastic shear strain, -yP, is defined by -yP = fvP dt > 0. 5. Evolution equations for the internal variables s and r:
The evolution of s and r/ is taken to be governed by the coupled differential
DP=(T - Sback) 2r where (2.9) (2.10) 9
equations1 0 = ho - ) VP, = o -- ) vP, SC,
)
s(X, 0) = so, 7(X, 0) = 0, §(rq) = scv[1 + b(77cv - 7)], (2.12)where {ho, go, so, sc,, b, 77cx} are additional material parameters. Here s = §(q)
is a saturation value of s: e is positive for s < § and negative for s > 9. By
definition vP is nonnegative. Assuming that vP > 0, all solutions to the pair of evolution equations satisfy
s -* sc, and rj a Tcv as t - oo.
We restrict attention to the initial conditions s = so with
so
<
s < scV(1 + b277e).Also, as is tacit from (3.11)2, the free-volume is measured from the value r = 0
in the virgin state of the material, and thus r at any other time represents a change in the free-volume from the initial state. Figure F-i shows the evolution
of s, 9 and r with -yP. We shall say that the flow has become "fully-developed"
when 77 -+ q7cv and s -+ sc.
10We expect that (and perhaps ho and go) may, in general, depend on vP, but currently there is
insufficient experimental evidence to warrant such a refinement.
with
2.2.1
Modification of the constitutive equations for craze
ini-tiation, flow, and breakdown
The overall inelastic deformation due to craze initiation and growth is always inhomo-geneous at the microstructural length scales associated with crazing. We emphasize that our model shall not account for the typical fine microstructural details of crazing. The spatially continuous fields that define our theory are to be considered as averages meant to apply at length scales which are large compared to those associated with the fine structure of the crazes and their distribution in a representative volume ele-ment. That is, for the continuum level of interest here, the inelastic deformation due to crazing will be defined as an average over a microstructural representative volume element (the material neighborhood of a continuum material point X) that contains enough plate-like craze regions to result in an acceptably smooth process.
What constitutes an appropriate model for craze initiation is probably the least well-agreed-upon ingredient of the overall modeling of crazing in the literature. Argon and coworkers (e.g., Argon & Hannoosh, 1977; Argon et al., 1977) have emphasized that stress-based criteria governing initiation are hard to determine with precision from experiments because of the importance of imperfections in controlling the local stress states and the sites of craze initiation. In tension-torsion, stress-controlled ex-periments on thin-walled tubular specimens with controlled micro-roughness, these authors observed that at stress levels where the equivalent shear stress, f = VT0
7
T0,and mean normal stress, -, were below ~ 0.5 of the yield strength Y of the material (due to shear-yielding), there was a time delay between the application of stress, and the first appearance of crazing. Their experiments showed that the delay time for craze initiation decreases with increasing values of equivalent shear stress or mean normal stress, and becomes negligible at stress levels greater than ~ 0.5 of the yield strength of the material. Under these circumstances, craze-initiation may be con-sidered an instantaneous event when a suitable local critical stress state is reached. Since we are concerned with the competition between shear-yielding and crazing, and eventually craze-breakdown and fracture, which typically occurs at stress levels higher
than ~ 0.5 of the yield strength, we will ignore considerations of incubation times,
and adopt a simple time-independent stress-based criterion for craze initiation. In
this time-independent limit, Argon & Hannoosh (1977) have suggested that under situations in which the local mean normal stress is positive, a- > 0, crazes initiate when the local equivalent shear stress reaches a mean normal stress-dependent critical value (their equation (22)):
A Y
T = icr(U) > 0, with er ((-) = Y (2.13)
C + 3u-/2Y
Q
Here
Q
= 0.0133 is a fixed factor controlling the dependence ,cr on the mean normalstress a-, and (A, C) are temperature-dependent material constants. Although, Argon and co-workers have suggested (2.13) as the time-independent limiting form of their detailed micro-mechanical time-dependent model," this criterion does not reveal that at an instant when crazes might be considered to have initiated in a macroscopic
sense, they are typically oriented perpendicular to the maximum principal tensile
stress direction.
The earliest stress-based craze initiation criterion is due to Sternstein and co-workers (e.g., Sternstein & Ongchin, 1969; Sternstein & Meyers, 1973). Based on biaxial plane-stress (a3 = 0) experiments on PMMA plates with circular holes, they
postulated that the critical condition for craze nucleation is when a "stress bias" UB
reaches a critical value
oB= A + B, (2.14)
o-where A and B are temperature-dependent material parameters. Under plane stress
"They modeled craze-initiation by postulating: (i) the formation of microcavities by the arrest of intense localized plastic flow at a molecular scale, with the rate at which such microcavities form depending on the local equivalent shear stress; (ii) the growth of these microcavities by plastic expansion into spongy craze nuclei, with the rate at which the microcavities grow depending on the local equivalent shear stress and the mean normal stress; (iii) the subsequent growth of the spongy craze nucleus by a meniscus instability mechanism, to initiate a macroscopic craze. Based on this micro-mechanical model they developed an expression which provides an estimate for the time to initiate a craze under a given stress state.
conditions with o3 = 0, they defined the stress bias by UB = uI - C21. This quantity is the difference between the maximum and intermediate principal stresses when a, and c2 are positive; however, it becomes the difference between the maximum and the minimum principal stress when either a, or 92 is compressive. Thus, as noted
by Oxborough & Bowden (1973), the physical interpretation of UB is unclear, nor is it clear how to evaluate UB for a general triaxial stress state. A further difficulty with this criterion is that while lOi - U2 represents an in-plane shear stress intensity,
the crazes actually nucleate and grow in the direction of the maximum principal tensile stress. Noting this difficulty, Oxborough & Bowden (1973), based on their own experiments on PS, found that their experimental data for craze initiation was better fit to a criterion in which the maximum principal tensile strain 61 reaches a critical value which depends on the mean normal stress a:
= i,cr(o) > 0, with Ei,cr = + Y', (2.15) where X' and Y' are temperature-dependent parameters. Since i = {1 1 - v(U2 + 93)} /E
for an isotropic elastic material, with (E, v) the usual Young's modulus and Poisson's ratio, this criterion may be written as
X
Ol - V(92 + U-3) = -
+ Y,
(2.16)where X = E X' and Y = E Y'. For plane stress this equation is very similar to the
criterion (2.14) proposed by Sternstein & Ongchin (1969).
The craze initiation criterion (2.16) of Oxborough & Bowden may be further rearranged as a criterion in stress space, wherein craze initiation may be taken to occur when the maximum principal stress a, reaches a critical value which depends on the mean normal stress a:
0I = ai,cr(a) > 0, with Oi,cr(a) = c1 + + c3 a, (2.17)