HAL Id: cea-01596241
https://hal-cea.archives-ouvertes.fr/cea-01596241
Submitted on 27 Sep 2017HAL is a multi-disciplinary open access archive for the deposit and dissemination of sci-entific research documents, whether they are pub-lished or not. The documents may come from teaching and research institutions in France or abroad, or from public or private research centers.
L’archive ouverte pluridisciplinaire HAL, est destinée au dépôt et à la diffusion de documents scientifiques de niveau recherche, publiés ou non, émanant des établissements d’enseignement et de recherche français ou étrangers, des laboratoires publics ou privés.
Recent progress to understand stress corrosion cracking
in sodium borosilicate glasses: linking the chemical
composition to structural, physical and fracture
properties
Cindy Rountree
To cite this version:
Cindy Rountree. Recent progress to understand stress corrosion cracking in sodium borosilicate glasses: linking the chemical composition to structural, physical and fracture properties. Journal of Physics D: Applied Physics, IOP Publishing, 2017, 50, pp. 343002. �10.1088/1361-6463/aa7a8b�. �cea-01596241�
TOPICAL REVIEW
Recent progress to understand stress corrosion
cracking in sodium borosilicate glasses: linking the
chemical composition to structural, physical and
fracture properties
To cite this article: Cindy L Rountree 2017 J. Phys. D: Appl. Phys. 50 343002
View the article online for updates and enhancements.
Related content
Stress-corrosion mechanisms in silicate glasses
Matteo Ciccotti
-Indentation-based methods to assess fracture toughness for thin coatings Jinju Chen
-The mechanical and strength properties of diamond
J E Field
-Journal of Physics D: Applied Physics
C L Rountree
Recent progress to understand stress corrosion cracking in sodium borosilicate glasses: linking the chemical composition to structural, physical and fracture properties Printed in the UK 343002 JPAPBE © 2017 IOP Publishing Ltd 50
J. Phys. D: Appl. Phys.
JPD
10.1088/1361-6463/aa7a8b
34
Journal of Physics D: Applied Physics
1. Introduction
Oxide glasses are among the oldest industrial materials known to man, and they are widely used due to their advanta-geous properties: transparency, low thermal expansion, high melting point temperature, relative inertness, etc. Yet, oxide glasses are not without significant shortcomings. In par ticular, they remain inherently brittle, despite significant scientific
ingenuity to overcome this drawback. Moreover, they undergo abrupt catastrophic failure. Frequently, post-mortem failure studies reveal material flaws which were propagating via stress corrosion cracking. Understanding and predicting the growth of such flaws under sub-critical crack propagation remains a hurdle for scientists. Furthermore, how the basic glass network (i.e. the interconnect of the glass structure) dic-tates the physical, mechanical and stress corrosion cracking
Recent progress to understand stress
corrosion cracking in sodium borosilicate
glasses: linking the chemical composition
to structural, physical and fracture
properties
Cindy L Rountree
SPEC, CEA, CNRS, Université Paris-Saclay, CEA Saclay 91191 Gif-sur-Yvette, France
E-mail: [email protected]
Received 27 March 2017
Accepted for publication 14 June 2017 Published 2 August 2017
Abstract
This topical review is dedicated to understanding stress corrosion cracking in oxide glasses and specifically the SiO2 B2O3 Na2O (SBN) ternary glass systems. Many review papers already exist on the topic of stress corrosion cracking in complex oxide glasses or overly simplified glasses (pure silica). These papers look at how systematically controlling
environmental factors (pH, temperature...) alter stress corrosion cracking, while maintaining the same type of glass sample. Many questions still exist, including: What sets the
environmental limit? What sets the velocity versus stress intensity factor in the slow stress corrosion regime (Region I)? Can researchers optimize these two effects to enhance a glass’ resistance to failure? To help answer these questions, this review takes a different approach. It looks at how systemically controlling the glass’ chemical composition alters the structure and physical properties. These changes are then compared and contrasted to the fracture toughness and the stress corrosion cracking properties. By taking this holistic approach, researchers can begin to understand the controlling factors in stress corrosion cracking and how to optimize glasses via the initial chemical composition.
Keywords: Sodium borosilicate glasses, Microstructure, stress corrosion cracking, physical properties, fracture properties, SiO2 B2O3 Na2O
(Some figures may appear in colour only in the online journal)
Topical Review
IOP2017
1361-6463
https://doi.org/10.1088/1361-6463/aa7a8b
properties remains a mystery. This review is a compilation of recent developments in the study of oxide glasses with a con-centration on SiO2 B2O3 Na2O (SBN) glasses, and it looks into the future with suggestions for fruitful areas of research.
Stress corrosion cracking (SCC) concerns the sub-critical growth of a crack front and occurs when environmental corro-sive agents attack the crack front, thus causing it to propagate [1, 2]. Previous literature and reviews [1–12] address stress corrosion cracking of industrial materials, including oxide glasses. These works approach the problem from the macro-scopic scale. Three characteristic regimes of velocity (v) ver-sus the stress intensity factor (K) exist [1, 2]. A potential forth regime exists, but its existence depends on the glass chemical composition [1, 2]. Research works relate key features in v versus K curves to environmental parameters, e.g. temper-ature (T), humidity, and pH. The glasses incorporated in these studies routinely contain four or more oxides. Thus, they are far too complex to identify fundamental structural units and to develop a first principles understanding of stress corrosion induced crack propagation. Additionally, these studies do not systematically alter the chemical composition which makes it all the more difficult to link the glass chemical composition to the physical properties and the complex stress corrosion cracking behaviors.
This review builds on these previous studies by taking a holistic vantage point of stress corrosion cracking in oxide glasses. In other words, it looks at how systematically altering the chemical composition leads to changes in the structural properties. These structural variations cause changes in the physical, fracture and stress corrosion cracking properties. To reach a new understanding of how these properties are linked, this review considers experimental results, molecular dynam-ics (MD) simulations, and glass models on oxide glasses, and specifically, SiO2–B2O3–Na2O glasses.
The balance of this section consists of three sec-tions addressing, in part, the prior art. Section 1.1 presents a brief review of the origin of modern glasses. Section 1.2 pre-sents the mathematical formulation of the fracture mechanics problem. Section 1.3 reviews sub-critical failure of glasses. This discussion includes definitions of key stress regimes and standard equations.
Section 2 concerns structural features of oxide glasses. This section begins with an overview of how the chemical composition of glasses dictates the atomic level structure. Section 2.1 contains a rather broad discussion on oxides roles in glasses—what types of oxides are glass formers; what types of oxides are structure modifiers; and what types of oxides can play both roles. Section 2.2 narrows the scope to ternary glasses consisting of two glass formers, silica (SiO2) and Diboron trioxide (B2O3 also called boron oxide and boron tri-oxide), and one alkali oxide glass modifier and presents the elementary structural units of these systems.
Section 3 reviews current literature devoted to first order mixing approaches for predicting physical properties in oxide glasses such as density, Young, shear and bulk moduli, Poisson’s ratio, glass transition temperature, etc. Section 3.1
compares three bulk density mixing models for SiO2 B2O3 glasses containing alkali oxides modifiers. The discussion
includes a detailed comparison between the experimental data and the mixing model results for a number of these glasses. The last part of the section, section 3.2, concerns specifi-cally SiO2 B2O3 Na2O ternary glasses. Scholarly literature cites first order mixing models for a number of the physical properties: Young’s modulus, shear modulus, bulk modulus, Poisson’s ratio, and glass transition temperature. The material in this section ties back to section 2 and provides a framework for predicting the physical properties of various glasses as a function of the concentration of the elementary units.
Section 4 examines the fracture properties of a rather sim-plistic ternary system, SiO2 B2O3 Na2O. It begins (section
4.1) with a discussion of the fracture toughness of the systems as a function of the chemical composition and strives to estab-lish an understanding of the links between the chemical com-position and the physical properties. Section 4.2 moves on to stress corrosion cracking and examines relationships between the environmental limit, the slope in Region I, the chemical composition, and the physical properties of the glasses. It shows that a parameter coined the degree of polymerization provides a nice functional collapse of the Region I data. The
degree of polymerization provides a measure of the glass reticulation.
It is well noted that sections 2, 3 and 4 continually hone in on [SiO2] [B2O3] [Na2O] oxide glasses. This is a natural reduction of the scope of oxide glasses as [SiO2], [B2O3] and [Na2O] are the main components of many industrial glasses. Moreover, these components are used to model the behav-ior of their more complex counterparts (e.g. [13]). The last section provides a wrap up and an outlook to possible future avenues of research.
1.1. Glass history: a brief overview
Glasses are among the oldest industrial materials known to man, and they are widely used to this day. A historical under-standing of technology and chemistry related to advancements of glasses, whether deliberate or accidental, aids in the devel-opment of new ideas for today’s ongoing studies of glasses. Thus, this section briefly reviews the evolution of glass tech-nologies and glass chemistries and points out how certain chemical modifications alter the physical and mechanical properties of the glasses.
In nature, exposing glass formers (e.g. silica) to high temper-atures, e.g. volcanoes (forming Obsidian glass) or lighting strikes, leads to naturally forming glasses. Archaeological dis-coveries reveal that man used Obsidian glass for arrowheads during the Stone Age. Yet, the first man-made glass objects, commonly believed to have occurred by accident, originated in 3500 BCE in Mesopotamia. This discovery yielded beads and decorative glass glazes [14, 15].
Early glass vessels were made by core-formed techniques starting from 1600 BCE in the ancient Near East [14]. Artisans dipped solid cores into molten glass. The glassware was then shaped and decorated to make intricate vessels. After form-ing the glass vessel, the central core was picked out resultform-ing in a hollow vessel. Initially, these glasses were opaque, but in due course, translucent glasses appeared. Controlling these
aesthetic properties (i.e. hues, transparency, etc) and work-ability drove the ongoing development of the glass industry.
A major technological breakthrough came with the devel-opment of glass blowing techniques, presumably in Syria around 50 BCE [14, 15]. Craftsmen used long pipes to blow the glass into varying shapes. Initially, the shapes were dic-tated by molds. As craftsmen mastered the trade, they moved on to shaping the glasses via tools. To this day, craftsmen still practice these techniques for fabricating art pieces, artistic tableware, and precision scientific glassware.
Glass artisans of the Roman Empire greatly enhanced the glass technology and industry. More importantly, they spread the techniques throughout Europe and into Asia. Roman glass artisans are credited with the development of color-less, transparent glasses. Opaque and translucent glasses arise from impurities. One of the predominant impurities was Fe2+ which gives a greenish hue to glasses [16, 17]. Craftsmen dis-covered that adding antimony [17] and manganese oxide [16] causes the transformation of Fe2+ into Fe3+ which provides a much lighter yellow hue. It should be further noted that the hue also depends on the valence and coordination number of Mn [16]. Mn+3 results in a purplish hue, and Mn+2 results in a yellowish hue [16, 18]. Antimony and manganese oxide not only alter the hues/colors of the glasses, but they offer other advantages. Antimony aids in removing bubbles [19], and manganese oxide alters the physical properties of the glass (e.g. viscosity [20]).
Other craftsmen found that by carefully selecting their raw materials (i.e. iron free sand and Natron), they were able to achieve higher quality glasses [21]. Furthermore, the addition of Na2O, then and now, enhances the work-ability of glasses by decreasing the glass transition temperature, decreasing the viscosity, etc [22]; but, Na2O in high concentrations has a negative effect, decreasing resistance to fracture [23].
Given the availability of colorless/transparent glasses, architects began to incorporate glasses at an increasing rate in architectural structures (windows, tiles, decorations...) which undoubtedly increased the aesthetics of the buildings [24]. Today, researchers, engineers and craftsmen alter the compo-sition of the glasses to fabricate glasses with precise hues and colors; yet, they do not always optimize physical and mechan-ical properties.
After the fall of the Roman Empire and into the early part of the Middle Ages, very few major glass technological advances occurred. Nonetheless, the use of potash (ashes from beech wood or fern [25, 26]) became common. Historians hypoth-esize that this change came about due to a declining supply of soda (obtained from natron or soda-rich ashes from maritime plants) and/or an increase in the demand for glasses [27, 28]. Replacing raw materials rich in Na2O for raw materials rich in K2O alters the physical and mechanical properties of the glasses. For example, this replacement decreases the coeffi-cient of expansion, increases the viscosity, and increases the glass resistance to water [29].
Towards the middle of the Middle Ages (1100 CE), German craftsmen developed a technique (coined cylindrical/muff glass technique) to make sheet glass (subsequently enhanced by Venetian craftsmen) [28]. They would blow long cylinders of
glass, remove the ends, and cut the cylinders along the length [28, 30]. Afterwards, they would again heat the cylinder, so that it can be unrolled and flatted with blocks of wood to form large sheets. Yet the sizes of the sheets were limited. Surpassing this technique was the crown glass technique. This technique made use of a pipe to blow a hollow glass ball which was pierced and spun to form a glass sheet. This technique utilizes centripetal force to draw the glass into large sheets. The disadvantage to this technique is the central connection point of the glass sheet to the pipe. This point left a flaw in the glass, and although not stated in literature, probably gave way to a failure point.
During this time period, the hues of these glasses remained a disadvantage. In the 15th century, glass makers in Vince-Murano invented cristallo, an usually clear, hard, brilliant glass [15, 31, 32]. The clarity of the glass arose from highly pure components and purification of the potash. This in turn meant that Mn2O was no longer needed as a bleaching agent. Unfortunately, the potash cleansing and purification processes removed calcium, magnesium and alumina which contribute to stabilizing the glasses [32]. Thus, these glasses were less durable than glasses with a hue.
As many of these technological advances were taking place in Italy, George Ravenscroft was commissioned in England to find a glass that matched, or surpassed, the Italian cristallo glass [33]. In 1674, Ravenscroft patented lead crystal glasses. These glasses use lead to increase clarity and to enhance mechanical properties: increase density, increase refractive index, decrease working temperatures, decrease viscosity, etc. It is noteworthy that these glasses were hard enough to with-stand engraving. By the end of the 18th century, glass makers across Europe were routinely incorporating lead in their glass recipes. Today, lead is still used in glasses for fabricating lens; however, its use in glassware has decreased due to issues con-cerning lead poisoning.
In the latter part of the 17th century, Louis Lucas de Nehou enhanced the sheet glass manufacturing process by pouring molten glass onto an iron table and subsequently rolling it out [34]. This technique enabled glass makers to fabricate large sheets of glass rather than the small sheets formed from blow-ing glass. In the context of the industrial revolution, Henry Bessemer advanced the fabrication of sheet glass by using two rollers to form a continuous ribbon of glass [35]. Around the turn of the 20th century, Michael Owens filed a series of pat-ents, which ultimately enabled him to automatically produce glass bottles [36–40].
Today, glass usages extend well beyond common house hold materials (windows, vases, cookware, drinking glasses, etc) to include heat resistant technologies, protection pan-els (smart phones, plasma screens, solar panpan-els, etc), lens for satellites in outer space, etc. Despite these far reaching uses, glasses still fail abruptly. Frequently, post-mortem fail-ure studies reveal material flaws which were propagating via stress corrosion cracking. Understanding and predicting the growth of such flaws under sub-critical stress conditions remains a hurdle for scientists. Furthermore, how the basic glass network (i.e. the interconnect of the glass structure) dic-tates the physical, mechanical and stress corrosion cracking properties remains a mystery.
1.2. Fracture of materials: in the absence of a corrosive environment
In the early 1900s, Inglis [42] studied fracture in an infinite plate under stress (where σ is the stress applied at infinity)
with a penny shaped hole (figure 1) in the plate. He showed that the stresses, σA, concentrate at point A, as shown in
figure 1. The stress, σA, is given by:
σA= σ 1 +2a b = σ 1 + 2 a ρ (1) where a and b correspond, respectively, to the lengths of the semi-major and semi-minor axes of the hole; and ρ = ba2 is the radius of curvature at the tip of the elliptical shaped hole. Allowing a b, equation (1) may be rewritten as follows:
σA ∼ 2σ a
ρ.
(2) Inglis equation is problematic when the crack tip becomes infinitely sharp (i.e. very long and thin). Griffith [44, 45] took this into consideration and considered the onset of crack propagation from an energy balance viewpoint. He believed that the work done to extend the crack must equal the energy needed to create the two fracture surfaces. Applying this theory to Inglis’ configuration shown in figure 1, in the limit where b → 0, the stress, σf, required for crack propagation is
given by [41, 45]: σf = 2γE πa (3) where γ is the surface energy and a is the length of the crack;
and E is a geometry dependent reduced modulus. If the crack
front is in plane stress (thin plates), then [41, 45]:
E =E
(4)
where E is the Young’s modulus. On the other hand, if the crack front is in plane strain (thick plates), then [41, 45]:
E = E
1 − ν2
(5) where E is again the Young’s modulus and ν is the Poisson’s ratio. Griffith’s formulation provides a more favorable esti-mate of the fracture stress; however, it leaves out dissipative energies such as heat.
In the mid 20th century, Irwin [46–48] considered the prob-lem from the viewpoint of an incremental increase in the crack length, a → a + δa. In this context, he proposed the mechan-ical-energy-release rate, G, which is the energy released when the crack front extends by δa [46]. For an infinite plane with a crack of length 2a, the mechanical-energy-release rate is:
G = πσ2a
E .
(6) The point at which the crack begins to propagate corresponds
to G = Gc, where Gc is the critical energy release rate:
Gc= πσf
2a
E .
(7) Normally, Gc is considered a material property.
For simple geometries, calculating the stress field around a notch in a linear elastic material is feasible [46, 49–51]. The stress field ahead of a crack tip (figure 2, [10, 43]) is:
σija(r, θ) = √Ka 2πrf
a
ij(θ) +O(1)
(8) where σaij corresponds to the stress field components shown
in figure 2; θ and r correspond to polar coordinates and are
defined in figure 2; Ka corresponds to the stress intensity
fac-tor; fa
ij depends on the geometry; O(1) corresponds to higher
order terms; and a denotes the mode of fracture.
There are three modes of fracture (figure 3): opening mode (Mode I), in-plane shear mode (Mode II), and out-of-plane shear mode (Mode III). For mixed mode loading, the mechan-ical-energy-release rate is additive, thus [41]:
Figure 1. Sketch of Inglis’s plate under stress (σ) with an elliptical
hole in it (recreated from [41]; for more details see [41–43]). The
parameters a and b represent the length of the major and semi-minor axis of the hole. Stresses concentrate at the vertices of the semi-major axis (i.e. points A in the figure). The radius of curvature
at A is ρA.
Figure 2. Sketch of the stress field around a crack tip in polar
coordinates—r is the distance from the crack tip and θ is the polar
angle. The variables σij and τij represent the normal and shear
components of the stress, respectively. Reproduced with permission
G =K2 E = K2 I E + K2 II E + (1 + ν) K2 III E (9) where E corresponds to equation (4) for plane stress and to
equation (5) for plane strain. The stress intensity factor, K, depends on the applied loading as well as the shape of the fracture specimen. For a crack to propagate in a vacuum, K must be greater than Kc where Kc is the fracture toughness of the material. Additionally, Kc is a material constant that can be measured experimentally [52]. There exists a relationship between the fracture toughness (Kc) and the Griffith energy criteria, Gc: Gc= K 2 c E . (10) Typically, many researchers consider only mode I loading, and thus, KI and K are equivalent as KII=KIII=0.
1.3. Stress corrosion cracking: a brief overview of sub-critical stress corrosion cracking
In a non-corrosive environment, the applied stress, K, must be greater than or equal to the stress intensity factor, Kc (i.e.
K Kc) in order for crack growth to occur. The growth of
these cracks results in catastrophic failure due to their high velocity, v (typically set by the speed of sound). However, there are examples wherein cracks propagate for K < Kc. A
simplistic example is the propagation of a crack in a car wind-shield. After a rock hits the windshield, the driver may notice that the crack slowly grows, i.e. K < Kc. As time evolves, the
crack gets longer. As the crack gets longer, the crack growth rate increases (i.e. K is increasing in time). This process feeds upon itself until the crack undergoes dynamic fracture where
K > Kc, and the crack extends to at least one edge of the
windshield.
The initial phase of crack growth in the windshield pertains to environmentally assisted crack growth, sub-critical crack growth (i.e. K < Kc). Sub-critical crack propagation occurs
when water, or other corrosive environmental elements, attacks the crack tip, and thus, the crack propagates despite
K < Kc. Wiederhorn [1, 2] conducted extensive studies of this
phenomenon. Figure 4(a) presents a schematic of the crack
propagation velocity (v) as a function of the stress intensity factor (K). Wierderhorn experimentally evidenced three sub-critical crack propagation zones plus one material dependent threshold [1, 2]:
1. Region I: the crack front velocity is limited by the chemical reaction rate at the crack tip.
2. Region II: the crack front velocity is limited by the time for the reactant to reach the crack front.
3. Region III: the velocity of the crack front is too fast for the chemical reactant to reach the crack front, yet K is less than Kc.
4. Region 0 (also known as the environmental limit, Ke): This is a threshold limit where the stresses imposed on the crack front are not adequate to drive the crack propaga-tion, despite being in a chemically corrosive environment. This threshold stress does not exist in all materials (e.g. pure silica glass does not have a threshold stress.) Documented over the years [1, 2, 4], there are models devoted to the development of a first principles understanding of the physical dynamics of these curves.
Returning to the simplistic model of crack propagation in a windshield, if the driver brings the car in while the crack is still small, it is repairable; that is, the crack propagation can be stopped. The key here is to catch the crack before the crack tip forces become too great. Once the crack propagation enters Regions II and III crack propagation, the crack quickly extends the length of the windshield. Thus, the time to repair the crack is well before the crack front velocity reaches the Region II growth phase. The balance of this section provides a brief overview of sub-critical crack growth, concentrating on Regions 0 and I (for more extensive reviews see [3, 4, 53]).
1.3.1. Review of Region 0: the environmental limit. Region 0,
also coined the environmental limit Ke (depicted in figure 4(a) as the vertical line at lower stress), indicates the minimal stress required for corrosive agents to react with the crack front, and thus, cause the crack front to propagate. Not all glasses have an environmental limit, e.g. pure silica. Thus, no matter how small the stress on the crack tip in pure silica, the crack will always propagate. On the other hand, alkali glasses do, in gen-eral, have an environmental limit [1, 3, 4, 54].
Lawn [41] links the delayed onset of crack propagation to a shielding zone which encompasses the crack tip. The shield-ing zone dissipates energy around the crack tip. Thus, the effective stress intensity factor at the crack tip is:
Kl=Kg+Ksz
(11) where Kl is the stress intensity factor in the local region around the crack tip, i.e. enclave zone; Kg is the global (or continuum) stress intensity factor; and Ksz is the shielding contributions (figure 5). Thus, the physical properties of the glass and the crack front within this shielding zone (or process zone, PZ) dictate the glass response to an external stress.
The environmental limit, Ke, is known to depend on the
glass chemical composition [1, 3, 4, 54]. There are several mechanisms proposed in literature to explain variations in Ke: 1. Stresses at the crack tip cause enhanced diffusion of alkali
atoms. Thus, the energy necessary for alkali atoms to migrate out of the PZ reduces the overall energy provided to the crack tip. This energy sink aids in delaying the onset of crack propagation, thus giving rise to a critical environmental stress intensity factor [1, 2, 54].
2. Hydronium-Na+ exchange causes a compression in the PZ due to the larger size of the hydronium ions [54–56]. 3. Blunting of the crack tip [54].
4. Variations in the pH at the crack tip [54, 57–59]
For nearly 50 years, scientists have debated the fundamen-tal mechanisms leading to Ke, yet conclusive first principle explanations remain elusive. Frequently, they choose one or two of the explanations above and ignore the underline struc-ture of the glass. It is also noteworthy that many experimental tests, until recently, did not systematically alter the chemical
composition. Rather, studies used complex oxide glasses (or overly simplified glasses, e.g. pure silica) to study these effects. Thus, effects due to the glass structure were difficult to qualify and quantify, and trends were less than conclusive. A concerted study of simple ternary glasses as a function of chemical composition will facilitate the development of our understanding and ultimately lead to better glass products. This review, in conjunction with Barlet et al works [23, 60–66], represents a step in this direction.
>
II
<
log
(a)
KI (MPa.m1/2) 0.2 0.3 0.4 0.5 0.6 v (m/s) 10-12 10-10 10-8 10-6 10-4 Silica Alumiosilicate Borosilicate Soda-Lime (b)Figure 4. (a) The schematic depicts the three regions of sub-critical cracking (indicated by Roman numerals) associated with stress
corrosion cracking (recreated from [1, 2, 4]). KI is the stress intensity factor in mode I fracture, in this figure and all subsequent figures. The
velocity of the crack front is denoted by v. Some materials exhibit a threshold environmental limit, frequently denoted by Ke and coined
Region 0 or the environmental limit, where the stress at the crack tip is not sufficient for water to react with crack front, thus the crack tip
does not propagate. (b) Wiederhorn’s stress corrosion cracking curves in Regions 0 and I for soda-lime (red circles), alumino-silicate (blue
triangles), borosilicate (green squares), and silica (purple stars) glasses (recreated from [1]). Fracture experiments occurred in distilled
water at constant temperature, 25◦C.
Figure 5. Sketch of the K-field felt by the crack tip (recreated
from [41]). Kl represents the stress intensity factor in the local
region around the crack tip, or the enclave. Kg represents the
1.3.2. Review of Region I. In Region I, the velocity of the crack front is an increasing function of the stress intensity factor (figure 4(a)). The slope in this region depends on several factors including the chemical composition of the glass. Researchers say the sample is more susceptible to stress corrosion crack-ing for higher slopes [67]. Wiederhorn suggests, in Region I, that the velocity of the crack front depends on the time for the chemical reaction to occur at the crack tip [1, 2, 4]. Moreover, his exponential fit for Region I, derived from the reaction-rate theory, is a common fit used throughout literature [1, 2, 4]:
v = A ∗ pH2O
po
m
∗ exp ((−∆Ea+bKI) /RT)
(12) where A, ∆Ea, m and b are empirical parameters; T is the
temper ature of the environment; R is the ideal gas constant; and pH2O and po are the partial pressure of the vapor phase in the atmosphere and the total atmospheric pressure, respec-tively. It should be noted that, ∆Ea is also considered the
acti-vation energy of the reaction. Wiederhorn links the slope, b, to variations in the crack tip activation volume (∆V∗) and the
crack tip radius of curvature (ρct) [1, 3, 57, 68, 69]:
b = 2∆V√ ∗
πρct.
(13) Some authors attribute the activation volume (∆V∗) to a
differ ential change in the volume from the initial to the acti-vated state [68, 70]. On the other hand, Freiman et al [3] conjunctures:
∆V∗=N
aπ rA2+r2B δl2
(14) where rA and rB are the radii of atoms A and B which undergo
a bond elongation of δl, and Na is Avogadro’s number. The combination of equations (13) and (14) gives:
b = Naπ r2 A+rB2 δl √πρ ct . (15) Returning to equation (12), the stress corrosion behavior depends on the humidity and temperature. Similarly, several authors [69] show that increasing RH for constant K and con-stant T provides for an increasing crack front velocity (see figure 6(a)). Several authors [1] show that increasing T for constant K and constant relative humidity (RH) provides for an increasing crack front velocity (see figure 6(b)). In this regard, the work of Wiederhorn et al [1, 2, 69] exemplifies these scenarios in soda-lime glasses (figures 6(a) and (b)).
For practical purposes, many researchers work at constant
T and constant RH. Thus, the form of equation (12) reduces to [71]:
v = voexp (βcKI)
(16) where vo and βc represent empirical parameters. It should also
be noted that vo depends on the humidity. In short, vo incorpo-rates all of the pre-factor constants:
vo=A ∗ pH2O
po
m
∗ exp ((−∆Ea) /RT).
(17) Similarly, βc incorporates the constants in the exponent:
βc= b
RT.
(18) Other authors use power laws [72, 73] to describe Region I:
v = v KI K0 n ∼ αoKIn (19) where v , α
o= (Kv0 )n, n and Ko are empirical parameters. The parameters βc and n are linked to the susceptibility to
K
I(MPa.m
1/2)
0.5 0.6 0.7 0.8v
(m/s)
10-8 10-7 10-6 10-5 10-4 10-3 100 % 0.017 % 0.2 % 1 % 10 % 30 % H2O IIIK
I(MPa.m
1/2)
0.2 0.4 0.6 0.8v
(m/s)
10-10 10-8 10-6 10-4 10-2 25ºC 2ºC 90ºC (a) (b)Figure 6. Velocity (v) of the crack front as a function of the stress intensity factor (K = KI due to mode I fracture) and environmental
parameters in soda-lime glass. The panels reveal how the v versus KI curves depend on the humidity (a) and temperature (b) recreated from
Wiederhorn 1970 [1]). (a) [69] © Chapman and Hall Ltd. 1982. With permission of Springer. Fracture experiments with varying humidity
stress corrosion cracking. Atkinson et al [67] provides a bit of insight into the meaning of n:
• n = 2–10 implies diffusion controlled crack growth.
• n = 20–50 implies stress corrosion controlled crack
growth.
Mould [74–76] theorizes methods for crack propagation via a rate-limiting step at the crack tip. In glasses, this is simply the hydration of the reactant, water, with the stretched Si O Si bond at the crack tip. It is commonly agreed that the glass chemical composition alters the v versus K curve, yet there is much that remains a mystery. For years, researchers have routinely studied overly complicated glasses, or pure silica (figure 4(b)), and they have neglected the study of, for exam-ple, ternary glasses with a focus on systematically altering the glass chemistry. Thus, the concepts presented by Mould [74, 75] continue to prevail as models for stress corrosion cracking of glasses. While the prevailing models/theories have merit, they fail to address functional dependencies that are undoubtedly critical to our understanding of industrial glasses.
1.3.3. Review of Region II. Region II corresponds to the
stress regime where the velocity of the crack front is virtu-ally independent of the stress applied at the crack tip. In other words, incremental increases in the stress intensity factor do not result in incremental increases in the velocity. However, it does depend on the amount of water in the atmosphere [2, 4]. Increasing the amount of water in the atmosphere causes the velocity to increase. Thus, the velocity depends on the time for water to reach the crack front. Based on the work by Atkin-son et al [67], Region II crack growth can be characterized by an n (in equation (19)) between 2 and 10 [67]. The level of the plateau in Region II is a function of the amount of water in the system:
v = vopH2ODH2O
(20) where DH_2O corresponds to the diffusion coefficient of water molecules in air [2, 4].
1.3.4. Review of Region III. In Region III, the crack front
moves too fast for water to reach the crack front. Thus, Wiederhorn evidenced an overlay of the velocity versus stress intensity factor for humidities ranging from 0.017 to 100% [2, 69]. However, the crack growth in this region does depend on the environmental conditions (i.e. dielectric constants) as evidenced in literature [75, 77].
It is noteworthy, the challenge for engineers and scientists is preventing stress corrosion cracking. This implies that the stress intensity factor at the crack front must be less than the environmental limit. In the case that a crack front develops and begins to propagate, the challenge evolves to intervening in an effort to avoid catastrophic failure. The intervention needs to occur before the crack propagation enters into Region II and III failure, which frequently leads to dynamic fracture. 2. The structure of oxide glasses
Oxide glasses, by definition, have no long-range order (i.e. atoms in the material lack translational and/or rotational symmetry) as opposed to crystalline counterparts. Figure 7
displays a sectional view from a 3D molecular dynamics sim-ulation of a pure amorphous silica system [43, 78–83]. In the context of the short range structural order, one silicon atom resides in the center of the tetrahedron structure with four oxygen atoms located at the corners of the tetrahedron. The bond length between the silicon and oxygen atoms is approxi-mately 1.61 ± 0.05Å (see figure 8(a)). Figures 8(b) and (c) display the Si Si and O O bond lengths. The O Si O angle corresponds to an angle in a tetrahedron, and the distribution is sharply peaked around 109◦ (see figure 9; red line). The Si O Si angle corresponds to the interlink angle between the SiO4 tetrahedral structures, and the distribution is broadly peaked around 146◦ (see figure 9; blue line).
The SiO4 tetrahedra are connected to one another and pre-dominantly form rings composed of six silicon atoms and six oxygen atoms. These rings correspond to the mid-range order of SiO2 glasses. A ring is the shortest path connecting a Si atom
Figure 7. A sectional view of a 3D molecular dynamics simulation which shows a typical amorphous silica (SiO2) system. Blue spheres
back to itself via Si O bonds [81, 84, 85]. The nomenclature for the ring size depends on the number of Si atoms in the ring. An n-member ring has n Si atoms and one O atom between each of the Si atoms (for a total of n O atoms in the ring). For example, a 3-member ring has three Si atoms with one O atom between each of the Si atoms, for a total of three O atoms in the ring. Figure 10 displays a histogram of the ring distribu-tion in pure amorphous silica as found by MD simuladistribu-tions. The distribution in the figure ranges from 3-member rings to 9-member rings; however, larger rings are possible [81, 84, 85]. The distribution (figure 10) peaks at 6-member rings with a fractional contribution greater than 30%.
Pure amorphous silica glass is one of the simplest glasses; yet, industrial glasses invariably include more than four dif-ferent oxides with silica being the dominant oxide comp-onent. The additional oxides provide desirable changes to the physical properties of the resulting glasses, for example,
lower refractive index, lower dispersion, increased heat shock resistance, lower melting point temperatures, enhanced work-ability, decrease in the coefficient of thermal expansion, etc. Schott’s BK7 Borosilicate glass is a common glass used in optics and contains an assortment oxides: predominant comp-onents include SiO2, B2O3, K2O, Na2O and BaO, as well as minor components including Sb2O3, CaO, TiO2, and ZnO2. Another major industrial glass is Corning 7740 Pyrex which is used in manufacturing laboratory glassware and kitchenware. It consists of SiO2, B2O3, and Na2O with minor amounts of Al2O3, CaO, Cl, MgO and Fe2O3.
2.1. Basic chemical composition of oxide glasses
Components of oxide glasses fall into one of three categories: (1) glass formers, (2) glass modifiers, and (3) glass intermediates (or conditional glass formers). Glass formers correspond to oxides that naturally form an amorphous structure. Zachariasen [86] in 1932 laid the groundwork for scientists to understand vitreous
Bond length (nm)
0.2
0.4
0.6
In
tensit
y
(c)
Si-Si
Bond length (nm)
0.2
0.4
0.6
In
tensit
y
Si-O
(a)
Bond length (nm)
0.2
0.4
0.6
In
tensit
y
(b)
O-O
Figure 8. Pair distribution function as a function of bond length. Figures in panels correspond to the distribution of: (a) Si–O bond length,
(b) O–O bond length, and (c) Si–Si bond length. Bond lengths are based on molecular dynamics simulations of pure-amorphous silica
with ∼5000 atoms in the system (for simulation details see [43, 78–81]). Simulations invoke the Vashishta et al potential [82, 83].
Angle (°) 60 80 100 120 140 160 180 In tensit y 0 0.2 0.4 0.6 0.8 1 1.2 O-Si-O angle Si-O-Si angle
Figure 9. Distribution of bond angles. The red line centered around
109◦ represents the distribution of O–Si–O bond angles within the
silica tetrahedra. The blue line centered around 146◦ represents
distribution of the Si–O–Si bond angles or the angle between
tetrahedra. Bond angles extracted from molecular dynamics simulations of pure-amorphous silica (for details of simulations see
[43, 78–81]) with ∼5000 atoms in the system using Vashishta et al
potential [82, 83]. Ring size (n) 3 4 5 6 7 8 9 Precen tage (% ) 0 5 10 15 20 25 30 35
Figure 10. Distribution of rings as per molecular dynamics
simulations of pure-amorphous silica [43, 78–81] with ∼5000
atoms. Simulations invoke the Vashishta et al potential [82, 83]. The
independent variable, n, concerns the ring size. An n-member ring
has n Si atoms and one O atom between each of the Si atoms (for a
materials. He supplied the glass community with four simple rules to forming a glass. Let AmOn, where A is the cation, cor-respond to the oxide of choice; then ideally AmOn should meet the following conditions to form an amorphous media [86]:
• each O atom must be connected to at most two A atoms. • A atoms must not have an excess of O atoms surrounding
it (typically three or four).
• the O atoms should be corner sharing and not edge nor face sharing
• in three dimensions, at least three O atoms corners should be shared.
Zachariasen [86] listed five amorphous oxides in 1932 as already fabricated: silica (SiO2), boron trioxide (B2O3), ger-mania (GeO2), phosphorus trioxide (P2O3) and amorphous arsenious oxide (As2O3). Since Zachariasen’s time, additional glasses have been successfully fabricated: Sb2O3, In2O3, Tl2O3, SnO2, PbO2, SeO2, etc. It should be noted that Zachariasen predicted the existence of Sb2O3 glasses; however, at the time, the glass had not been successfully fabricated [87]. Sun [88] enhanced our understanding of glass formers with his bond strength studies. He found that all of the glass formers have bond strengths greater than 80 kcal per Avogadro bond. These oxides naturally form amorphous medias upon ‘rapid’ quenching of their liquid states. In general, glass formers typ-ically have a 3D network of covalent bonds and are acidic (e.g. silica is weakly acidic) [89].
In comparison, glass modifiers cannot form an amorphous structure [88]. As the name implies, they modify the glass structure. Frequently, but not exclusively, the addition of a glass modifier to a glass former causes non-bridging oxygen (NBO) atoms in the glass structure with an ion in the vicinity of the NBO for charge neutrality. A simple example is a binary SiO2 Na2O system (see figure 11). For each Na2O molecule added to a pure silica system, two NBO atoms are formed on the silica tetrahedra.
Adding glass modifiers to the glass formers alters the mat-erial properties of the formers. For example, adding sodium (Na2O) to silica decreases the glass transition temperature, decreases the viscosity, etc. Yet, there are less desirable side effects; sodium reduces the glass chemical resistance. Beyond sodium oxide, common glass modifiers include [88] potas-sium oxide (K2O), calcium oxide (or quicklime; CaO), stron-tium oxide (or strontia; SrO), and barium oxide (BaO). In general, glass modifiers have low bond strengths [88], typi-cally <60 kcal per Avogadro bond. Glass modifiers are typi-cally characterized by ionic bonds and are basic [89].
The last major group of oxides is the glass intermediates (or conditional glass formers). These oxides do not inherently form an amorphous structure. However, in some instances when they are added to a glass former, they aid in forming the glass network. In other instances, they can act as glass modifiers. One of the major, conditional glass formers is alu-minium oxide (Al2O3). Adding small amounts of Al2O3 to a binary SiO2 Na2O glass causes: (1) Al atoms to replace the Si atoms (i.e. the Al structure in the glass is a tetrahedron with a negative charge) in the glass network with a Na+ ion in the vicinity for charge compensation and (2) a reduction in the number of NBO atoms (each Al atom removes one NBO atom). Thus, the connectivity (or reticulation) of the glass increases. Additionally, the Al2O3 forms covalent bonds in the glass network. Once the mole concentration of Al2O3 exceeds the mole concentration of Na2O, [[NaAl22OO]3] >1, then the Al atoms can be 4-, 5- or 6- coordinated [90]. (Note 6-coordi-nated Al corresponds to Al in a neutral site [90].) In this case, the Al2O3 forms ionic bonds in the glass network. Other com-mon oxides in the category of glass intermediates include [88] beryllium oxide (or beryllia; BeO), zinc oxide (ZnO), cad-mium oxide (CdO), lead oxide (or monoxide; PbO), and tita-nium dioxide (or titania; TiO2). Glass intermediates typically have an intermediate bond strengths [88], ranging between 60 and 80 kcal per Avogadro bond. They form covalent or ionic bonding, and they are amphoteric.
Routinely oxide glasses are composed of numerous form-ers, modifiers and intermediates. The number of oxides fre-quently exceeds four, and for extremely complex glasses such at R7T7 (used to encapsulate nuclear byproducts), they contain as many as 30 different oxides [91]. Modeling and predicting material properties in these complex glasses is impossible without basic knowledge of the primary oxides. Scientist and engineers use model systems to understand the key components of the more complex glasses [92–94]. Many model systems contain three oxides [60, 95–102], two formers and one modifier. In this spirit, the balance of this review is devoted to ternary glass systems.
2.2. Basic structural units in [SiO2]–[B2O3]–[M2O] ternary
systems and their fractional concentrations
Industrial glasses frequently contain four to seven (or more) oxides. But, scientists will simplify these systems to model glasses containing the three main components: SiO2, B2O3 and an alkali or alkaline earth metals oxides. Literature details a variety of models for binary and ternary glasses containing
Oxygen
Na
+ion
Silica
+
Silica glass
Na
2O
SiO
2-Na
2O glass
Figure 11. Sketch of what happens when the glass modifier Na2O is added to a pure amorphous silica system. Initially, all the silica
tetrahedra are connected and only bridging oxygen atoms exist (represented by the silica glass). To this, one Na2O molecule is added. The
resulting glass has two non-bridging oxygen (NBO) atoms on the silica therahedra which are no longer connected, and the Na+ ion in the
alkali and alkaline earth metal oxides [60, 95–97, 99–102]. For ternary systems containing alkali metal oxides (Li2O, Na2O or K2O), similar elementary units exist. Thus, Feil et al [101] and Budhwani et al [100] generalized the description of these ternary systems as follows:
KSBM[SiO2]− [B2O3]− RSBM[M2O]
(21) where [·] denotes the mole percent, M denotes the alkali metal (Li, Na or K), KSBM is the ratio of [SiO2] to [B2O3]:
KSBM= [B[SiO2]
2O3],
(22) and RSBM is the ratio of [M2O] to [B2O3]:
RSBM=[B[M2O]
2O3].
(23) Table 1 provides a list of symbols used to represent elemen-tary units in the text henceforth. Table 2 summarizes the equa-tions to calculate the fractions of elementary units in these ternary systems based on KSBM and RSBM values.
Considering the binary KSBM[SiO2] [B2O3] system, the borate and silicate networks have a tendency to demix. Figure 12 provides sketches of elementary units (f1, f2, f3, f4,
Q0, Q1, Q2, Q3, and Q4), and table 1 summarizes the elemen-tary units. As in the pure silica system, the elemenelemen-tary silicate unites are tetrahedra with a Si atom in the center and four bridging oxygen atoms on the corners. Q4 denotes the frac-tion of these units. The elementary borate units are triangu-lar BO2/3 planar elements (denoted as [3]B) with a B atom in the center and three bridging oxygen atoms at the corners. The nomenclature f1 denotes the fraction of [3]B units with all bridging oxygen atoms.
Adding M2O to the binary KSBM[SiO2] [B2O3] system causes various other units to be created and subsequently destroyed based on the amount of M2O in the ternary system. The concentration regimes are [60, 95, 97, 101, 103, 104]:
RSBM< Rmax= 0.5 + 0.0625 ∗ KSBM Low
concentra-tions of M2O added to the binary system causes the [3]B
units to transform into [4]B units (BO4/2 tetrahedra units: A boron atom resides in the center of the tetrahedron sur-rounded by four bridging oxygen atoms with a M+ ion in the vicinity for charge compensation). Theoretically, all oxygen atoms are bridging. The nomenclature f2 denotes the fraction of [4]B units in the glass (see tables 1 and
2). For RSBM 0.5, the silica network remains unaltered (i.e. Q4=1), and the two networks remain theoretically demixed. However, for 0.5 < RSBM<Rmax, the glass network begins to mix, forming reedmergnerite units with one four-coordinated boron bonded to four silica tetrahedra [95]. This stage does not lead to NBO atoms. The role of the alkali metal oxide would be a network
compensator in this case, as theoretically all oxygen atoms are bridging.
Rmax< RSBM< Rd1= 0.5 + 0.25 ∗ KSBM In this
regime, M2O begins to form NBO atoms on the silica network. Each M+ ion which does not form a [4]B unit connects to the silica network forming a NBO on a silica tetrahedron [60, 95, 97, 101, 103, 104]. Table 2 presents the equations used to calculate the fraction of Qn elements in the glass. The n in Qn denotes the number of bridging oxygen atoms on the silica tetrahedron. Likewise, 4 − n indicates the number of NBO atoms on the Si network (see table 1). The alkali metal oxide in this regime plays a dual role network compensator to the borate network and
network modifier to the silicate network (i.e. the forma-tion of NBO atoms on the silica network).
Rd1< RSBM< Rd2 = 1.5 + 0.75 ∗ KSBM In this
regime, the [M2O] forms NBO atoms on both the silica and borate networks [60, 95, 97, 101, 103, 104]. For the borate network, [4]B units will be transformed into [3]B units with one (fraction denoted by f
3) or two (frac-tion denoted by f4) NBO atoms and one or two M+ ions nearby, respectively. Any M+ ion not attaching to the borate network continues to form NBO atoms on the silica network. The rate of NBO atoms on the silica network follows the equations presented for Qn in table 2.
Table 1. The table summarizes the symbols used to describe the fraction of elementary building blocks for KSBM[SiO2]− [B2O3]− RSBM[M2O]
glasses (where KSBM= [B[SiO2O23]] and RSBM= [B[M22OO]3]). It should be noted the chemical formulas appear as AOc where A represents the glass former,
O is the oxygen atom, and c represents effective number of O atoms surrounding the glass former. (Common nomenclature found in [60, 95, 97,
100, 101, 103, 104].)
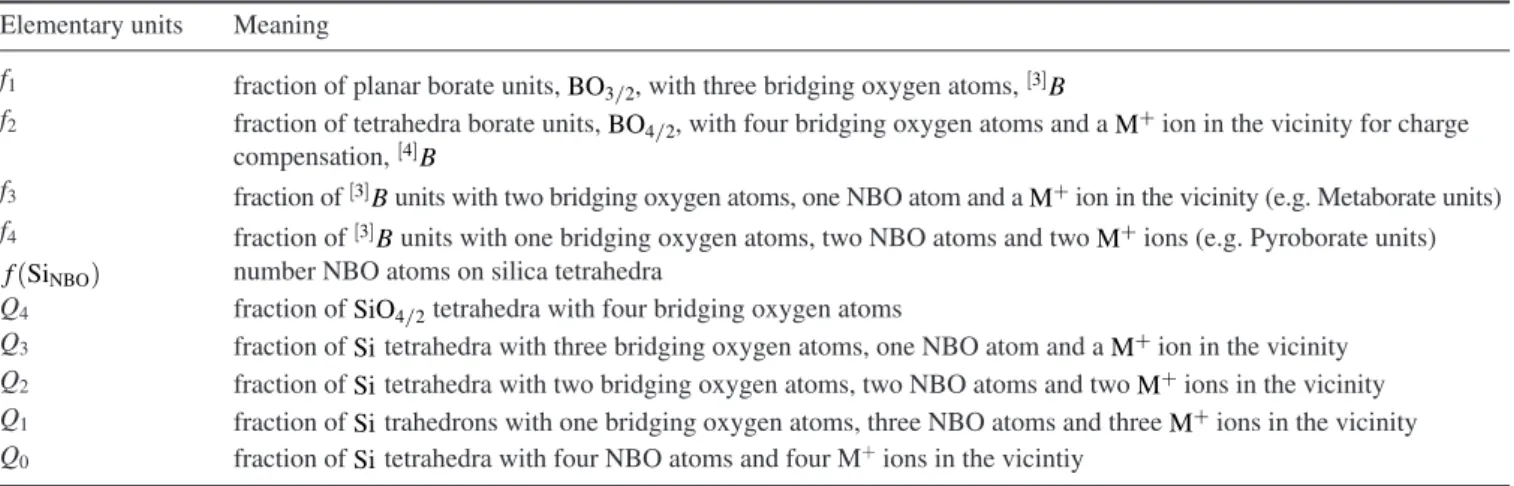
Elementary units Meaning
f1 fraction of planar borate units, BO3/2, with three bridging oxygen atoms, [3]B
f2 fraction of tetrahedra borate units, BO4/2, with four bridging oxygen atoms and a M+ ion in the vicinity for charge
compensation, [4]B
f3 fraction of [3]B units with two bridging oxygen atoms, one NBO atom and a M+ ion in the vicinity (e.g. Metaborate units)
f4 fraction of [3]B units with one bridging oxygen atoms, two NBO atoms and two M+ ions (e.g. Pyroborate units)
f (SiNBO) number NBO atoms on silica tetrahedra
Q4 fraction of SiO4/2 tetrahedra with four bridging oxygen atoms
Q3 fraction of Si tetrahedra with three bridging oxygen atoms, one NBO atom and a M+ ion in the vicinity
Q2 fraction of Si tetrahedra with two bridging oxygen atoms, two NBO atoms and two M+ ions in the vicinity
Q1 fraction of Si trahedrons with one bridging oxygen atoms, three NBO atoms and three M+ ions in the vicinity
Table 2.
The table presents the fraction of elementary b
uilding blocks [ 60 , 95 – 97 , 99 – 101 ] for KSBM [SiO 2 ]− [B2 O3 ]− RSBM [M 2 O ] glasses (where KSBM = [SiO 2 ] [B2 O3 ] and RSBM = [M 2 O ] [B2 O3 ] ). In
general, these equations pro
vide an estimate of the number of elementary
units in KSBN [SiO 2 ]− [B2 O3 ]− RSBN [N 2 O ] ; b ut some authors e
xpand them to other alkali metal oxides including
Li2 O and K2 O [ 99 ].
Also for the estimates of
Qn
, Feller
et al
used a sliding ruler format [
99 ]. Ho we ver , Barlet et al [ 60
] present Gaussian fits for
Qn equations based on Maeka w a et al data and ideas [ 105 ]. T able 3
presents the coef
ficients of the Gaussian fits.
Although not sho
wn here,
Qn
should be normalized due to small round-of
f errors. This ensures that Qsum = 4 n= 0 Qn = 1 .
(Equations come from [
60 , 97 , 99 – 101 ].) Elementary units RSBM v alues References RSBM < Rmax Rmax < RSBM < Rd1 Rd1 < RSBM < Rd2 Rd2 < RSBM < Rd3 Rd3 < RSBM Rmax = 0.5 + 0.0625 ∗ KSBM Rd1 = 0.5 + 0.25 ∗ KSBM Rd2 = 1.5 + 0.75 ∗ KSBM Rd3 = 2 + KSBM f1 1 − RSBM 1 − Rmax 8− KSBM 8 ∗ .75 − RSBM 2+ KSBM 0 0 [ 60 , 95 – 97 , 100 , 101 ] f2 RSBM Rmax 8+ KSBM 12 ∗ 1 − RSBM 2+ KSBM 0 [ 60 , 95 – 97 , 100 , 101 ] f3 0 0 RSBM − Rd1 12 ∗ 8− KSBM 2+ KSBM (8 − KSBM ) 6 ∗ 1 − RSBM 2+ KSBM 0 [ 60 , 95 – 97 , 100 , 101 ] f4 0 0 1.5 f3 + KSBM 6 RSBM (2 + KSBM ) − .25 (8 − KSBM ) 16 + (R SBM − Rd2 ) 4 ∗ (8 − KSBM ) (2 + KSBM ) + KSBM 6 RSBM 2+ KSBM − 0.25 1 [ 60 , 95 – 97 , 100 , 101 ] f( SiNBO ) 0 2( RSBM − Rmax ) KSBM 3 8+ 13 6 (R SBM − Rd1 ) (2 + KSBM ) 2 [ 100 , 101 ] Q4 1 1 − f( SiNBO ) 1 − f( SiNBO ) f( SiNBO ) 0.5 A4 e − f( SiNBO )− B4 C4 2 f( SiNBO ) > 0.5 [ 60 , 97 , 105 ] Q3 0 f( SiNBO ) f( SiNBO ) f( SiNBO ) 0.5 A3 e − f( SiNBO )− B3 C3 2 f( SiNBO ) > 0.5 [ 60 , 97 , 105 ] Q2 0 0 A2 e − f( SiNBO )− B2 C2 2 [ 60 , 97 , 105 ] Q1 0 0 A1 e − f( SiNBO )− B1 C1 2 [ 60 , 97 , 105 ] Q0 0 0 1 1+ 2.2 ∗ 10 5e − 3.65 ∗ ( f( SiNBO )) [ 60 , 97 , 105 ]
The role of the alkali metal oxide is network modifier for both the silica and borate networks.
Rd2< RSBM< Rd3 = 2 + KSBM Ideally in this region,
no f1 units remain in the glass [60, 95, 97, 101, 103, 104]. As RSBM increases, [3]B units with NBO atoms continue to replace [4]B units. Also, the number of NBO atoms on the silica tetrahedron increases. At the upper limit, (RSBM Rd3), Dell et al [95, 101] equations impose the
requirement that f4=1 and all the other fn fractions equal zero.
Table 2 provides the equations to calculate the fractional ele-mentary units in each regime.
Molecular dynamics (MD) simulations enable a counting of the fractional units in KSBN[SiO2]− [B2O3]− RSBN[Na2O] glasses [60]. For low amounts of sodium, R < Rd1, MD
simu-lations and the formulation in table 2 for the elementary unit fractions compare favorably. For R > Rd1, the agreement is
not as favorable. MD simulations suggest that the sodium has a higher tendency to attach to the borate network than the formulations in table 2 predict. Moreover, MD simula-tions suggest that the f2 units form in lower quantity than expected by the formulations in table 2 and the f3 units form in
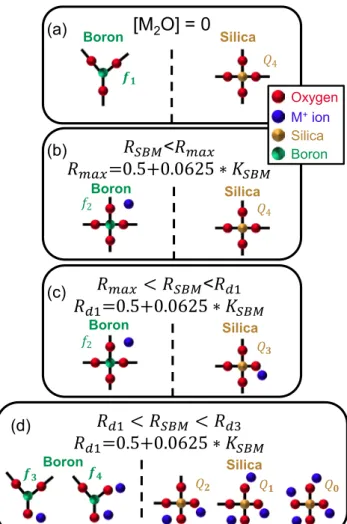
Figure 12. Sketches of how elementary units evolve with [M2O] (for more detailed discussions see text herein and references
[60, 95, 97, 101, 103, 104]). (a) [M2O] = 0: The system ideally
consists of planar 3-coordinated boron units (represented herein
by [3]B; chemical formula: BO3/2) and tetrahedra of 4-coordinated
silica units (SiO4/2). All oxygen atoms should be bridging. f1
represents the fraction of [3]B units, and Q4 represents the fraction
of 4-coordinated silica units. Both of which ideally should be one
in this instance. (b) RSBM<Rmax: In this Region, [M2O] causes
the [3]B units to transform into tetrahedra of 4-coordinated boron
units (represented herein by [4]B; chemical formula: BO4/2) with a
M+ ion for charge compensation. f
2 represents the fraction of [4]B
units. The silica tetrahedra units remain unchanged (i.e. Q4 units).
All oxygen atoms should be bridging. (c) Rmax<RSBM<Rd1: In
this region, [M2O] ideally does not alter the boron units (i.e. existing
units: f1 and f2). The silica tetrahedra units begin to have
non-bridging oxygen units on them. Q3 represents the fraction of silica
tetrahedra units with three bridging oxygen atoms and one NBO
with a M+ ion for charge compensation. (d) R
d1<RSBM<Rd3: In
this region, [M2O] alters both the boron and silica units. [4]B units
revert back to [3]B with one or two NBO atoms on them with one
or two M+ ions for charge compensation, f
3 or f4 respectively. The
silica tetrahedra units can have four to no bridging oxygen atoms.
Qn represents these elements where n is the number of bridging
oxygen atoms and 4 − n represents the NBO atoms and the number
of M+ ions for charge compensation. It should be noted that the
different panels show the new units created. Hence, glasses with
Rmax<RSBM<Rd1 can have the elementary units shown in panels
(a)–(c). Table 2 presents the factional units of each species.
Table 3. Coefficients from Barlet et al [60] for calculating the
fraction of Qn units. An Bn Cn Q4 1.04 −0.19 0.8 Q3 0.77 1.02 0.79 Q2 0.71 2.08 0.79 Q1 0.52 2.94 0.8 Q0 0.91 3.91 0.8
Figure 13. Density of SBN glasses as a function of their mole % of
SiO2, B2O3, and Na2O. The surface is from Inoue et al [97] first order
mixing equations and parameters. The color bar indicates the density of the SBN glass in g/cc. Blue diamonds indicate experimental data.
higher quantity than expected by the formulations in table 2. Likewise, MD simulations suggest that the silica system has a lower affinity for the sodium. In this regard, the system has a tendency to maintain the Q4 elements. Yet, once sodium enters the silica network, MD simulations show that it has a tendency to isolate the Si tetrahedra, forming Q2, Q1 and Q0 elements in higher concentrations.
3. Physical properties of glasses
Several papers use the elementary units presented in the previ-ous section in combination with first order mixing models to provide educated guesses of material properties such as the density, Young’s, shear, and bulk moduli and Poisson’s ratio. Density models discussed herein apply to SiO2 and B2O3 as glass formers and one of three alkali metal oxides (Li2O, Na2O or K2O) as the glass modifier. Beyond density, mod-els for Young’s, Shear and Bulk moduli and Poisson’s ratio are only applicable to SiO2 B2O3 Na2O glasses. This section reviews these models and their limitations.
3.1. Density
One of the most fundamental and easiest material properties to measure is a material’s density (ρ): measure the mass (M) and volume (V) of a sample and divide the results (ρ =M/V). Even odd shaped samples are no problem given Archimedes’ method for determining the volume of odd shape samples by submerging the sample in water and measuring the volume of the displaced water [106]. Literature exemplifies the ease of the measurement, with an abundance of measurements found on all types of materials, including oxide glasses. Bansal and Doremus’s book [107] provides evidence of this, with a catalog of many physical properties of oxide glasses. Modern online catalogs include SciGlass [108] and INTERGLAD [109].
Scientists use these databases, scour literature and/or conduct experimental density measurements [60, 97,
99–101, 107, 110–120] to uncover relationships between the glass density and chemical composition. For ternary KSBM[SiO2]− [B2O3]− RSBM[M2O] systems, authors [97, 99–101] found that first order mixing models provide rea-sonable initial estimates for the densities.
Feil and Feller [101] use binary [B2O3]− RSBM[M2O] sys-tems (i.e. KSBM=0) and the fraction of elementary units in these systems to develop first order mixing models for ρ. For
this binary system, KSBM=0, the mass estimate is: M = 4 i=1 fi∗ Mfi (24) where Mfi is the mass of the elementary unit fi. Table 4 pro-vides the equations for the masses. The system volume is:
V = 4 i=1 fi∗ Vfi (25) where Vfi is the volume of the elementary unit fi. Using least-squares analysis [121] on experimental values of ρ,
Feil and Feller [101] provide estimates for Vfi in the binary [B2O3]− RSBM[M2O] systems. Table 5 provides their Vfi values.
Once Feil and Feller [101] developed their system of equa-tions for the binary [B2O3]− RSBM[M2O] glass, they trivially extended the binary density calculations to the ternary sys-tems, as per the following equation:
ρ = 4 i=1fi∗ Mfi+0.5 ∗ KSBM∗ MFeil 4 i=1fi∗ Vfi+0.5 ∗ KSBM∗ VFeil . (26) Table 4 details Feil’s equation for the Silica network mass,
MFeil. Feil and Feller [101] did not use first order mixing models to estimate the silica unit volume, VFeil. Rather, they assume the volume, VFeil, to be equal to the volume of the silica tertrahedron, VSiO2, plus an incremental volume term,
dVSiO2, representing the volume change due to a NBO and an
M+ ions in the area:
VFeil=V
SiO2+dVSiO2∗ f (SiNBO).
(27) A two parameter linear regression analysis provides the values for VSiO2 and dVSiO2. Subsequently, Budhwani and Feller [100] adopted a more elaborate expression for V:
VBudhwani=V SiO2+
dV4→3
SiO2 ∗ f (SiNBO) f (SiNBO) 1
dV4→3
SiO2 +dVSiO3→22 ∗ ( f (SiNBO)− 1) 1 f (SiNBO) 2 (28) where dV4→3
SiO2 represents the incremental increase in the silica tetrahedron volume corresponding to the Q4 transformation to
Q3 and dVSiO3→22 represents the incremental increase in the silica
Table 4. The table presents how to calculate the mass of the elementary units along with Feil and Feller [101] equation for the mass of the
silica component of the glass. Matom corresponds to the mass of the atom.
System units Mass Reference
f1 Mf1=MB+1.5 ∗ MO [60, 101]
f2 Mf2=MB+2 ∗ MO+MNa [60, 101]
f3 Mf3=MB+2 ∗ MO+MNa [60, 101]
f4 Mf4=MB+2.5 ∗ MO+2 ∗ MNa [60, 101]
Feil’s Silica network mass MFeil=M
Si+ (2 + 0.5 ∗ f (SiNBO))∗ MO+f (SiNBO)∗ MNa [60, 101]
Q4 MQ4=MSi+2 ∗ MO [60, 97]
Q3 MQ3=MSi+2.5 ∗ MO+MNa [60, 97]
Q2 MQ2=MSi+3 ∗ MO+2 ∗ MNa [60, 97]
Q1 MQ1=MSi+3.5 ∗ MO+3 ∗ MNa [60, 97]
![Figure 3. Sketch of the three different modes of fracture. Reproduced with permission from [10, 43].](https://thumb-eu.123doks.com/thumbv2/123doknet/14426791.514373/7.892.144.745.89.331/figure-sketch-different-modes-fracture-reproduced-permission.webp)
![Figure 4. (a) The schematic depicts the three regions of sub-critical cracking (indicated by Roman numerals) associated with stress corrosion cracking (recreated from [1, 2, 4])](https://thumb-eu.123doks.com/thumbv2/123doknet/14426791.514373/8.892.127.762.100.410/schematic-critical-cracking-indicated-numerals-associated-corrosion-recreated.webp)

![Figure 10. Distribution of rings as per molecular dynamics simulations of pure-amorphous silica [43, 78 – 81] with ∼5000 atoms](https://thumb-eu.123doks.com/thumbv2/123doknet/14426791.514373/11.892.94.421.383.686/figure-distribution-rings-molecular-dynamics-simulations-amorphous-silica.webp)
![Table 2. The table presents the fraction of elementary building blocks [60, 95–97, 99–101] for K SBM[SiO2]−[B2O3]−RSBM[M2O] glasses (where KSBM=[SiO2] [B 2O3] and RSBM=[M2O][B2O3])](https://thumb-eu.123doks.com/thumbv2/123doknet/14426791.514373/14.892.204.729.83.1159/table-table-presents-fraction-elementary-building-blocks-glasses.webp)
![Table 4. The table presents how to calculate the mass of the elementary units along with Feil and Feller [101] equation for the mass of the silica component of the glass](https://thumb-eu.123doks.com/thumbv2/123doknet/14426791.514373/16.892.76.822.130.338/table-presents-calculate-elementary-feller-equation-silica-component.webp)
![Table 6. Table of density results for Feil and Feller [101], Budhwani and Feller [100] and Inoue et al [97] for a selection of [SiO 2 ] [B 2 O 3 ] [Na 2 O] glasses](https://thumb-eu.123doks.com/thumbv2/123doknet/14426791.514373/17.892.71.830.131.434/table-density-results-feller-budhwani-feller-selection-glasses.webp)
![Table 8 also includes tabulations for Young ’ s modulus (E), shear modulus (G), bulk modulus (B), Poisson ’ s ratio (ν) and glass transition temperature (T g ) values as calculated via Inoue et al [97] mixing coefficients, corresponding exper-imental](https://thumb-eu.123doks.com/thumbv2/123doknet/14426791.514373/18.892.90.422.93.399/includes-tabulations-poisson-transition-temperature-calculated-coefficients-corresponding.webp)
