HAL Id: hal-00694877
https://hal.archives-ouvertes.fr/hal-00694877
Submitted on 7 May 2012
HAL is a multi-disciplinary open access
archive for the deposit and dissemination of
sci-entific research documents, whether they are
pub-lished or not. The documents may come from
teaching and research institutions in France or
abroad, or from public or private research centers.
L’archive ouverte pluridisciplinaire HAL, est
destinée au dépôt et à la diffusion de documents
scientifiques de niveau recherche, publiés ou non,
émanant des établissements d’enseignement et de
recherche français ou étrangers, des laboratoires
publics ou privés.
system testing
H Audley, K Danzmann, A García Marína, G Heinzel, A Monsky, M
Nofrarias, F Steier, D Gerardi, R Gerndt, G Hechenblaikner, et al.
To cite this version:
H Audley, K Danzmann, A García Marína, G Heinzel, A Monsky, et al.. The LISA Pathfinder
interferometryhardware and system testing. Classical and Quantum Gravity, IOP Publishing, 2011,
28 (9), pp.94003. �10.1088/0264-9381/28/9/094003�. �hal-00694877�
system testing
H Audleya, K Danzmanna, A Garc´ıa Mar´ına, G Heinzela,
A Monskya, M Nofrariasa, F Steiera, D Gerardib,
R Gerndtb, G Hechenblaiknerb, U Johannb,
P Luetzow-Wentzkyb, V Wandb, F Antonuccic,
M Armanod, G Augere, M Benedettif, P Binetruye,
C Boatellag, J Bogenstahla, D Bortoluzzih, P Bosettih,
M Calenoi, A Cavalleric, M Cesai, M Chmeissanij,
G Cianik, A Conchillol, G Congedoc, I Cristofolinih,
M Cruisem, F De Marchic, M Diaz-Aguilon, I Diepholza,
G Dixonm, R Dolesic, J Fausted, L Ferraiolic, D Fertini,
W Fichtero, E Fitzsimonsp, M Freschid, C Garc´ıa
Marirrodrigai, L Gesal, F Gibertl, D Giardiniq,
C Grimanir, A Grynagiero, B Guillaumei, F Guzm´ans,
I Harrisont, M Hewitsona, D Hollingtonu, J Houghp,
D Hoylandm, M Huellerc, J Huesleri, O Jeannine,
O Jennrichi, P Jetzerv, B Johlanderi, C Killowp, X Llamasw, I Llorol, A Lobol, R Maarschalkerweerdt,
S Maddeni, D Manceq, I Mateosl, P W McNamarai,
J Mendest, E Mitchellu, D Nicolinii, D Nicolodic,
F Pederseni, M Perreur-Lloydp, A Perrecac, E Plagnole,
P Prate, G D Raccai, B Raise, J Ramos-Castrox, J Reichea,
J A Romera Perezi, D Robertsonp, H Rozemeijeri,
J Sanjuank, M Schulteu, D Shaulu, L Stagnaroi,
S Strandmoei, T J Sumneru, A Taylorp, D Texierd,
C Trenkely, D Tombolatoc, S Vitalec, G Wannera,
H Wardp, S Waschkeu, P Wassu, W J Weberc, P Zweifelq
aAlbert-Einstein-Institut, Max-Planck-Institut f¨ur Gravitationsphysik und Universit¨at Hannover, 30167 Hannover, Germany
bEADS Astrium GmbH, Friedrichshafen, Germany
c Dipartimento di Fisica, Universit`a di Trento and INFN, Gruppo Collegato di Trento, 38050 Povo, Trento, Italy
dEuropean Space Astronomy Centre, European Space Agency, Villanueva de la Ca˜nada, 28692 Madrid, Spain
e APC UMR7164, Universit´e Paris Diderot, Paris, France
f Dipartimento di Ingegneria dei Materiali e Tecnologie Industriali, Universit`a di Trento and INFN, Gruppo Collegato di Trento, Mesiano, Trento, Italy g CNES, DCT/AQ/EC, 18 Avenue Edouard Belin, 31401 Toulouse, C´edex9, France
hDipartimento di Ingegneria Meccanica e Strutturale, Universit`a di Trento and INFN, Gruppo Collegato di Trento, Mesiano, Trento, Italy
iEuropean Space Technology Centre, European Space Agency, Keplerlaan 1, 2200 AG Noordwijk, The Netherlands
j IFAE, Universitat Aut`onoma de Barcelona, E-08193 Bellaterra (Barcelona), Spain
kDepartment of Physics, University of Florida, Gainesville, FL 32611-8440, USA lICE-CSIC/IEEC, Facultat de Ci`encies, E-08193 Bellaterra (Barcelona), Spain mDepartment of Physics and Astronomy, University of Birmingham,
Birmingham, UK
nUPC/IEEC, EPSC, Esteve Terrades 5, E-08860 Castelldefels, Barcelona, Spain o Institut f¨ur Flugmechanik und Flugregelung, 70569 Stuttgart, Germany pDepartment of Physics and Astronomy, University of Glasgow, Glasgow, UK q Institut f¨ur Geophysik, ETH Z¨urich, Sonneggstrasse 5, CH-8092, Z¨urich, Switzerland
r Istituto di Fisica, Universit`a degli Studi di Urbino/ INFN Urbino (PU), Italy sNASA - Goddard Space Flight Centre, Greenbelt, MD 20771, USA
t European Space Operations Centre, European Space Agency, 64293 Darmstadt, Germany
uThe Blackett Laboratory, Imperial College London, UK
vInstitut f¨ur Theoretische Physik, Universit¨at Z¨urich, Winterthurerstrasse 190, CH-8057 Z¨urich, Switzerland
w NTE-SENER, Can Mal´e, E-08186, Lli¸c`a d’Amunt, Barcelona, Spain x Universitat Polit`ecnica de Catalunya, Enginyeria Electr`onica, Jordi Girona 1-3, 08034 Barcelona, Spain
yAstrium Ltd, Gunnels Wood Road, Stevenage, Hertfordshire, SG1 2AS, UK E-mail: [email protected]
Abstract.
Preparations for the LISA Pathfinder mission have reached an exciting stage. Tests of the engineering model (EM) of the optical metrology system (OMS) have recently been completed at the Albert Einstein Institute, Hannover, and flight model (FM) tests are now underway. Significantly, they represent the first complete integration and testing of the space-qualified hardware and are the first tests on an optical system level. The results and test procedures of these campaigns will be utilised directly in the ground-based flight hardware tests, and subsequently during in-flight operations. In addition, they allow valuable testing of the data analysis methods using the MATLAB based LTP data analysis (LTPDA) toolbox. This paper presents an overview of the results from the EM test campaign that was successfully completed in December 2009.
PACS numbers: 99.55.Ym, 04.80.Nn, 07.60.Ly
1. Introduction
The Laser Interferometer Space Antenna (LISA) [1] is a joint ESA NASA mission for the first space-borne gravitational wave detector. LISA aims to detect sources in the 0.1 mHz to 1 Hz range. Core technologies required for the LISA mission include drag-free test mass control, picometre interferometry and micro-Newton thrusters. A precursor satellite, LISA Pathfinder (LPF), has been developed as a technology demonstrator [2]. The core of the LPF satellite is the LISA Technology Package (LTP) which determines the relative longitudinal and angular positions of two drag-free test masses (TMs) via heterodyne interferometry.
A schematic diagram of the components that make up part of the LTP is shown in Figure 1, with focus on the components involved in the OMS EM tests. Two beams, frequency-shifted by around 1kHz, are created from laser light injected into the laser modulator. These beams are input into the optical bench to form four interferometers:
- X1: Determines the position of the optical bench relative to test mass one
(TM1) .
- X12: Determines the position of test mass two (TM2) relative to TM1.
- Reference: Used to remove common mode noise originating from disturbances that occur before the optical bench.
- Frequency: Utilizes an intentional arm-length mismatch to allow the detection and control of laser frequency fluctuations.
The beams recombine and interfere at two redundant photodiodes in each interferometer. The measured photocurrent is a beat note at the heterodyne frequency, typically 1 kHz [3, 4]. The dc voltage and the complex amplitude at the heterodyne frequency are then determined by the phasemeter via a single bin discrete Fourier transform [4, 5]. The longitudinal and angular positions (X, φ, η) of the test masses are subsequently calculated by the Data Management Unit (DMU) [6]. These outputs are used by the Drag-Free and Attitude Control System (DFACS) [7] to maintain the drag-free conditions of the test masses. In addition, the outputs from the DMU are used to provide feedback for the control of the laser frequency, power and the optical pathlength difference (OPD).
The OMS components have been through individual tests before reaching engineering model level [8, 9]. However, the EM test campaign at the AEI represents the first time that the hardware has been combined at system level. In addition to verifying the functionality of the system, the EM campaign also allowed the testing and refinement of processes that will be essential in-flight. These include, for instance, manual and automatic telecommands that provide system control or the use of the LTPDA toolbox [10] that has been designed for data analysis during in-flight operations. This campaign was successfully completed between October and December 2009. Subsequently, flight model tests of the Laser Assembly were completed in March 2010. The OMS is currently in the flight model (FM) testing phase, undergoing tests that are based on the procedures and results of the EM campaign.
In section 2 we briefly describe the setup and data handling infrastucture during the test campaign and then summarise some of the results of the calibration and characterisation of the OMS EM in section 3.
Figure 1: A schematic diagram of the OMS subsystems. The starting point is the laser head and the modulation unit which provide light for the optical bench interferometers. The phasemeter and DMU provide TM attitude data which is used for drag-free control. In addition, control loops allow the system to function at the required picometre sensitivity.
2. Experimental setup 2.1. Hardware and tests scope
The optical bench is situated in a vacuum tank, the test masses are simulated by two types of piezo actuated mirrors. Longstroke piezos simulate longitudinal motion and three axis piezos are used for emulation of angular test mass motion, depending on the specific test being performed. Fibre feedthroughs connect the optical bench inputs to another vacuum tank containing the Reference Laser Unit (RLU) and Laser Modulator Unit (LMU). The Laser Control Unit (LCU), along with the breadboard version of the Phasemeter Unit (PMU) and DMU are situated outside the vacuum tanks. In this setup, raw data from the PMU is transmitted to the DMU via a serial-to-MilBus converter for processing. The LTP Special Check-out Equipment (SCOE) represents the onboard computer, and provides the data transfer interface to the units. Control of the piezo actuators is performed independently from the control of the units. A synoptic display allows observation of the signals in real time. With the exception of the phasemeter and SCOE all units under test were engineering models. The phasemeter was the breadboard model and the SCOE is a dedicated piece of ground testing equipment.
Following the successful electrical and optical integration of the subsystems into the lab environment at the AEI, the EM test campaign consisted of three sections, each made up of a number of specific procedures. Figure 3 shows the data processing stages of the OMS, as explained in section 1, and their relationship to the three main sections of the EM test campaign:
RAW DATA FILE
RAW DATA AO
AO Submit Data Get AO
Definition file Data flow Analysis Submit AO ANALYSIS AO RAW DATA AO RAW DATA AO Repository
Figure 2: Data flow during the test campaign. Analysis objects containing raw data are created from the original DMU telemetry with the help of a configuration file that contains all the information about the data contained for a given telemetry packet. These AOs are uploaded to the repository where the user can retrieve any set of them according to his specific search. After the analysis, the user can store his result in the repository as a final product. Since this final AO contains all the history steps, any other user downloading this object will be able (i) to know all the parameters used to obtain that result and (ii) reproduce the whole analysis locally.
determine the coefficients required to scale the raw data from the phasemeter to allow calculation of the alignment signals in the DMU.
- Functional Tests: The functional tests go through the individual processes that are involved in the OMS measurement chain. This verifies step-by-step that both the components and the operating procedures function as required (see 3.2).
- Control loop and performance tests: The final stage of testing is
characterisation and simulation of the full LTP process, from obtaining raw data, converting into longitudinal and angular test mass positions in addition to locking the optical pathlength difference (OPD), laser frequency and power loops. Once loop locking is achieved, the measurement sensitivity of the system can be evaluated (see 3.3).
2.2. Data analysis infrastructure
Data analysis of the test campaign performed by the AEI used the LTPDA Toolbox at all stages. The analysis starts and finishes with Analysis Objects (AOs), these are the main building blocks of the LTPDA toolbox, containing not only data but also additional information like the time stamp, units, sampling frequency and the full history of the operations performed to obtain that particular result. In order to reproduce mission conditions as faithfully as possible, the AOs from both initial data and final results are stored in a repository, accessible to anyone authorized. The
Figure 3: A basic representation of how the EM test campaign procedures represent the full OMS measurement chain and how they relate to the state of the data in the system.
objects in the repository contain the meta-data needed to identify and retrieve any set of data. Figure 2 shows schematically the data flow during the campaign.
Data stored in the repository includes the main scientific packets, the housekeeping data, or the configuration files of the different subunits. For each of these telemetry packets a configuration file containing the information in the packet is used. For the typical scientific data packet, around 39 different AOs are produced. These contain displacement and angles for the X1 and X12 interferometers, phase read out for Frequency and Reference interferometers and more than 20 error and data quality flags.
3. Experimental results 3.1. Calibration
Following completion of the electrical and optical integration of the OMS components,
the calibration segment of the test campaign was performed. The calibration
procedures determine the scaling factors that convert the optical signals from the photodiode outputs at various stages in the processing chain. These coefficients must be successfully implemented for the subsequent calculation of the test mass angular and longitudinal positions in the DMU. Three sets of coefficients are calculated:
- c-coefficients: The c-coefficients provide scaling of the phasemeter outputs. They correct for physical imperfections in the systems, including photodiode dark currents and relative phase shift differences between photodiode quadrants. - k-coefficients: The k-coefficients relate the physical test mass angles, φ and η
in the X1 and X12 interferometers to the output from the differential wavefront sensing (DWS) and Direct Current (DC) readings. In the EM campaign this also required the external calibration of the piezos used to simulate the angular motion of the test masses.
- Longitudinal calibration factors: The long stroke translational tests relate the true longitudinal displacement of the two test masses into the equivalent longitudinal displacements, X1and X2, that are output from the DMU.
These procedures were all performed successfully within the EM test campaign, for more details, please see [11].
3.2. Functional tests
The aim of the functional tests is to verify the steps of the full measurement chain that is required from the OMS. This goes from longitudinal and angular motions of the
0 500 1000 1500 2000 2500 3000 3500 4000 −6 −4 −2 0 2 4 6x 10 −4
Test Mass Tilt [rad]
Time [s] ETA (TEST MASS 1)
0 50 100 150 −2.5 −2.4 −2.3 −2.2 −2.1 −2 −1.9 −1.8 −1.7x 10 −4
Test Mass Displacement [m]
Time [s]
X12
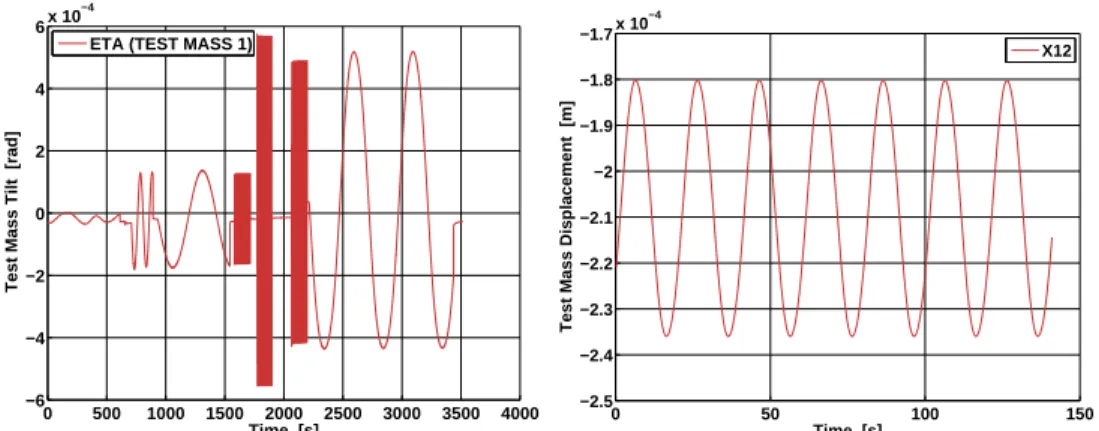
Figure 4: Top: Testing the angular range of the interferometer: different sinusoids are applied to the piezo substituing test mass motion in the η angle. The maximum angular amplitude in this test case was 569 µrad. Bottom: The X12 interferometer follows a longitudinal sinusoidal excursion of the test mass of 298 µm amplitude and f = 0.05 Hz. The maximum velocity of the test mass during the displacement was 94 µm/s for this particular test case.
piezo-actuated mirrors that represent the test masses, to the resulting DMU outputs. These are split into several test cases and include all of the high-level functional tests that verify the delivery of science data as well as the correct functioning of the components:
- Full stroke tests: The full stroke tests verify that the behaviour of the phase outputs from the DMU are as predicted for large test mass displacements of up to 100 µm.
- Tilt tests: The tilt tests show that the behaviour of the DWS and DC outputs for test mass tilts of up to 300 µrad are as expected.
- Non-nominal parameters: Parameters including the heterodyne frequency and PMU sampling rate were changed from nominal to show that the measurement chain still functions when systems are operated in a non-nominal configuration. - Nominal and redundant configurations: Under normal operating conditions
an average of the outputs from the two photodiodes in each interferometer will be used in data processing. The breadboard model of the PMU prevented testing of this configuration due to channel count limitations, however, the redundant and nominal measurement chains were independently and successfully verified. - Error handling: The systems are designed to be able to function under several
non-nominal scenarios, but with event flags that indicate the particular conditions from which the DMU data is being calculated [12, 13]. In this test case a single quadrant failure scenario was tested for the X1 and X12 interferometers. The error flags and the results were as expected.
- Large angular deviations: The DC outputs with angular test mass positions
greater than 500 µrad from the nominal zero position were verified. This
demonstrated predicted DMU behaviours without simulation of the DFACS and the ability to implement feedback control of the test mass position.
In addition these procedures allowed the verification of the scaling and signs of the coefficients obtained from the calibration phase of the campaign. One of the features of the LTP processing is the Interferometer Data Log (IDL) that has the ability to store lower priority scientific data on-board at a high sampling rate that can then be transmitted with the telemetry at a lower rate over a longer period of time. This feature was tested and verified, similarly, the ability to configure specific telemetry channels for the scientific data was demonstrated. Each of the 32 channels from the interferometer photodiodes has error flags. If there is a problem with data from one of the channels then channel selection processes are used to appropriately alter the data used in the calculation of the outputs. The results of this, combined with the given interferometer contrasts, are used to determine the quality of the given data which has four possible states - nominal, redundant, noisy and invalid. These flags were tested as part of the calibration procedures indicating that the data processing systems function as required.
3.3. Control loop and performance measurements
Following the successful calibration and functional tests the final stage of the campaign, the control loop and performance, provides verification of the functionality of the OMS system as a whole. The first stage is to separately verify that the three control loops that stabilize the laser frequency noise, OPD fluctuations and relative intensity noise (RIN), function as required. Once these loops have been characterised and successfully locked the whole system can be put into a nominal operating condition and the performance of the OMS evaluated. This allows verification of the systems ability to perform interferometric measurement and readout below the requirements, and identifies delays in signal communication and processing that are inherent in the system design. There are two common ways of characterising the loops - the open loop gain, and the closed loop gain. Both were assessed during the campaign. The DMU application software provides control of the four following loops [14],
- Slow power loop: The slow power loop allows the control of the laser power by the LCU in a large range of +/- 30 % of the nominal power, which cannot be achieved by the AOMs.
- Fast frequency loop: The fast frequency loop controls laser frequency
fluctuations in the measurement and reference beams in the order of +/- 30 MHz. Frequency fluctuations are measured via an intentional OPD in the frequency interferometer. This is controlled by feedback from the DMU via the LCU to a fast piezo actuator that acts directly on the Nd:YAG laser crystal.
- Slow frequency loop: The slow frequency loop acts to control the frequency fluctuations over a larger range than the fast frequency actuator and to prevent the piezo becoming saturated. This control occurs by varying the temperature of the Nd:YAG crystal.
- OPD loop: The OPD loop maintains the optical pathlength difference between the measurement and reference interferometers. This is measured by longitudinal phase fluctuations in the reference interferometer. OPD changes are effected by a piezo actuated mirror acting on one beam in the LMU. Redundancy of the LMU components means that under nominal operating conditions the piezos in each system act in opposite directions to reduce the load applied to each piezo.
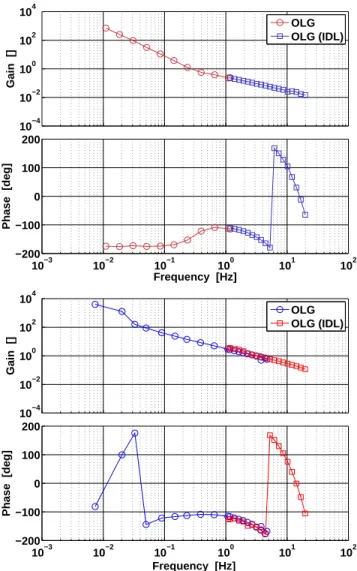
In figure 5 we show the open loop gain for two of the control loops, each frequency bin corresponding to an injected sinusoid. The curve is divided into low and high frequency bins, the reason being that the data samples are obtained from the DMU at 10 Hz. To go above the Nyquist frequency we need to use the Interferometer Data Log (IDL). The IDL allows segments of 100 Hz data up to 18 seconds long to be stored on-board for offline transmission to ground. There is overlap between frequency bins of the online and IDL data in the 1 to 5 Hz frequency range, as shown in the lower plot of figure 5. In this case the data is compared, in general the higher sampling frequency of the IDL data makes it more accurate.
3.3.1. Control loop tests The previous characterisation allows the determination of those values that parametrise the loops’ behaviour. The OPD was found to operate with a unity gain frequency of f ≃ 3 Hz, a phase margin of ≃ 23oand a gain margin of
≃ 0.3. The delay was estimated to be 53 ± 1 ms. On the other hand, the numbers for the Frequency loop are a unity gain frequency of f ≃ 0.2 Hz with a phase margin of ≃ 27oand a gain margin of ≃ 2.3. The delay in this case was 46.8 ± 0.2 ms. The loops were shown to operate according to the design requirements and thus these values are representative of the expected values. Although the loops were not operating in optimal configuration, the characterisation has been used to improve the loops’ performance in the flight model campaign. A more detailed description of the loops can be found in [15].
3.3.2. Performance tests The verification of the performance of the system requires all of the loops to be closed. Once the loops are closed the system is left running in a stable state. In order to meet the requirements in the mHz frequency range, a measurement run of at least ten hours must be evaluated. In this way the sensitivity to fluctuations in the longitudinal position, and the angular orientation of the test masses can be evaluated to determine whether the requirements of 6.3 pm/√Hz and 20 nrad/√Hz respectively are met.
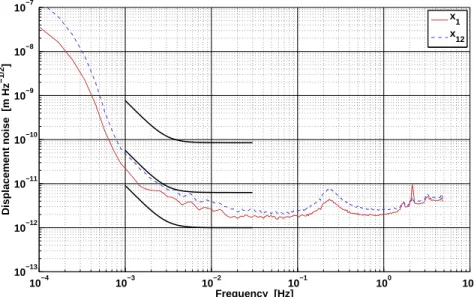
The results of the sensitivity to longitudinal fluctuations are shown in Figure 6. The linear spectral density of the analysed time series remains below the interferometer requirement mentioned above in the complete frequency range for both interferometers
X1 and X12. We used a log-based power spectrum estimator [16] to estimate
the longitudinal displacement noise in a segment of 37800 s with Blackman-Harris
windowing. This algorithm computes a suitable frequency grid given two input
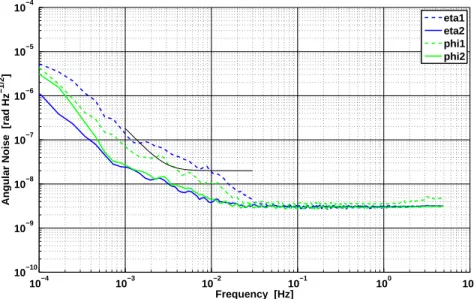
parameters that we chose to be 100 for the desired averages to compute in each bin, and 1000 for the desired frequencies that we want the spectrum to have. The results of the sensitivity to angular position fluctuations are shown in Figure 7. The parameters for producing these linear spectral densities were the same as for figure 6. Each test mass is monitored in two degrees of freedom, η and φ. The measured sensitivity is slightly better for TM2 due to the fact that the fibre injectors on the EM OBI are not monolithic. These non-monolithic fibre injectors are present in both the X1 and X12 interferometers, so that their fluctuations are common-mode. For the calculation of the angular signals of the second test mass, the common components of both interferometers are subtracted from the X12 signals and the fluctuations of the unstable fibre injectors are suppressed. This slightly higher noise level is not expected with the FM optical bench, since the FM fibre injectors are monolithic and thus much more stable.
10−2 100 104 10−4 102 Gain [] 10−3 10−2 10−1 100 101 102 −200 −100 0 100 200 Phase [deg] Frequency [Hz] OLG OLG (IDL) 100 102 104 10−2 10−4 Gain [] 10−3 10−2 10−1 100 101 102 −200 −100 0 100 200 Phase [deg] Frequency [Hz] OLG OLG (IDL)
Figure 5: Control loop characterisation. Each frequency bin corresponds to a
sinusoidal injection. We split in the low and high frequency regime depending if the IDL data was used for the characterisation (see text for more details). The phase behaviour is a result of a delay caused by the conversion of data from the breadboard PM in the serial-to-MilBus converter. The low frequency measurement region is dominated by measurement error. Top: Frequency open loop gain . Bottom: Optical pathlength difference (OPD) open loop gain.
4. Summary
The OMS EM campaign discussed here was successfully implemented during the last three months of 2009. It was the first system level verification of all core OMS requirements and served well as a thorough preparation of the ongoing OMS FM campaign. It was also a major step in the definition and verification of all procedures needed to run the OMS in-flight, as well as testing of the on-ground data analysis
10−4 10−3 10−2 10−1 100 101 10−13 10−12 10−11 10−10 10−9 10−8 10−7 Displacement noise [m Hz −1/2 ] Frequency [Hz] x1 x12
Figure 6: Final performance for the longitudinal test mass position. The solid
line shows the linear spectral density (LSD) of the X1 interferometer. The dashed
line shows the LSD for the X12 interferometer. From top to bottom the three
requirements are: LPF mission goal, interferometer goal and for the contribution of each interferometric noise source.
with the custom designed LTPDA toolbox. Calibration and commissioning tests determined that the individual units function as required and that the calibration coefficients can be calculated and subsequently applied. Subsequently, the functional tests demonstrated that the OMS was able to track test mass motions in the longitudinal and angular degrees of freedom up to 100 µm and 300 µrad respectively. Additionally, tracking of large angular test mass deviations of up to 500 µrad was demonstrated. Tests were performed under both nominal and redundant conditions, as well as with non-nominal parameter sets. The non-nominal scenarios demonstrated the correct functioning of the error handling flags that indicate data quality. Finally, the three control loops were characterised and shown to operate as designed. The loops were closed and the overall performance of the system was shown to be below the requirement of 6.3 pm/√Hz for the longitudinal test mass position fluctuations. The angular fluctuations of test mass two met the requirement of 20 nrad/√Hz, the fluctuations of test mass one were slightly higher due to the use of unstable fibre injectors on the EM optical bench. The flight model of the optical bench has more stable monolithic fibre injectors and it is therefore expected that this effect will not be reproduced. Overall the engineering model test campaign has demonstrated that the OMS functions as required, both on individual unit level and as a whole. It has provided the opportunity to comprehensively verify system control and command in a realistic configuration.
10−4 10−3 10−2 10−1 100 101 10−10 10−9 10−8 10−7 10−6 10−5 10−4
Angular Noise [rad Hz
−1/2 ] Frequency [Hz] eta1 eta2 phi1 phi2
Figure 7: A plot of the final performance for the angular test mass position. Apart from some frequency regions of TM1 the LPF requirement is reached. The higher noise level for TM1 can be explained by fluctuations of non-stable components on the optical bench such as fibre injectors. These fluctuations are common-mode in both X1 and X12 interferometers and thus cancel when the angular signals for TM2 only (η2 and φ2) are calculated.
Acknowledgments
We gratefully acknowledge support by the Deutsches Zentrum f¨ur Luft-und Raumfahrt (DLR) (references 50 OQ 0501 and 50 OQ 0601) and the QUEST cluster of excellence, Leibniz Universit¨at Hannover.
References
[1] P Bender et al. Laser interferometer space antenna: a cornerstone mission for the observation of gravitational waves. Technical Report ESA-SCI(2000)11, ESA, 2000.
[2] M. Armano et al. LISA Pathfinder: The experiment and the route to LISA. Class. Quant. Grav., 26:094001, 2009.
[3] G. Heinzel, C. Braxmaier, R. Schilling, A. R¨udiger, D. Robertson, M. te Plate, V. Wand, K. Arai, U. Johann, and K. Danzmann. Interferometry for the LISA technology package (LTP) aboard SMART-2. Class. Quantum Grav., 20:153–161, 2003.
[4] G. Heinzel, V. Wand, A. Garc´ıa, O. Jennrich, C. Braxmaier, D. Robertson, K.Middleton, D. Hoyland, A. R¨udiger, R. Schilling, U. Johann, and K Danzmann. The LTP interferometer and Phasemeter. Class. Quantum Grav., 21:581–587, 2004.
[5] A M Cruise, D Hoyland, and S M Aston. Implementation of the phasemeter for LISA LTP. Classical and Quantum Gravity, 22(10):S165, 2005.
[6] J. A. Ortega-Ruiz, A. Conchillo, X. Xirgu, and C. Boatella. Mission Critical Software in LISA Pathfinder. AIP Conference Proceedings, 873(1):697–701, 2006.
[7] Walter Fichter, Peter Gath, Stefano Vitale, and Daniele Bortoluzzi. LISA Pathfinder drag-free control and system implications. Classical and Quantum Gravity, 22(10):S139, 2005.
[8] Robertson D et al. LTP interferometer - noise sources and performance. Class. Quantum Grav., 22:155–163, 2005.
[9] G Heinzel, C Braxmaier, M Caldwell, K Danzmann, F Draaisma, A Garcia, J Hough, O Jennrich, U Johann, C Killow, K Middleton, M te Plate, D Robertson, A Rudiger, R Schilling, F Steier, V Wand, and H Ward. Successful testing of the LISA Technology Package (LTP) interferometer engineering model. Classical and Quantum Gravity, 22(10):S149–S154, 2005. [10] Martin Hewitson et al. Data analysis for the LISA Technology Package. Class. Quant. Grav.,
26:094003, 2009.
[11] G. Hechenblaikner, R. Gerndt, U. Johann, P. Luetzow-Wentzky, V. Wand, H. Audley, K. Danzmann, A. Garcia-Marin, G. Heinzel, M. Nofrarias, and F. Steier. Coupling characterization and noise studies of the Optical Metrology System on-board the LISA Pathfinder Mission. Applied Optics, 49(30):221–226, October 2010.
[12] F Steier. Interferometry techniques for spaceborne gravitational wave detectors. PhD thesis, Leibniz Universit¨at Hannover, 2008.
[13] F Steier, F Guzm´an Cervantes, A F Garc´ıa Mar´ın, D Gerardi, G Heinzel, and K Danzmann. The end-to-end testbed of the optical metrology system on-board LISA Pathfinder. Classical and Quantum Gravity, 26(9):094010, 2009.
[14] A F Garc´ıa Mar´ın. Minimisation of optical pathlength noise for the detection of gravitational waves with the spaceborne laser interferometer LISA and LISA Pathfinder. PhD thesis, Leibniz Universit¨at Hannover, 2007.
[15] Hechenblaikner et al. Digital laser frequency control and phase-locked loops in a high precision space-borne metrology system. IEEE Journal of Quantum Electronics, 2010.
[16] Michael Tr¨obs and Gerhard Heinzel. Improved spectrum estimation from digitized time series on a logarithmic frequency axes. Measurement, 39:120–129, February 2006.