HAL Id: hal-01302512
https://hal.archives-ouvertes.fr/hal-01302512
Submitted on 14 Apr 2016
HAL is a multi-disciplinary open access
archive for the deposit and dissemination of
sci-entific research documents, whether they are
pub-lished or not. The documents may come from
teaching and research institutions in France or
abroad, or from public or private research centers.
L’archive ouverte pluridisciplinaire HAL, est
destinée au dépôt et à la diffusion de documents
scientifiques de niveau recherche, publiés ou non,
émanant des établissements d’enseignement et de
recherche français ou étrangers, des laboratoires
publics ou privés.
Combining LES of combustion chamber and an actuator
disk theory to predict combustion noise in a helicopter
engine
Thomas Livebardon, Stéphane Moreau, Laurent Y.M. Gicquel, Thierry
Poinsot, Eric Bouty
To cite this version:
Thomas Livebardon, Stéphane Moreau, Laurent Y.M. Gicquel, Thierry Poinsot, Eric Bouty.
Combining LES of combustion chamber and an actuator disk theory to predict
combus-tion noise in a helicopter engine.
Combustion and Flame, Elsevier, 2016, 165, pp.272-287.
Open Archive TOULOUSE Archive Ouverte (OATAO)
OATAO is an open access repository that collects the work of Toulouse researchers and
makes it freely available over the web where possible.
This is an author-deposited version published in :
http://oatao.univ-toulouse.fr/
Eprints ID : 15668
To link to this article
: DOI:10.1016/j.combustflame.2015.12.012
URL :
http://dx.doi.org/10.1016/j.combustflame.2015.12.012
To cite this version
:
Livebardon, Thomas and Moreau, Stéphane and Gicquel, Laurent
Y.M. and Poinsot, Thierry and Bouty, Eric Combining LES of
combustion chamber and an actuator disk theory to predict
combustion noise in a helicopter engine. (2016) Combustion and
Flame, vol. 165. pp. 272-287. ISSN 0010-2180
Any correspondence concerning this service should be sent to the repository
administrator:
staff-oatao@listes-diff.inp-toulouse.fr
Combining LES of combustion chamber and an actuator disk theory to
predict combustion noise in a helicopter engine
Thomas Livebardon
a,∗, Stéphane Moreau
b, Laurent Gicquel
c, Thierry Poinsot
d, Eric Bouty
eaCERFACS, Toulouse 31057, France
bUniversité de Sherbrooke, Sherbrooke, QC J1K 2R1, Canada cCERFACS, Toulouse 31057, France
dInstitut de Mécanique des Fluides de Toulouse, Toulouse 31400, France eTurbomeca S.A., Bordes 64511, France
Keywords:
Combustion noise Acoustics
Large Eddy Simulations
a b s t r a c t
A method to predict combustion noise in real aero-engines using Large Eddy Simulations (LES) of the combustion chamber coupled with an analytical approach to model the acoustic transmission of acoustic and entropy noise through the turbine stages is described. The proposed strategy is tested by compar-ing predictions of the computed noise with experimental results obtained for a full helicopter engine with high frequency pressure sensors located in the chamber and in all turbine stages. First, an exten-sive experimental database is used to localize the acoustic sources responsible for the “core-noise” by a three-sensor technique constituting the reference data against which predictions will be assessed. Second, LES of the combustion chamber for two representative operating points are achieved and discussed. The waves leaving the combustion chamber are extracted from these simulations at the outlet of the cham-ber, and an analytical method based on actuator disk theory and compact assumptions gives noise levels at the various turbine stages using the waves amplitudes at the chamber outlet. Excellent agreement is found at low frequencies between simulations and engine measurements. These results also confirm the importance of indirect combustion noise (due to entropy waves) generated in a helicopter turboshaft engine for the first time.
1. Introduction
Dwindling oil reserves and ACARE 2050 targets on noise and pollution challenge aerospace industry to design increasingly effi-cient and silent aero-engines. To meet such new challenges, turbu-lent and lean partially premixed combustion has emerged in recent aeronautical engine combustion chambers but it triggers unwanted effects such as thermo-acoustic instabilities and noise generation. For several decades, combustion noise has been known as a major contributor to the broadband noise generated by aircraft engines also called “core noise”. Current understanding decomposes com-bustion noise into two main noise sources:
• Direct combustion noise corresponds to the generation of acoustic waves by turbulent combustion within the chamber. • Indirect noise is the generation of downstream and upstream
acoustic waves due to the acceleration of temperature inhomo-geneities propagating through the turbine stages.
∗Corresponding author.
E-mail address:livebard@cerfacs.fr(T. Livebardon).
Indirect noise mechanisms were first described in[1–3], where one way coupling mechanisms between entropy spots and acous-tic waves due to a velocity gradient in a quasi-one-dimensional nozzle was established. Using a compact assumption (character-istic length of the nozzle being negligible compared with the wavelength of the low-frequency combustion noise), linearized jump relations linking entropy and acoustic fluctuations are writ-ten through the nozzle. More recently, different analytical meth-ods have been developed to remove the compact assumption in a quasi-one-dimensional case[4–6], taking into account arbitrary nozzle shapes [7] or shock waves. In the same manner, mod-eling of combustion-generated noise through turbine stages was addressed by Cumpsty and Marble [8] or Pickett [9], using the compact assumption and conservation laws between downstream and upstream sections of a turbine row. The low-frequency nature of combustion noise allowed considering only two-dimensional waves with no radial component. Thanks to this two-dimensional description, azimuthal modes, as well as flow deviation, could be considered. In practice, all these analytical methods and models must be validated using either numerical simulations or experi-mental databases.
Nomenclature
A characteristic tube section c mean local speed of sound cp specific heat at constant pressure
G cross-spectrum h enthalpy
H linear transfer function I rothalpy
k wave number kx axial wave number
K dimensionless wave number magnitude
K transfer matrix
Lp characteristic tube length
lc axial chord length
Li axial distance between rows
M Mach number ˙
m mass flow rate
Ns number of turbine blade rows
N uncorrelated noise in the frequency domain p pressure
Pr Prandtl number r specific gas constant R radius
s entropy
S signal emitted by a source in the frequency domain
S phase-shift transfer matrix T temperature
T transfer matrix of a blade row in a waveform U rotational velocity
v
absolute azimuthal velocityw absolute velocity magnitude
w wave
ˆ
w filtered wave
W noise signal in the frequency domain
W wave vector x axial component
X experimental signal in the frequency domain
α
azimuthal coordinateρ
densityγ
ratio of specific heatsǫ
transfer matrix of a blade row for primitive vari-ablesη
indirect to direct noise ratioω
pulsationθ
flow deviationν
kinematic viscosityυ
wave front angleλ
wavelengthÄ
ratio of wavelength to axial blade chordζ
dimensionless difference between total enthalpy and rothalpy within a blade rowt total state u upstream d downstream ′ fluctuation + upstream − downstream
DLR Deutsches Zentrum für Luft-und Raumfahrt LES Large Eddy Simulations
NASA National Aeronautics and Space Administration PSD power spectral density
In realistic aeronautical engines, measurements of core-noise are a challenge because of the harsh conditions found in com-bustion chambers and turbines stages. In this context, analytical models for acoustic generation-transmission in turbines were pri-marily based on a database provided by NASA [10]. Recently, in the Seventh European Framework of Programme for research, the Turboshaft Engine Exhaust Noise Identification (TEENI) project was dedicated to the location of acoustic sources in a realistic heli-copter engine covering the entire downstream section of a real en-gine from the combustion chamber to the exhaust with an iden-tification of sources in a radiated acoustic field issued by real op-erating conditions. To this end, TEENI partners developed sets of sensors for measuring and analyzing unsteady quantities in a full-scale engine.
Currently, numerical simulations are potential alternatives to real test cases. Large-Eddy Simulation (LES) techniques, coupled with the increase of computing power, are mature methods to pro-vide accurate compressible simulations of complex reacting tur-bulent flows. They have been successfully validated on academic and realistic burners, to retrieve mean statistical features, but also unsteady flow characteristics [11–15]. More precisely, LES is able to capture the strong interactions between turbulent structures and flames, which lead to acoustic wave generation. As such, it was used to study combustion instabilities within industrial and academic burners [16,17], demonstrating the efficiency of LES for combustion-generated noise. With such tools, Leyko [18]used an actuator disk theory [8]coupled with a LES of a turbulent reac-tive flow in an aero-engine to compute core-noise induced by a combustion chamber. Using also numerical simulations of a two-dimensional turbine stage, Leyko proved the ability of this analyt-ical method to predict indirect combustion noise generated by en-tropy fluctuations, the direct combustion noise generated through a stator[18]or a rotor[19]and through a complete turbine stage
[6]. In the same way, this actuator disk theory is investigated by comparing two-dimensional numerical simulations of a subsonic stator with an injection of entropy spots against analytical pre-dictions[20]showing the validity of this theory for low-frequency cut-on acoustic modes. Indirect noise has been thoroughly studied by DLR in an experiment called Entropy Wave Generator [21,22]
which has also been computed by many groups[23–25]. This ex-periment, however, is a single nozzle and misses many features of real engines so that, to date no actual industrial configuration has been tackled numerically or theoretically to assess the importance of combustion noise. In a first attempt to fill in this gap, the cur-rent study presents the TEENI data and a numerical tool to predict noise generated by a real helicopter engine. A complete descrip-tion of the TEENI experimental setup and main results are pre-sented in Section 2. Section3describes the hybrid method called CONOCHAIN coupling LES and analytical approach. LES results are detailed in Section4.1. Finally, Section4.2discusses the validation of the CONOCHAIN tool by comparing predictions with full-scale test results.
2. TEENI: a full-scale experimental test
2.1. Experimental setup
The experimental system is a fully instrumented helicopter en-gine shown in Fig. 1. The harsh conditions, in terms of tempera-ture and pressure especially in the combustion chamber, required dedicated original probe designs, developed by DLR (Berlin). Each pressure probe is a flush-mounted pin-hole apparatus with a re-mote microphone put perpendicular to a semi-infinite tube to limit standing wave effects [26]. To protect the microphone from hot combustion products, a cooling system injects a controlled air flow rate through the tube [27]. Temperature sensors are based on a
Fig. 1. Schematic of the real TEENI turboshaft engine.
Fig. 2. Sketch of TEENI experimental setup and location of unsteady pressure and
temperature probes.
twin thermocouple designed to be able to detect fluctuations up to 700 Hz.
To measure pressure and temperature fluctuations in each mod-ule of the engine from the combustor to the exhaust, several probes are mounted at different circumferential locations (Fig. 2):
• 2 pressure probes and 4 twin thermocouples are located in the combustion chamber (position A inFig. 2).
• 2 pressure probes and 2 twin thermocouples are placed be-tween the high-pressure turbine (HPT) and the power turbine (position B inFig. 2).
• 2 pressure probes located between the first and the second tur-bine stages of the power turtur-bine (position C inFig. 2).
• 30 pressure probes are present in an extended nozzle: 2 planes with 3 probes and 2 planes with 12 probes (position D in
Fig. 2).
For proper calibration, a complex transfer function is com-puted at ambient conditions for each remote pressure probe up to 4000 Hz [26]. The in-situ calibration has been achieved with a B&K Type-4228 pistonphone for each pressure probe without any cross-flow present but with the cooling tubes attached. Pressure fluctuations in the engine are recorded with a sampling frequency of 25.6 kHz whereas unsteady temperatures are recorded with a sampling frequency of 102.4 kHz. Unfortunately, the twin thermo-couples failed to provide reliable temperature fluctuations within the combustion chamber and the high-pressurized turbine. Data acquisition is performed at 7 different operating points from the
Table 1
Dimensionless combustion parameters at low and high powers. Dimensionless combustion parameters Operating points
Low High Engine power 310 kW 900 kW Stagnation temperature 0.8 1 Stagnation pressure 0.66 1 Fuel–air ratio 0.78 1 Mass flow rate 2.20 kg/s 3.25 kg/s
lowest power setting encountered in flight conditions to take-off power. Measurements are performed at stabilized operating points after a transitional phase to reach the engine thermal equilibrium. In this paper, only results relative to two operating points, at the lowest and highest powers, are presented. The combustion chamber parameters are detailed inTable 1. The dimensionless pa-rameters are referenced to the high-power settings.
2.2. Signal processing and experimental data exploitation 2.2.1. Power spectral density of pressure fluctuations
Power spectral densities (PSD) of pressure fluctuations at each location within the engine (Fig. 2) are given in Fig. 3for low and high power. In the combustion chamber, the acoustic activity is very similar for both power settings, exhibiting narrowband (
1
f = 140 Hz) as well as broadband (1
f = 1200 Hz) modulations(Fig. 3(a)). Both modulation patterns were identified: they corre-spond to acoustic resonances within the sensors, where the kine-matic viscosity decreases with pressure and leads to weak acous-tic damping. As the combustion chamber pressure is the highest within the engine, these resonances in the PSD of pressure fluctu-ations are mostly seen at station A (Fig. 3(a)). Details of an acoustic modeling of the pressure probes used in the experiment are pro-vided in the appendix.
Figure 3 (b) focuses on the high pressure turbine PSD levels. A difference of 5 dB is noted over the whole spectra obtained for the two operating points with a broadband hump up to 1500 Hz. Similarly to the combustion chamber, acoustic resonances are also visible in this section of the engine. Tonal peaks generated by the rotating shafts are also present in both plots (although more pro-nounced in the HPTFig. 3(b), the frequency shift between peaks being induced by the difference in rotating shaft speeds of the two operating conditions. These peaks are also visible in the power turbine PSD inFig 3(c), the difference between the two operating conditions being in the order of 2 dB. The PSD at the exhaust in
Fig 3(d), shows a 5 dB difference from 500 Hz to 4000 Hz, identi-cal acoustic levels being recorded below 500 Hz.
2.2.2. Three-sensor technique
Due to the broadband nature of combustion noise, characteriza-tion of its contribucharacteriza-tion in the core noise requires broadband-noise breakdown techniques. Indeed, each signal X results from a sig-nal emitted by a source S through a linear transfer function H and an added uncorrelated noise N. In frequency domain, X is equal to H · S + N. In the scope of combustion noise, the aim is to identify the acoustic power produced within the engine correlated with the acoustic power radiated at the outlet. The first way is to compute coherence spectra between any pressure probe signal in the engine and an exhaust sensor signal. Yet, this method does not yield sig-nificant coherence levels, the correlation being lost because of the high uncorrelated turbulent levels at the exhaust. To enhance the signal-to-noise ratio, a technique based on averaged cross-spectra between three sensors is applied[28–31]. Its objective is to obtain the coherent power emitted by an acoustic source S within the en-gine without contributions of uncorrelated noise and radiated at
(a) Combustion Chamber (A) (b) High Pressure Turbine (B)
(c) Power turbine (C) (d) Exhaust (D)
Fig. 3. PSD of pressure fluctuations at maximum power ( ) and minimum power measured (– – –) in different locations within the engine.
the exhaust. From the combustion chamber to the power turbines at each location defined inFig. 2, the two pressure probes (noted with the subscripts 1 and 2, respectively) are combined with a ref-erence probe at the exhaust (noted with the subscript 3). Averaged cross-spectra between these signals are
G12= H1· H2∗· S · S∗, (1)
G23 = H2· H3∗· S · S∗, (2)
G31= H3· H1∗· S · S∗. (3)
Note that these cross-spectra are not impacted by power pro-vided by uncorrelated noise. The coherent power of the source S can thus be recovered and follows for the exhaust probe
GS3=
G23· G31
G12 = H3· H ∗
3· S · S∗. (4)
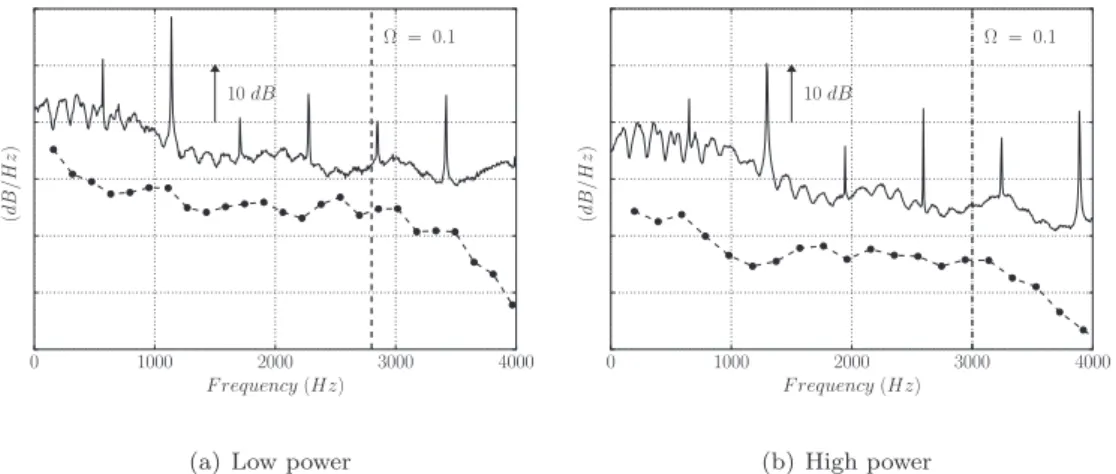
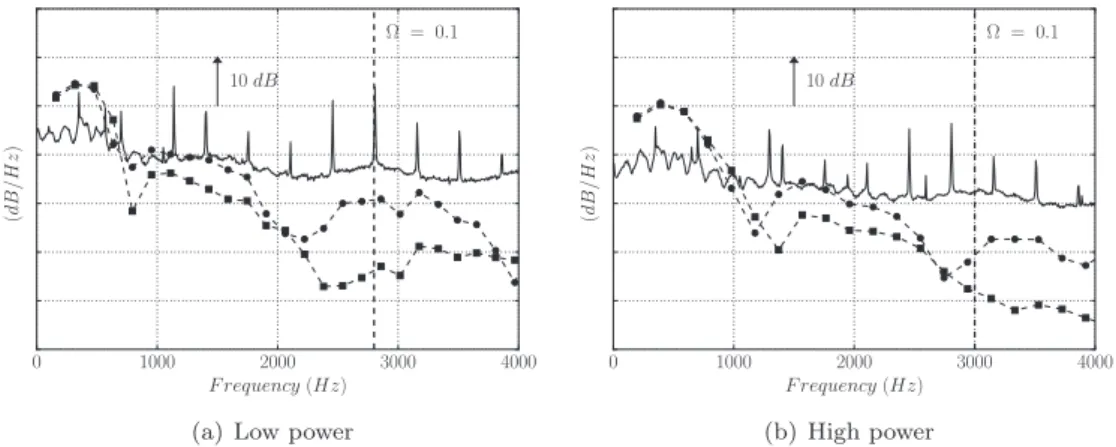
Finally, applying the three-sensor technique between an exhaust pressure probe and each pair of probes located either in the com-bustion chamber or in the high pressure turbine or in the power turbine, localization of broadband noise generation radiated in the exhaust is available. Using this method for probes located in the combustion chamber yields a narrow-band coherent PSD close to 200 Hz as evidenced in Fig. 4 for both operating points. On the contrary, this technique shows a global increase of coherent PSD in the range [200 Hz, 1000 Hz] inFig. 5, which is emphasized at the high power setting. Furthermore, no change is detected in the generation of added coherent PSD in [0 Hz, 4000 Hz] in the power turbine compared with the high pressure turbine as seen inFig. 6. However, cross-correlations between pressure fluctuations at any location in the whole engine or unsteady temperature measured
by twin-thermocouples in the combustion chamber and the high-pressure turbine did not provide any noticeable results to directly conclude on acoustic waves generated by entropy spots. In sum-mary, the three-sensor technique reveals a significant narrow di-rect combustion noise component around 200 Hz generated in the combustion chamber, and a broadband hump up to 1500 Hz at-tributed to broadband noise generated by the HPT which could be indirect combustion noise.
3. Combustion noise prediction: CONOCHAIN methodology
The full simulation of core noise and its propagation through the turbine stages is currently out of reach in terms of computa-tional cost. However, in order to predict combustion noise genera-tion, LES is a necessary tool to correctly predict entropy, vorticity and acoustic waves generated by the turbulent combustion pro-cess. This step is highlighted inSection 3.1. As combustion noise is low frequency and therefore corresponds to wavelengths much larger than the blade chords and heights, acoustic generation and propagation through turbine stages can be described with a two-dimensional compact actuator disk theory dealt withSection 3.2. This analytical method is termed CHORUS. The combination of LES simulations and CHORUS is the CONOCHAIN methodology (Fig. 7). Flow variables are extracted from LES at several planes perpen-dicular to the engine axis at the exit of the combustion chamber (planes P inFig. 7). They yield the primitive dimensionless fluctu-ating variables used in Cumpsty and Marble’s model[8]:
• entropy (s′/Cp)
• velocity magnitude (w′/c) • pressure (p′/
γ
p)(a) Low Power (b) High Power
Fig. 4. PSD of the three-sensor technique applied between the combustion chamber and the exhaust (– – –) and PSD of pressure fluctuations of the reference probe ( ).
(a) Low Power (b) High Power
Fig. 5. PSDof the three-sensor technique applied between the HPT and the exhaust (– – –) and PSD of pressure fluctuations of the reference probe ( ).
(a) Low Power (b) High Power
Fig. 6. PSD of the three-sensor technique applied between the power turbine and the exhaust (– – –) and PSD of pressure fluctuations of the reference probe ( ).
By assuming time harmonic fluctuations, these primitive vari-ables are combined to build upstream and downstream propagat-ing acoustic waves (w+and w−), entropy waves (ws) and vorticity
waves (wv). Thus, each wave is written as follows: w =
|
w|
exp³
iω
³
t −1cK
(
cosν
+ sinν
)
´´
(5) where K is a dimensionless wave number magnitude and
ν
the wave front angle with respect to the engine axis. The whole pro-cess can be summarized by the following steps[6,18,19]:• Instantaneous LES solutions are interpolated over planes at the outlet of the combustion chamber (typically 500 to 1000 snap-shots) as shown in Fig. 7. Primitive variables denoted by f′
are radially averaged and decomposed using temporal Fourier
transform, namely f′
(
R,α
,t)
→ ˆf′(
α
,t)
|
{z
}
Radial average (6) and F′(
α
,ω
)
= 1 tLES ZtLES 0 ˆf′(
α
,t)
e−iωtdt|
{z
}
Temporal Fourier trans f orm
(7)
where tLESis the duration of the productive simulation and F′is
the primitive variable f′in the frequency domain. Radial
averag-ing is used to extract the zeroth radial mode from the unsteady fields at the chamber exit. This mode is the only one which can be handled by the two-dimensional actuator disk theory.
Fig. 7. Sketch of the CONOCHAIN methodology.
Spatial Fourier transform over the azimuthal direction bounded by the angular extrema
α
min andα
max then allows performingan azimuthal modal decomposition where m is the azimuthal mode index, namely
F′
(
m,ω
)
=α
1 max−α
min Z αmax αmin F′(
α
,ω
)
e−imαdα
.|
{z
}
Azimuthal Fourier trans f orm
(8)
Using Eq. (8) and the energy conservation in terms of signal power ensured by Parseval’s theorem, the relative contribution of the azimuthal mode F′
(
m,ω
)
is evaluated withF′
(
m,ω
)
2 1 αmax−αmin Rαmax αmin F′(
α
,ω
)
2dα
. (9)• Dispersion relations, derived from two-dimensional linearized Euler equations, allow building primitive variables in a wave-form
s′/Cp w′/c p′/γ
pθ
′
= [K]
ws wv w+ w−
(10)where the matrix K is defined as follows:
1 0 0 0 0 −isin(υv−θ ) Kv K+cos(θ−υ+) 1−K+Mcos(υ+−θ ) K−cos(θ−υ−) 1−K−Mcos(υ−−θ ) 0 0 1 1 0 icos(υv−θ ) KvM K+sin(υ+−θ ) 1−K+Mcos(υ+−θ ) K−sin(υ−−θ ) 1−K−Mcos(υ−−θ )
. (11)• The waves w are filtered at the exit of the combustion cham-ber using the set of Nplanes interpolating planes to extract the propagating components[32], namely
ˆ w =N1 planes Nplanes X i=1 wiexp
(
−iKxi)
. (12)• Using this wave decomposition and an extension of the actu-ator disk theory[8], CHORUS propagates these waves through turbine stages and computes acoustic power attributed to di-rect and indidi-rect combustion noise at several locations in a real turbine (Fig. 8).
3.1. LES solver
Two LES have been performed using the AVBP solver[33]. AVBP runs on massively parallel schemes to solve the compressible re-acting Navier–Stokes equations. To limit the computational cost, only one sector is simulated. AVBP uses unstructured grids with
Fig. 8. Sketch of the actuator disk theory applied on turbine stage.
the TTG scheme that has a third order spatial and temporal accu-racy[34]. Subgrid scale stresses are described by the Smagorinksy model [35] while the dynamic thickened flame model is used to model the flame/turbulence interactions [36–38]. Kerosene/air chemistry is modeled using a synthetic surrogate coupled with a reduced mechanism involving 6 species and 2 reactions[39]. Re-action rates are modeled by Arrhenius laws[38], where the pre-exponential constants are fitted in rich regimes to recover proper laminar flame speeds. The unstructured mesh considered in this study contains 12 million tetrahedral elements, the primary zone of the combustor being described with mesh element sizes close to 0.5 mm. Previous numerical simulations of this combustion chamber were performed to investigate the acoustic coupling be-tween the unsteady flame and the system acoustic eigenmodes
[17]based on a similar methodology. Since the objective is to com-pute waves leaving the chamber to enter the turbine, boundary conditions require specific treatments to handle the unsteady flow features. In AVBP, the Navier Stokes Characteristic Boundary Con-ditions (NSCBC) method is implemented[40,41]decomposing each variation of the flow variables on the boundaries into ingoing and outgoing waves. In these computations, the NSCBC treatment is only applied at the inlet where the mass flow rate and the flow temperature are known, while wall-law adiabatic conditions are imposed at all walls of the chamber. To mimic the choked stator of the high pressure turbine, a nozzle is added at the chamber out-let to keep the curvilinear variation of normal surface through the row. The throat section of the nozzle matches the section of the real HPT stator used experimentally. Since the throat is choked, no additional boundary condition is needed at the chamber outlet.
3.2. CHORUS: an analytical model of acoustic propagation and generation of core-noise in a turbine
CHORUS computes the acoustic propagation and generation of indirect combustion noise induced by non-homogeneous flows through turbine blades based on the actuator disk theory [8] re-cently revisited by Moreau and co-workers[6,19,42–44]. The flow can be considered two-dimensional, inviscid and isentropic in a blade-to-blade plane (blades heights are assumed small). Fluctu-ations of flow variables are assumed to be small compared with mean values: the conservation equations of mass, entropy and stagnation temperature through a stator. In the case of a rotor, stagnation temperature conservation is replaced by the rothalpy conservation. A last relation is given by Kutta’s condition at the trailing edge of the blades. The set of resulting equations used in
CHORUS reads
µ
˙ m′ ˙ m
u =µ
˙ m′ ˙ m
d (13)µ
s′ cp
u =µ
s′ cp
d (14)µ
T′ t Tt
u =µ
T′ t Tt
d (15)¡
θ
′¢
u =β
¡
θ
′¢
d (16)for a stator and
µ
˙ m′ ˙ m
u =µ
˙ m′ ˙ m
d (17)µ
s′ cp
u =µ
s′ cp
d (18)µ
I′ t It
u =µ
I′ t It
d (19)¡
θ
′¢
u =β
¡
θ
′¢
d (20)for a rotor. These jump conditions can be written in terms of the fluctuations of the primitive variables:
µ
˙ m′ ˙ m
= p ′γ
p+ 1 M w′ c −θ
′tanθ
(21)µ
T′ t Tt
= 1 1 +(γ−1) 2 M2·
(
γ
− 1)
p′γ
p+ s′ cp+(
γ
− 1)
Mw′ c¸
(22)µ
I′ t It
= 1 −1ζ
·
T′ t Tt −ζ
µ
1 M w′ c +θ
′ tanθ
¶¸
(23) whereζ
=Uvht. Thus, these equations can be written in a matrix
form. For a row i:
£
ǫ
i u¤
s′/Cp w′/c p′/γ
pθ
′
i u =£
ǫ
i d¤
s′/Cp w′/c p′/γ
pθ
′
i d (24) where [ǫ
i] is£
ǫ
i¤
=
1 0 0 0 −1µ M1i 1 − tanθ
i i γ−1µ
iMiµ
i 0 0 0 0β
i
,µ
i=³
1 +γ
− 12 M2 i´
and Mi= wi ci (25) Using the matrix Ki defined in Eq. (10), the matrix product,Eq. (24), becomes
£
ǫ
i u¤£
Kiu¤
ws wv w+ w−
i u =£
ǫ
i d¤£
Kid¤
ws wv w+ w−
i d , (26)£
Tiu¤
Wiu=£
Tid¤
Widwith£
Ti¤
=£
ǫ
i¤£
Ki¤
and Wi=
ws wv w+ w−
i (27)Note finally that to take into account the fact that wave propa-gation occurs between the rows of the turbine, phase shifts based on the wave travel times between rows are computed. Even though stators and rotors are assumed to be compact, these travel times between rotors and stators make the formulation frequency depen-dent. The combination of consecutive blade rows leads to matrix product giving a transfer function for each computed wave. For the case of multiple blade rows, the phase-shift of the waves through the blade-row spacing is taken into account. This is done using the matrix [S], in which the diagonal terms are the phase-shift of the waves, namely
£
Si¤
=
exp(
−iksxLi)
0 0 0 0 exp(
−ikv xLi)
0 0 0 0 exp(
−ik+ xLi)
0 0 0 0 exp(
−ik− xLi)
. (28) The downstream waves vector Wid is related to the follow-ing blade row through Wi+1u =£
Si
¤
Wid. Combining the successive stages of the turbine, a relation between the inlet and the outlet waves of the turbine can be written in a matrix form, giving"
N s−1 Y i=1¡£
Ti+1 u¤£
Si¤£
Ti d¤¢
#
£
T1 u¤
.W1u=£
TNs d¤
WNs d. (29)As a result, CHORUS allows discriminating noise generated by entropy, vorticity as well as acoustic waves propagated through any number of turbine stages. Finally, Welsh’s periodogram is used to compute the power spectral density of the acoustic pressure at the outlet of any turbine stage that takes into account the convec-tive terms[45].
CHORUS was validated on canonical test cases: two-dimensional LES were first performed to mimic acoustic generation in a stator[18,44]by plane entropy waves, and compared with the CHORUS method. Good agreement was found between analytical and computed acoustic transfer functions. Entropy to acoustic transfer functions was found to depend on the scattering of the normal entropy wave to higher-order modes through the stator because of a non-uniform convective velocity through the blade rows. Indeed, turbulence mixing induced by the turbine blades generates a planar wave distortion and a damping of entropy waves through the first stages and no more indirect noise gener-ation in the last stages. To take into account this low-pass filter behavior of the turbine stages, a scaling function was implemented based on the characteristic pitch of a blade row. The impact of this transfer function on numerical predictions will be discussed in
Section 4.2. Validations of acoustic and entropy transfer functions through a rotor and a stator-rotor configuration were addressed in[19,43]. Under the compact assumption, all these studies show the ability of the analytical method to predict acoustic generation through a complete turbine stage at low frequency. Comparisons with the present experimental database (Section 2) are provided in the following sections.
4. CONOCHAIN results and discussion
CONOCHAIN is applied here to the TEENI engine. Combustion LES results are first presented in Section 4.1, before describing CHORUS results for noise inSection 4.2.
4.1. Combustion chamber LES results 4.1.1. Mean flow predictions
The computed combustion chamber is shown inFig. 9. Pressur-ized air is injected from the compressor through the air inlet in
Fig. 9. Numerical domain for the LES and cutting planes locations over an axial
section of the combustion chamber.
Fig. 10. Mean dimensionless temperatureTmean−Tinlet
Tadiab−Tinlet with an isoline of stoichiometric
mixture fraction in plane11(Fig. 9).
Fig. 11. Mean dimensionless velocity magnitude u
Uinlet with white contours of mean
heat release (W/m3) in plane1 1(Fig. 9).
the casing. In a real engine, liquid fuel is injected through injec-tors where it is atomized and vaporized. In these simulations, fuel is injected in gaseous phase close to the vaporizing zone at the lips of the injector. Taking into account the liquid spray of kerosene can impact the thermo-acoustic activity in Rich Quench Lean burn-ers where evaporation and atomization characteristic times can modify the acoustic flame response[46,47]. Nevertheless, for these regimes, the atomization and the vaporization zones of the in-jected liquid fuel are very small and gaseous computations are suf-ficient to capture acoustic behavior of this combustion chamber
[17]. Dilution holes ensure homogenization of burnt gases and a re-duced mean temperature at the outlet of the combustion chamber. To ensure thermal wall protection, multi-perforated plates are po-sitioned near the primary zone to generate local effusion cooling. Contrary to the dilution holes which are resolved, multi-perforated
Fig. 12. Streamlines of the mean velocity vectors projected over the plane 11
(Fig. 9).
Fig. 13. Instantaneous dimensionless temperature field T −Tinlet
Tadiab−Tinlet at high power in
plane11(Fig. 9).
Fig. 14. Instantaneous dimensionless temperature fluctuation field T −Tmean
max(T −Tmean) at
high power in plane12(Fig. 9).
plates are modeled using a homogenized model that takes into ac-count the mass flow rate across the plate[48].Figure 10shows the dimensionless mean temperature field (according to the inlet tem-perature in the combustion chamber and the stoichiometric adi-abatic flame temperature at these regimes) for the two operating points (Table 1) in the meridional plane
1
1(Fig. 9), with an isolineof stoichiometric fuel concentration. The variation of fuel-to-air ra-tio between these two simulara-tions explains the difference of fuel and mean temperature distributions in the combustion chamber.
Figure 11displays mean velocity fields (magnitude) for the low and high power cases: the mean velocity magnitudes are normal-ized by the mean inlet velocities which are identical in both cases.
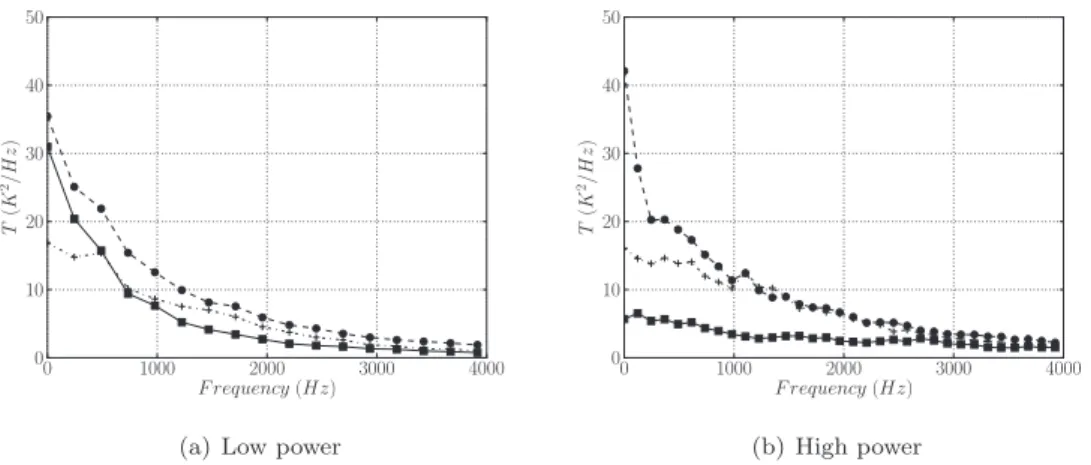
(a) Low power (b) High power
Fig. 15. Power spectral densities of unsteady temperature (K2/Hz) in flame tube – plane 1 (¥), plane 2 (•) and plane 3 (+) inFig. 13.
(a) Low power (b) High power
Fig. 16. Power spectral densities of pressure fluctuations (position A inFig. 7) – LES (– • –) Experiment ( ).
The flame (visualized by white isolines of heat release) is stabilized at the swirler outlet in a low velocity recirculation zone induced by the swirling flow close to the lips of the swirler as well as by the dilution jet flows. The upper jet flow feeds the largest recirculation zone (Fig. 12) which leads to the slight asymmetry (with respect to injector axis) in the stoichiometric fuel fraction and the mean heat release. Spatial distributions of mean heat release in Fig. 11show two main combustion regions, near the lips of the injector separa-tor and close to the dilution holes. As expected, a larger and more spread-out heat release distribution is observed for the high power condition similarly to the isoline of stoichiometric fuel fraction. 4.1.2. Unsteady activity in the combustor
Combustion noise is due to the the acoustic waves generated by the unsteady heat release within the combustor (direct noise) and is also linked to the generation of entropy spots as well as vorticity waves (indirect noise). An unsteady analysis of LES results is therefore required before applying CHORUS.
Instantaneous dimensionless temperature fields are shown in
Figs. 13and14in a meridional plane
1
1and a cylindrical plane1
2respectively. Both show significant temperature fluctuations gener-ated by the turbulent combustion process and a strong stratifica-tion after the dilustratifica-tion holes with the formastratifica-tion of entropy spots. The largest temperature fluctuations occur in the second half of the flame tube where the dilution jets impact the gases leaving the primary zone. More quantitative results are obtained by the PSD of numerical temperature fluctuations over several planes defined in
Fig. 13. The first plane is placed between the end of recirculation zone, the injector and the dilution holes while the second plane is located just after the dilution holes. Finally, a last plane is located before the flame tube starts turning.Fig. 10showed that the mean
Fig. 17. Coherence signals between unsteady global heat release and a pressure
probe at the outlet of the combustion chamber (plane P inFig. 7) – low power (– – –) and high power ( ).
temperature decreases from the combustion zone to the exit of the flame tube. However, the PSD levels of the temperature fluctua-tions increase from the plane 1 to 2 more importantly for the high power case. Furthermore, RMS temperature levels show that tem-perature spots are mainly generated by the dilution and cooling devices of the combustion chamber, confirming the fields shown inFigs. 13and14. PSD levels found in plane 3 in both cases show that the amplitude of temperature fluctuations do not depend on the operating point for which the mean velocity field is not modi-fied (Fig. 15).
PSD of numerical and experimental pressure fluctuations at location A in Fig. 9 are plotted in Fig. 16. The levels are well-predicted by the simulation for both power settings not only
Fig. 18. Normalized modal PSD of pressure at the outlet of the combustion chamber (plane P inFig. 7) usingEq. (9).
Fig. 19. Normalized modal PSD of entropy at the outlet of the combustion chamber (plane P inFig. 7) usingEq. (9).
in magnitude but also in shape. The experimental oscillations are again caused by the response of the remote microphone probe as explained in the appendix. Note that there are very few examples of LES applied to real engine data and that Fig. 16is one of the first quantitative demonstrations of LES capacities to predict noise within a real engine chamber.
Based on these LES, the dependence of the unsteady heat re-lease on the combustor pressure fluctuations is highlighted by co-herence spectra inFig. 17for the two operating conditions: as ex-pected, wall pressure fluctuations are coupled with the global heat release in the chamber. Direct noise is dominant in the chamber. 4.2. Combustion noise evaluation
The CONOCHAIN method presented in Section 3.2 is now ap-plied to the LES fields for the low and high power cases.
4.2.1. CHORUS post-processing in the combustion chamber
Low-frequency properties of combustion noise require LES to be computed for a long duration (80 ms) as well as numerous instan-taneous solutions to ensure an appropriate sampling frequency. For the CHORUS analysis, instantaneous flow solutions are extracted at a 50 kHz sample rate to extract primitive variables over several outlet planes P (Fig. 7). A modal decomposition of the pressure or entropy fields over one plane (most downstream plane P inFig. 7) at the outlet of the combustor is shown inFigs. 18and19, respec-tively.
As only one sector is computed, the first plane wave is suffi-cient to describe the pressure field. In contrast, the entropy field is a composition of several modes even if only the first planar mode will be considered in the following results. Indeed, the analytical
Fig. 20. Attenuation transfer function applied on entropy wave through the turbine
at high power – position B (), position C (¥), and position D (•) inFig. 2.
model CHORUS is based on a mode-matching technique and the acoustic modes generated by the higher entropy modes cannot be propagated through the turbine stages because the first circumfer-ential mode corresponds to the first multiple of the number of sec-tor with a cut-off frequency out of the frequency range of interest. The difference of level close to 500 Hz between the energy carried by entropy modes 1 and −1 is found to be caused by the mean azimuthal velocity at the outlet of the combustion chamber, itself induced by the multi-perforated plates and the swirling flow mo-tion in the flame tube.
The remaining part of this section deals with the PSD of acous-tic pressure computed by the analyacous-tical method CHORUS at each experimental probe location and compared with experimental PSD.
(a) Low power (b) High power
Fig. 21. Computed direct noise (•) and experimental PSD of pressure fluctuations ( ) in the HPT position B inFig. 2).
(a) Low power (b) High power
Fig. 22. Computed indirect noise with entropy conservation (¥) through the stage and without the attenuation function (•) and experimental PSD of pressure fluctuations
( ) in the HPT (position B inFig. 2).
(a) Low power (b) High power
Fig. 23. Computed direct noise (•) and experimental PSD of pressure fluctuations ( ) in the power turbine (position C inFig. 2).
As indicated in Section 3.2, the attenuation of the entropy wave induced by the different turbine stages is taken into account with the transfer functions computed with the thermodynamic condi-tions encountered in the TEENI turbine and plotted inFig. 20. Tur-bine rows are similar to low-pass filters and the increase of turTur-bine stages leads to an important loss of entropy signal above 2000 Hz. Indeed, the attenuation of plane entropy wave is a scattering pro-cess of energy into higher modes that it is not included in the disk actuator theory. Finally, scaling of each transfer function is based on a reference case corresponding to entropy wave propaga-tion through a turbine stage[6,19]at a given operating point based on the upstream mean velocity for each turbine row. For all these
reasons, the large variations of thermodynamic conditions encoun-tered in a real turbine can lead to slight differences between real attenuation transfer functions and the ones used in these compu-tations.
4.2.2. High pressure turbine
Figure 21 shows the contribution of direct noise compared with the PSD levels of pressure fluctuations measured in the HPT (seeFig. 2). The compact assumption limits the comparison below 3000 Hz in the acoustic case (
λ
>10lc which corresponds to are-duced frequency
Ä
= lcλ < 0.1).Figure 21confirms that the direct
(a) Low power (b) High power
Fig. 24. Computed indirect noise with entropy conservation (¥) through the stage and without the attenuation function (•) and experimental PSD of pressure fluctuations
( ) in the power turbine (position C inFig. 2).
(a) Low power (b) High power
Fig. 25. Computed direct noise (•) and experimental PSD of pressure fluctuations ( ) in the exhaust (position D inFig. 2).
(a) Low power (b) High power
Fig. 26. Computed indirect noise with entropy conservation (¥) through the stage and without the attenuation function (•) and experimental PSD of pressure fluctuations
( ) in the exhaust (position D inFig. 2).
weak contribution of vorticity waves to the indirect noise is found and consequently, only indirect noise induced by entropy waves is considered.
Figure 22 shows that the indirect noise generated by entropy waves going through the HPT stage is larger than direct noise even when an attenuation factor is used for entropy waves. Fur-thermore, the large experimental hump in PSD spectra at low fre-quency is correctly predicted both in terms of magnitude and pat-tern. Propagation of entropy waves through only two turbine rows did not show an important impact of the attenuation transfer tion below 1000 Hz as suggested by the attenuation-transfer func-tion plotted inFig. 20. The predicted indirect noise humps are cen-tered around 500 Hz where the entropy plane mode induced by
the combustion chamber topology contribute the most (Fig. 19). Indirect noise is a major contributor to the total engine-radiated noise for this case. Furthermore, the low-frequency activity mea-sured experimentally is correctly predicted both in terms of mag-nitude and pattern by CONOCHAIN.
4.2.3. Power turbine
As in the HPT, the direct noise predicted by CONOCHAIN is lower than the pressure fluctuations measured in the power tur-bine (Fig. 23). Computed indirect combustion is over-predicted by 6 dB in both cases (Fig. 24) below 1000 Hz. Resonances between successive turbine rows can occur and yield these low-frequency humps. Above 1000 Hz, the larger impact of the transfer function
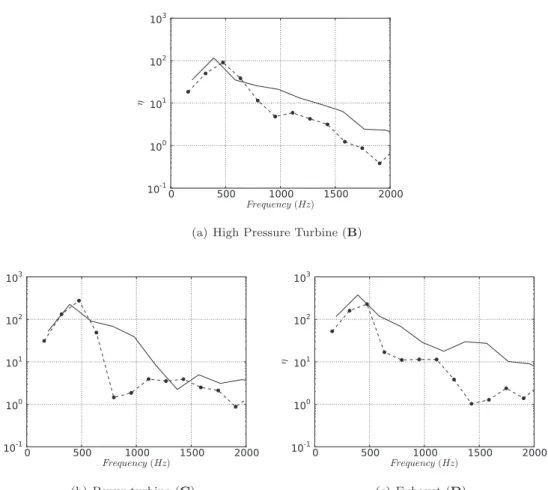
(a) High Pressure Turbine (B)
(b) Power turbine (C) (c) Exhaust (D)
Fig. 27. Indirect to direct noise ratiosηat maximum power ( ) and minimum power (– • –) measured in different locations within the engine.
of entropy attenuation on the computed PSD should be noted in-duced by the succession of turbine rows increases the scattering of the entropy planar mode.
4.2.4. Exhaust
At the exhaust, direct noise is definitely not an important con-tributor to the radiated total noise of the engine. The predicted magnitudes for direct noise in Fig. 25 are 5–10 dB lower than experimentally measured pressure fluctuations. The narrow-band experimental component found in the experiment at 200 Hz and attributed to the direct combustion noise is not present in the LES. By computing only a single sector of the annular combus-tion chamber, the acoustic field obtained with the LES is truncated which can explain the low levels of predicted direct combustion noise levels. Computed indirect noise with the entropy conserva-tion through turbine stages is impacted by acoustic longitudinal resonances between the turbine rows in both cases (Fig. 26). At low power, computed indirect noise with the attenuation func-tion matches the experimental PSD in the exhaust below 2000 Hz whereas computed indirect noise with the entropy wave conserva-tion is 10 dB over-estimated. For the high power operating point, a slight difference occurs between computed indirect noise with the attenuation function and the experimental PSD below 1000 Hz. As mentioned in the previous paragraph, this difference can be at-tributed to acoustic resonances within the turbine or an under-predicted attenuation of the entropy planar mode at very low-frequency. For instance, the tone at 1100 Hz comes from turbines rotating shafts. Above 1500 Hz, numerical results do not lie on the experimental values.
4.3. Ratio of indirect noise to direct noise
The ratios of indirect-to-direct noise inFig. 27 emphasizes the importance of indirect noise in the overall radiated core-noise. For both power settings, the patterns are very similar. Indirect-to-direct noise ratios below 2000 Hz is close to 10 in the HPT and the power turbine (Fig. 27(a) and (c)) and grows up to 100 in the exhaust. The slight difference in the exhaust (Fig. 27(c)) is mainly caused by different mean thermodynamic conditions in the tur-bine stages between the two operating points inducing different entropy planar mode scatterings.
5. Conclusions
The core-noise produced by a turboshaft engine has been inves-tigated both experimentally and numerically within the European Project Framework TEENI.
Measurements in an actual turboshaft engine show for the first time that direct noise, generated by the acoustic activity within the combustion chamber and propagated through the turbine stages, corresponds to a narrowband peak close to 200 Hz in the over-all radiated noise. Indirect core noise, induced by the accelera-tion of entropy and vorticity waves through the turbine stages, is mainly generated by the high-pressure turbine and characterized by a broadband hump up to 1500 Hz.
In parallel, the CONOCHAIN methodology is applied to the ac-tual experimental configuration to evaluate its ability to predict the combustion noise generated by a helicopter engine. Mechanisms responsible for combustion noise generation have been identified using full-gaseous reactive and turbulent LES of a single-sector of the annular combustion chamber. On the one hand, unsteady
combustion due to flame oscillations in the first section of the combustion chamber is found to be the main source of pres-sure fluctuations in the combustor that are correctly predict by LES. It yields the direct combustion noise. On the other hand, en-tropy spots are mainly generated by dilution devices located fur-ther downstream the chamber primary zone without much accel-eration. Nevertheless, computing only a single-sector of a combus-tion chamber can impact the acoustic activity where the acoustic longitudinal modes are dominant and the spatial decomposition of the flow variables at the combustor exit to feed the actuator disk theory for which only planar modes are considered.
The analytical model mimicking the combustion-noise genera-tion within turbine stages and proposed by Cumpsty and Marble
[8], further developed by Leyko in a stator vane[44]and numeri-cally validated by Duran in a full turbine-stage cascade[43]is also applied to this actual engine and directly compared with experi-mental pressure fluctuations spectra for two operating points.
This coupled LES computation of the combustion chamber in the CONOCHAIN hybrid method shows the dominant role of in-direct combustion noise in a turboshaft engine for the first time. Narrow-band contribution attributed to direct noise at 200 Hz in the experiment was not captured by LES in which predicted di-rect noise levels are found to be very low. Experimental broadband noise generation in the high-pressurized turbine can be related to entropy noise in the light of CONOCHAIN results. More gener-ally, CONOCHAIN tool provides a reasonable estimation of broad-band noise in the turbine stages below 1500 Hz. The results also show the importance of entropy wave dispersion caused by tur-bine stages on the indirect combustion noise magnitude. Even if the transfer function applied to the entropy wave level to mimic this mechanism might not be well-adapted for the whole turbine, the conservation of entropy fluctuation through a row as proposed by Cumpsty and Marble[8]is not an acceptable assumption when several turbine stages are considered and yields significant over-prediction of the indirect-to-direct noise ratio. A model for entropy waves attenuation is required. Finally, indirect noise induced by entropy waves is identified as a major contributor to the radiated core-noise below 1500 Hz contrary to direct noise which is found negligible.
Acknowledgments
The authors would like to thank Karsten Knobloch and Ben-jamin Pardowitz from the DLR for providing the TEENI internal data, GENCI (Grand Equipement National de Calcul Intensif) and IDRIS (Institut du Developpement et des Ressources en Informa-tique Scientifique) for providing part of the computing power nec-essary for these simulations. The support ofANRT/CIFRE is also ac-knowledged. This work was funded by Turbomeca.
Appendix A. Analytical transfer function of experimental pressure probe in harsh conditions
An analytical model to mimic the acoustic response of the ex-perimental pressure probe used in the TEENI experiment is pre-sented (Fig. 28). It is based on one-dimensional propagation in junction tubes[49] and is similar to what has been used for re-mote microphone probes in[26,50,51].
A.1. Sketch of the sensor
The remote microphone is cooled by a controlled air flow in-jected from 3. The mass flow rate is set to ensure an efficient cool-ing and avoid noise generation. Along each pipe an x-coordinate with a positive direction outwards from 2 is defined.
Fig. 28. Sketch of a pressure probe.
A.2. Acoustic modeling
No mean flow is considered in the sensor because the outlet 3 is closed. Mean temperature and mean pressure are assumed to be equal to the inlet combustion chamber values. Acoustic perturba-tions are supposed one-dimensional and harmonic. Thus, acoustic pressure fluctuation p′ is written as
p′
(
x, t)
= p+ei(ωt−k+x)+ p−ei(ωt+k−x)with k =
ω
c0
(30) and the associated acoustic velocity fluctuation u′is
u′
(
x, t)
= 1ρ
0c¡
p+ei(ωt−k+x) − p−ei(ωt+k−x)¢
(31) The analytical transfer function is computed between the acoustic pressure in 4 and the acoustic pressure in 1. Closed ends are considered in 3 and 4 to set infinite acoustic impedances. In 2, a compact T-junction gives pressure and velocity jump conditions using mass and pressure conservation. These conditions provide a set of six equationsp′ I
(
0, t)
= p′II (32) p′ I(
0, t)
= p′III (33) u′ I(
0, t)
.SI+ u′II(
0, t)
.SII+ u′III(
0, t)
.SIII= 0 (34) p′ I(
lI,t)
= 1 (35) p′ II(
lII,t)
= Z3u′II(
lII,t)
(36) p′III
(
lIII,t)
= Z4 u′III(
lIII,t)
. (37)Using the plane wave formulation inEqs. (30), and (31)), the set ofEqs. (32)–(37)is expressed only with downstream and upstream acoustic waves. So, the system can be written in matrix form:
MX = B (38) where X =
p+ I p− I p+ II p− II p+ III p− III
and B =
1 0 0 0 0 0
(39)(a) Low power (A) (b) High power (A)
(c) Low power (C) (d) High power (C)
Fig. 29. PSD of pressure fluctuations in the combustion chamber and the power turbine (positions A and C inFig. 2respectively) ( ) and analytical transfer functions (– – –).
and the matrix M is
1 1 0 0 0 0 0 0 0 0 ei(−kLIII)¡
1 − Z4 ρ0c¢
ei(kLIII)¡
1 + Z4 ρ0c¢
0 0 ei(−kLII)¡
1 − Z3 ρ0c¢
ei(kLII)¡
1 + Z3 ρ0c¢
0 0 1 1 −1 −1 0 0 1 1 0 0 −1 −1 SI −SI SII −SII SIII −SIII
(40)Solving the system of equations gives directly the acoustic pres-sure fluctuation recorded by the microphone. However, this model-ing is not sufficient to explain the acoustic resonance visible in the PSD of pressure fluctuations in Fig. 16(b) and (a) because the ef-fect of kinematic viscosity, responsible for the ability of the probe to absorb standing waves within the sensor, is not taken into ac-count. To do this, a modified wave number km
km= 1 4
(
1 − i)
Lp Ar
2ν
0ω
kµ
1 +(
γ
− 1)
√1 Pr
+ k (41) is used to introduce an imaginary part able to mimic damping effect of the kinematic viscosity, as proposed in [49]to consider acoustic damping within boundary layers. Note that the modified wave number defined in (41)tends to k when the kinematic vis-cosity tends to zero.Finally, several acoustic transfer functions are plotted inFig. 29
for pressure probe mounted in the combustion chamber (position
A in Fig. 2) and in the power turbine (position C in Fig. 2). Note that the mean pressure is higher in the combustion chamber for both power settings. Thus, damping effect in the sensors decreases with increasing pressure. Finally, the multiple peaks correspond to
the maxima observed in the PSD of pressure in the combustion chamber (Fig. 3(a)), suggesting that the modulation observed on
all experimental PSD is due to the transfer function of the pressure probes.
References
[1]S. Candel, Acoustic transmission and reflection by a shear discontinuity sepa-rating hot and cold regions, J. Sound Vib. 24 (1972) 87–91.
[2]F.E. Marble, S. Candel, Acoustic disturbances from gas nonuniformities con-vected through a nozzle, J. Sound Vib. 55 (1977) 225–243.
[3] F.E. Marble, J.E. Broadwell, The coherent flame model for turbulent chemical reactions, Project Squid Technical Report TRW-9-PU, Project Squid Headquar-ters, 1977.
[4]A.S. Morgans, S.R. Stow, Model-based control of combustion instabilities in an-nular combustors, Combust. Flame 150 (4) (2007) 380–399.
[5]A. Giauque, M. Huet, F. Clero, Analytical analysis of indirect combustion noise in subcritical nozzles, in: ASME Turbo Expo, x, 2012, pp. 1–16.
[6]I. Duran, S. Moreau, Numerical simulation of acoustic and entropy waves propagating through turbine blades, 19th AIAA/CEAS Aeroacoustics Conference (34th AIAA Aeroacoustics Conference), AIAA2013-2102 Paper, Berlin, Germany, (2013).
[7]W. Moase, M. Brear, C. Manzie, The forced response of choked nozzles and supersonic diffusers, J. Fluid Mech. 585 (2007) 281–304.
[8]N.A. Cumpsty, F.E. Marble, The interaction of entropy fluctuations with turbine blade rows; a mechanism of turbojet engine noise, Proc. R. Soc. Lond. A 357 (1977) 323–344.
[9]G.F. Pickett, Core engine noise due to temperature fluctuations convecting through turbine blade rows, 2nd AIAA Aeroacoustics Conference, AIAA Paper 1975-528, (1975).
[10] V.L. Doyle, R.K. Matta, Attenuation of upstream-generated low frequency noise by gas turbines, Technical Report CR-135219, NASA, 1977.
[11]L. Gicquel, G. Staffelbach, T. Poinsot, Large eddy simulations of gaseous flames in gas turbine combustion chambers, Prog. Energy Combust. Sci. 38 (6) (2012) 782–817.
[12]P. Moin, S.V. Apte, Large-eddy simulation of realistic gas turbine combustors, AIAA J. 44 (4) (2006) 698–708.
[13]K. Mahesh, G. Constantinescu, S. Apte, G. Iaccarino, F. Ham, P. Moin, Large eddy simulation of reacting turbulent flows in complex geometries, ASME J. Appl. Mech. 73 (2006) 374–381.
[14]C. Fureby, LES of a multi-burner annular gas turbine combustor, Flow Turbul. Combust. 84 (2010) 543–564.
[15]G. Kuenne, A. Ketelheun, J. Janicka, LES modeling of premixed combustion us-ing a thickened flame approach coupled with FGM tabulated chemistry, Com-bust. Flame 158 (9) (2011) 1750–1767.
[16]S. Roux, M. Cazalens, T. Poinsot, Influence of outlet boundary condi-tion for large eddy simulacondi-tion of combuscondi-tion instabilities in gas turbine, J. Propul. Power 24 (3) (2008) 541–546.
[17]P. Wolf, G. Staffelbach, A. Roux, L. Gicquel, T. Poinsot, V. Moureau, Massively parallel LES of azimuthal thermo-acoustic instabilities in annular gas turbines, C. R. Acad. Sci. Méc. 337 (6–7) (2009) 385–394.
[18]M. Leyko, S. Moreau, F. Nicoud, T. Poinsot, Waves transmission and generation in turbine stages in a combustion-noise framework, 16th AIAA/CEAS AeroA-coustics Conference, (2010).
[19]I. Duran, S. Moreau, Study of the attenuation of waves propagating through fixed and rotating turbine blades, 18th AIAA/CEAS Aeroacoustics Conference (33rd AIAA Aeroacoustics Conference), AIAA 2012-2133 paper, (2012). [20]A. Mishra, D.J. Bodony, Evaluation of actuator disk theory for predicting
indi-rect combustion noise, J. Sound Vib. 332 (4) (2013) 821–838.
[21]F. Bake, N. Kings, A. Fischer, R. I., Experimental investigation of the entropy noise mechanism in aero-engines, Int. J. Aeroacoust. 8 (1–2) (2008) 125–142. [22]F. Bake, C. Richter, B. Muhlbauer, N. Kings, I. Rohle, F. Thiele, B. Noll, The
en-tropy wave generator (EWG): a reference case on enen-tropy noise, J. Sound Vib. (2009) 574–598.
[23]B. Muhlbauer, B. Noll, M. Aigner, Numerical investigation of the fundamental mechanism for entropy noise generation in aero-engines, Acta Acust. United Acust. 95 (2009) 470–478.
[24]A. Giauque, M. Huet, F. Clero, Analytical analysis of indirect combustion noise in subcritical nozzles, J. Eng. Gas Turb. Power 134 (11) (2012) 111202. [25]M. Leyko, F. Nicoud, S. Moreau, T. Poinsot, Numerical and analytical
investiga-tion of the indirect noise in a nozzle, in: Summer Program, Center for Turbu-lence Research, NASA AMES, Stanford University, USA, 2008, pp. 343–354. [26]S. Perennes, M. Roger, Aerodynamic noise of a two-dimensional wing with
high-lift devices, 4th AIAA/CEAS Aeroacoustics Conference, AIAA Paper 98-2338, (1998).
[27]F. Bake, U. Michel, I. Roehle, Investigation of entropy noise in aero-engine com-bustors, J. Eng. Gas Turb. Power 129 (2) (2007) 370–376.
[28]J.Y. Chung, Rejection of flow noise using a coherence function method, J. Acoust. Soc. Am. 62 (2) (1977) 388–395.
[29] E.A. Krejsa, Combustion noise from gas turbine aircraft engines measurement of far-field levels, Technical Report NASA Technical Report 88971, NASA, 1987. [30]B.N. Shivashankara, Gas turbine core noise source isolation by
internal-to-far-field correlations, J. Aircr. 15 (9) (1978) 597–600.
[31] P.H. Wirsching, T.L. Paez, K. Ortiz, Random vibrations: theory and practice, Dover Publications, 2006.
[32]J. Kopitz, E. Brocker, W. Polifke, Characteristics-based filter for identification of planar acoustic waves in numerical simulation of turbulent compressible flow, in: 12th International Congress on Sound and Vibration, 2005.
[33] AVBP, AVBP code: http://www.cerfacs.fr/cfd/avbp_code.php and http://www. cerfacs.fr/cfd/cfdpublications.html.
[34]O. Colin, M. Rudgyard, Development of high-order Taylor–Galerkin schemes for unsteady calculations, J. Comput. Phys. 162 (2) (2000) 338–371.
[35]J. Smagorinsky, General circulation experiments with the primitive equations. 1. The basic experiment., Mon. Weather Rev. 91 (1963) 99–164.
[36]O. Colin, F. Ducros, D. Veynante, T. Poinsot, A thickened flame model for large eddy simulations of turbulent premixed combustion, Phys. Fluids 12 (7) (2000) 1843–1863.
[37]L. Selle, G. Lartigue, T. Poinsot, R. Koch, K.-U. Schildmacher, W. Krebs, B. Prade, P. Kaufmann, D. Veynante, Compressible large-eddy simulation of turbulent combustion in complex geometry on unstructured meshes, Combust. Flame 137 (4) (2004) 489–505.
[38] T. Poinsot, D. Veynante, Theoretical and numerical combustion, third edition, 2011www.cerfacs.fr/elearning.
[39]B. Franzelli, E. Riber, M. Sanjosé, T. Poinsot, A two-step chemical scheme for large-eddy simulation of kerosene-air flames, Combust. Flame 157 (7) (2010) 1364–1373.
[40]T. Poinsot, S. Lele, Boundary conditions for direct simulations of compressible viscous flows, J. Comput. Phys. 101 (1) (1992) 104–129.
[41] L. Selle, F. Nicoud, T. Poinsot, The actual impedance of non-reflecting bound-ary conditions: implications for the computation of resonators, AIAA J. 42 (5) (2004) 958–964.
[42]I. Duran, M. Leyko, S. Moreau, F. Nicoud, T. Poinsot, Computing combustion noise by combining large eddy simulations with analytical models for the propagation of waves through turbine blades, 3rd Colloquium INCA, Toulouse, France, (2011).
[43]I. Duran, M. Leyko, S. Moreau, F. Nicoud, T. Poinsot, Computing combustion noise by combining large eddy simulations with analytical models for the propagation of waves through turbine blades, C. R. Acad. Sci. 341 (1–2) (2013) 131–140.
[44] M. Leyko, I. Duran, S. Moreau, F. Nicoud, T. Poinsot, Simulation and mod-elling of the waves transmission and generation in a stator blade row in a combustion-noise framework, J. Sound Vib. 333 (23) (2014) 6090–6106. [45]F.P. Bretherton, C.J.R. Garrett, Wavetrains in inhomogeneous moving media,
Proc. R. Soc. Lond. 302 (1471) (1968) 529–554.
[46]P. Gajan, A. Strzelecki, B. Platet, R. Lecourt, F. Giuliani, Investigation of spray behavior downstream of an aeroengine injector with acoustic excitation, J. Propuls. Power 23 (2) (2007) 390–397.
[47]M. De la Cruz Garcia, E. Mastorakos, A. Dowling, Investigations on the self-excited oscillations in a kerosene spray flame, Combust. Flame 156 (2) (2009) 374–384.
[48]S. Mendez, J. Eldredge, Acoustic modeling of perforated plates with bias flow for large-eddy simulations, J. Comput. Phys. 228 (13) (2009) 4757–4772. [49]S.W. Rienstra, A. Hirschberg, An introduction to acoustics No. 2011, Eindhoven
University of Technology, 2011.
[50]S. Moreau, M. Roger, Effect of airfoil aerodynamic loading on trailing edge noise sources, AIAA J. 43 (7) (2005) 41–52.
[51] A. Chauvin, M. Sanjose, G. Lobel, S. Moreau, M. Brouillette, Experimental and numerical investigation on noise induced by a butterfly valve, 20th AIAA/CEAS Aeroacoustics Conference, (June 2014).