HAL Id: hal-02871222
https://hal.inrae.fr/hal-02871222
Submitted on 25 Jun 2020
HAL is a multi-disciplinary open access
archive for the deposit and dissemination of sci-entific research documents, whether they are pub-lished or not. The documents may come from teaching and research institutions in France or abroad, or from public or private research centers.
L’archive ouverte pluridisciplinaire HAL, est destinée au dépôt et à la diffusion de documents scientifiques de niveau recherche, publiés ou non, émanant des établissements d’enseignement et de recherche français ou étrangers, des laboratoires publics ou privés.
Distributed under a Creative Commons Attribution - NoDerivatives| 4.0 International License
Willingness-to-Pay for Reshuffling Geographical
Indications
Monia Saïdi, Jean-Sauveur Ay, Stephan Marette, Christophe Martin
To cite this version:
Monia Saïdi, Jean-Sauveur Ay, Stephan Marette, Christophe Martin. Willingness-to-Pay for Reshuf-fling Geographical Indications. Journal of Wine Economics, Cambridge University Press (CUP), 2020, 15 (1), pp.95-111. �10.1017/jwe.2020.5�. �hal-02871222�
1
Willingness-To-Pay for Reshuffling
Geographical Indications
Monia Saïdi a, Jean-Sauveur Ay b, Stéphan Marette cand Christophe Martin d
Abstract
This article presents a new experimental protocol for estimating consumers’ willingness-to-pay (WTP) for products involved in a reshuffle of Geographical Indications (GIs). Although the collective reputation of a given GI depends on its temporal stability, reshuffling a GI area could make it better aligned with product quality or consumers’ perception. We first provide a simple theoretical model in which consumers put a negative value on within-GI quality variance, thereby showing that reshuffling the GI designation scheme may increase WTP without any change in product quality. Using the experimental protocol, we evaluate consumer perceptions of different reshuffling scenarios for the vineyards of Marsannay, Burgundy, France. The results reveal a significant increase in WTP for the current distribution of products’ quality. Elicited WTP values are then used to simulate the optimal GI reshuffle.
Key words: Experimental economics, wine appellation, quality signal, public policy. JEL Classification: Q18, Q28, L66
We thank an anonymous referee and the editor for their useful comments that greatly improved the quality of this article. Experimental protocol, data, and replication material are available on the remote repository https://github.com/jsay/reshufGI. This work was supported by the project DIETPLUS ANR-17-CE21-0003. a CESAER, AgroSup Dijon, INRAE, Université Bourgogne Franche-Comté, 26 boulevard Docteur Petitjean, 21000 Dijon, France; e-mail: [email protected].
b CESAER, AgroSup Dijon, INRAE, Université Bourgogne Franche-Comté, 26 boulevard Docteur Petitjean, 21000 Dijon, France; e-mail: [email protected] (corresponding author).
c Université Paris-Saclay, INRAE, AgroParisTech,UMREconomie Publique, Avenue Lucien Brétignière, 78850, Thiverval Grignon, France; e-mail: [email protected].
d INRAE, UMR Centre des Sciences du Goût et de l’Alimentation, 17 rue Sully, 21000 Dijon, France; e-mail: [email protected].
2
I.
Introduction
A geographical indication (GI) provides certified information about the location of production as a quality signal given to consumers (Menapace and Moschini, 2012; Bonroy and Constantatos, 2015). The credibility of this information depends on consumers’ perceptions of the designation scheme that maps the physical attributes of production sites regarding the GI.1
Among the numerous determinants of this perception, the historical stability of the GI scheme is clearly important for creating and maintaining a collective reputation (Tirole, 1996). Nevertheless, in many situations, flexibility is required in order to adapt GIs to new contexts, such as changing technologies, modifications in consumers’ preferences, or climate change. Moreover, even without any external evolutions, both political bargaining and private lobbying surrounding the creation of GIs might have materialized historical biases (Fourcade, 2012; Ay, 2020) that could be removed by reshuffling the GIs.
This paper aims at understanding ex ante how consumers react to a change in a GI scheme, when the quality distribution of supplied bottles is constant. The objective is to experimentally estimate consumers’ perceptions of different scenarios involving changes in GI classification without any change in products.
Before presenting the experiment, we provide a simple theoretical model with imperfect information for consumers about product quality and introduce GIs as a quality signal to reduce the information gap. Consumer perception of quality as signalled by GIs is a weighted combination of the average quality of products within each GI level and their within-GI quality variance. For a given distribution of quality supplied, introducing a new GI level and re-allocating the production sites within a given number of GI levels could be beneficial for
1 The importance of physical attributes (terroir) for explaining the link between wine qualities and prices is not consensual in
the literature (Gergaud and Ginsburgh, 2010; Ashenfelter and Storchmann, 2010). In particular, part of the debate consists in separating the relative contribution of terroir and GIs, knowing that they are spatially correlated (Cross, Plantinga and Stavins, 2017).
3 consumers. There is nevertheless a complex trade-off in such a GI reshuffling. Indeed, the average WTP probably increases by adding a new high-quality level, but potentially at the expense of the WTP of current lower-quality GI levels.
Another kind of GI change is studied by Constanigro et al. (2019) who examine the introduction of a new and high-quality GI level, namely the Gran Selezione, at the top of the Chianti wine hierarchy. From an online survey with randomized scenarios, the authors find that the new GI would increase the market share of Chianti wines, with the effect of increased vertical differentiation more than offsetting the decline in the perceived quality of other Chianti wines. Because the creation of the new GI level does not modify the existing GIs for Chianti wines, the decline in the perceived quality of other wines is due exclusively to a subjective bias named the “comparative stigma”. In fact, the creation of a high-quality GI level from the best vineyard plots is generally made jointly with a reshuffle of the spatial delineations of other GI levels, and a simultaneous reduction in the average quality of the existing GI levels. The decline in the perceived quality following such a reshuffle may be rational (i.e., not related to the comparative stigma) and still exist with full information, as is the case in the typical theoretical models of GI designation (Deconinck and Swinnen, 2014; Gokcekus and Finnegan, 2017; Yu et al., 2017).
Our research question is also related to the work of Gokcekus and Finnegan (2017) about the creation of new sub-divisions within Oregon’s Willamette Valley American Viticultural Area (AVA). Using wine price data before and after the creation of the sub-AVAs, they found ex post that regional reputation premiums have significantly increased with GI reshuffling. Compared to this contribution, our approach innovates by providing an ex ante estimation of the impact of GI reshuffling on WTP through a lab experiment, organized before any “real” institutional decisions. Our protocol allows us to virtually study different reshuffling scenarios in order to determine which one maximizes the WTP for each GI level or for all GI
4 levels in the area of interest. Eventually, our work contributes to thwart the lack of knowledge regarding the design of more efficient GIs, as regularly underlined in the literature (Bonroy and Constantatos, 2015; Deconinck and Swinnen, 2014).
Our new protocol is applied to a Burgundian configuration. Indeed, Burgundy has a long history of ranking vineyards according to their quality, dating back to the Middle Ages (Meloni and Swinnen, 2018). The first official classification came from a 1860 map that only contained three GI levels for each municipality of the Côte d'Or area, namely, the Régional, the Village, and the Grand Cru levels. This first map, established from both academic knowledge (Lavalle, 1855) and jurisprudence from previous legal disputes, was extensively used as a basis for regulating the wine sector, until the creation of the French national institute in charge of the GIs management, entitled Institut National de l’Origine et de la Qualité (INAO) in 1936. Some reshuffling was then implemented during the 20th century with, in particular, the creation of Premier Cru level in 1943 and many marginal changes at the vineyard scale thereafter. 2
There is currently no explicit procedure for determining GI reshufflings. Current delineations come from accumulated empirical knowledge about quality potential of vineyards, in connection with requests from wine producers and traders.3 Nowadays, the range of price
differentials across the historical GI levels (Premier Cru included) is very high in Burgundy (Combris, Lecocq and Visser, 2000). Because of these price premiums, there are numerous “regulatory” requests made by the Organismes de Défense et de Gestion (ODG), the producers organizations that defend GIs interests, to move up some vineyards in the hierarchy. These requests are made in order to benefit from the so-called “umbrella effect” from wines currently
2 In 2013, INAO decided to stop considering marginal changes inside each specific GI but chose to arbitrate requests during “collective” reshuffling operations inside a significant region.
3 For example, neither the municipalities of Volnay nor Nuits-St-Georges has Grands crus because in the 1930s leading growers chose not to petition for them, for various reasons, including a reluctance to pay the higher taxes ( https://www.decanter.com/learn/burgundy-premier-cru-vs-grand-cru-vineyards-ask-decanter-410099/#KPSkYut5TSE3rcZ7.99 )
5 designated in higher levels (Hakenes and Peitz, 2009). The requests supervision is entrusted to the INAO, which has the general administrative power, but no explicit scientific criteria for reshuffling the GIs.
We study the effect of reshuffling the GIs for the vineyards of Marsannay in the Burgundy region. This area counts three municipalities: Chenôve, Couchey and Marsannay-la-Côte, with only a two-level GI hierarchy: The Régional level, lower than the Village level (see Figure SM1 in the Supplementary Material). The GI classification for the whole Burgundy has higher levels Premier Cru and Grand Cru that are not currently present on the Marsannay area (these high-quality levels are present in surrounding municipalities such as Fixin and Gevrey-Chambertin). The proximity of this area to the city of Dijon (capital of Burgundy) has made these wines mainly intended for local consumption, which has resulted in a late introduction of the GIs in the twentieth century. The ODG of Marsannay asks to INAO to reshuffle the current GI boundaries for the Village and the Régional levels and to create a Premier Cru level in 2012. This request is still under investigation by INAO.
The paper is organized as follows. Section 2 introduces a simple theoretical model. The experimental protocol is presented in Section 3. Section 4 reports the results, and Section 5 concludes.
II. Theoretical model
Assume that trade occurs in a single period, where similar consumers want to purchase only one unit of the good, namely a bottle of wine of a given GI level. Consumers have a WTP equal to 𝜃𝑘∗, where 𝜃 is a given taste parameter and 𝑘∗ represents the perceived level of quality of
the GI level. The perceived quality takes into account the mean and the variance of quality, which varies between GI levels. Consumers do not have precise information about the specific quality of the bottle that they will potentially buy, its GI level is assumed to be the only
6 information available. The specific wine quality follows a uniform distribution k ∈ [0,1], the perceived quality 𝑘∗ is assumed to depend on the mean E(k) and variance V(k) of the specific
quality distribution.
Without any GI, the perceived quality is assumed equal to
𝑘∗ = 𝛾𝐸(𝑘) − 𝛿𝑉(𝑘) = 𝛾/2 − 𝛿/12. (1)
With 𝛾, 𝛿 > 0. The parameter 𝛾 captures the perception of the average quality and 𝛿 captures
the aversion to variability of quality that negatively affects consumer perception.
We consider a possible GI certification capable of providing credible information about the minimum limit for the wine quality. We assume a limit 0 ≤ 𝐿 ≤ 1 for a GI, such that if the consumer purchases a bottle under this GI, the quality variation follows a subpart of the uniform distribution with k ∈ [L, 1]. In other words, the GI reduces a part of the risk in addition to giving the signal about average quality. For a bottle below the threshold, the quality variation follows a subpart of the uniform distribution with k ∈ [0, L]. We assume that all the producers of quality k ∈ [L, 1] use this GI scheme, if this system emerges. The limit L establishes a separation along the uniform distribution.
For a bottle with a GI, the quality variation follows a subpart of the uniform distribution with k ∈ [L,1] and the density is equal to 1/(1-L). The mean is equal to 𝐸𝐿(𝑘) = (1+L)/2 and the variance to 𝑉𝐿(𝑘) = (1 − 𝐿)2/12. The perceived quality of a bottle receiving the GI is
𝑘𝐿∗ = 𝛾𝐸𝐿(𝑘) − 𝛿𝑉𝐿(𝑘) = 𝛾(1 + 𝐿)/2 − 𝛿(1 − 𝐿)2/12. (2)
For a bottle without the GI, the quality variation follows a subpart of the uniform distribution with k ∈ [0, L] and the density is equal to 1/L. The mean is equal to 𝐸𝑊(𝑘) = L/2 and the variance to 𝑉𝑊(𝑘) = 𝐿2/12. The perceived quality of a bottle without the GI is
7 If we assume that the GI designation scheme for one bottle tries to maximize the perceived quality from the consumer’s point of view, the label limit L is selected in order to maximize
𝑘(𝐿) = 𝑘𝐿∗+ 𝑘𝑊∗ . (4)
This function is concave with 𝑑2𝑘(𝐿)/𝑑𝐿2. The value L* maximizing (4) is defined by
𝐿∗ = 𝑀𝑖𝑛[ 1 2+
3𝛾
𝛿 , 1[ . (5)
If, the parameter 𝛿 capturing the aversion to variability in quality is relatively low (namely, 0 ≤ 𝛿 ≤ 6𝛾), the optimal limit L* is equal to 1 and no GI signal is implemented. In this case, there is no distinctive signal set between 0 and 1, because the quality variance does not count much in the quality perception and consumer’s utility. If the parameter 𝛾 is relatively
large, the mean weighs more than the variance in consumer perceptions. Conversely, if 𝛿 is relatively high (𝛿 > 6𝛾), the consumer is very sensitive to the quality variance. In this case, a quality signal with L* between 1/2 and 1 as the lower bound of the distribution is optimal and provides information to consumers. This signal limits the impact of the variance on the quality perceived by the consumer, since the variance under the GI, 𝑉𝐿(𝑘), is lower than the variance without the GI, 𝑉𝑊(𝑘), when L* is between ½ and 1. It is important to notice that this signalling effect occurs even if the supply (i.e. the initial distribution) of quality does not change, since specific quality still follows the given uniform distribution.
Equation (5) shows the importance of the weight consumers attribute to the variance of quality (via the parameter 𝛿) in the relevance of a GI scheme.This simple theoretical model with a constant range of produced qualities shows that a GI scheme when consumers significantly and negatively value the impact of the quality variance. Another interesting insight could come from an extension with heterogeneous consumers and price adjustments. Such consumers would buy one unit of a quality k at a price p with an indirect utility equal to θk −p and a uniformly distributed taste parameter θ ∈ [0,1] (see Mussa and Rosen, 1978). Consumers
8 with a relatively high θ will select high-quality products and consumers with a relatively low θ will select low-quality products. This means that consumers with a relatively high θ select the quality 𝑘𝐿∗ defined by equation (2) and consumers with a relatively low θ select the quality 𝑘
𝑊∗
defined by equation (3) such that 𝑘𝑊∗ < 𝑘𝐿∗. We leave the integration of Mussa and Rosen’s specification and the analysis of consumers’ surplus and social welfare for future work, as we are mainly concerned with the short and medium terms determinants of WTP for wines of different GIs.
III. Experimental protocol
A. General setting
We conducted the experiment in a dedicated laboratory room at the Centre des Sciences du Goût et de l'Alimentation (CSGA) in Dijon, Burgundy. The experiment was performed in June 2018 with 125 consumers from Dijon and the surrounding municipalities (except from the municipalities of the Marsannay area) who attended a session of about one hour. Ten sessions were organized over three days, each involving 10 to 15 participants (the number of places in the experimental room).
The participants were drawn randomly from the INRAE PanelSens database. The sample was representative of the French population by its stratification in terms of age, gender, and socio-occupational categories. The database from which the sample was drawn includes individuals having already participated in other sensory tests or interested in doing so and having agreed to participate in CSGA research. A preliminary survey was sent to them to check if they were wine buyers or consumers. The results confirm that the vast majority (98%) had bought or consumed wines in the last 12 months. To encourage participants to be engaged in the incentive scheme, they were informed at the beginning of each session that we would give
9 them an extra €15, in addition to the compensation of €10 initially announced, to potentially buy a bottle of wine at the end of the experiment. If participants did not buy a bottle of wine, the protocol allowed them to leave with a compensation of €25 (€15+€10).
Ten 75 cl bottles of red wines from the area of Marsannay were selected: six bottles from the Village GI level and four bottles from the Régional GI level. These wines were what the winegrowers were selling at the time of the experiment under the current GI designation scheme (in June 2018, it was the 2016 vintage). This selection of wines was designed to be balanced and to separate the producer effect from the GI effect. We selected four comparable producers (family vineyards with a high rate of direct sales) that made different Cuvées of both GI levels in order to have different producers in each GI level and to have different GI levels for each producer. With 10 bottles from 10 different producers, the changes in GIs would have been conflated with the effects of producers. Information on the price of wines by direct sales (reported in Table 1) was not presented to the participants. We informed the participants that the 10 wines were arranged hierarchically following experts’ judgements about the quality of vineyards according to their natural characteristics. An eleventh wine from the municipality of Fixin (adjacent to the Marsannay area, see Figure SM1) that already has vineyards from the high GI level Premier Cru was presented to half of the participants. This benchmark wine will enable us to estimate an umbrella effect for the creation of the Premier Cru level in the Marsannay area. The wines of current GI levels were displayed in the experiment room so each participant could look at them before the start of the experiment. During the experiment, consumers were asked to answer different questions about their wine consumption and their wine knowledge.
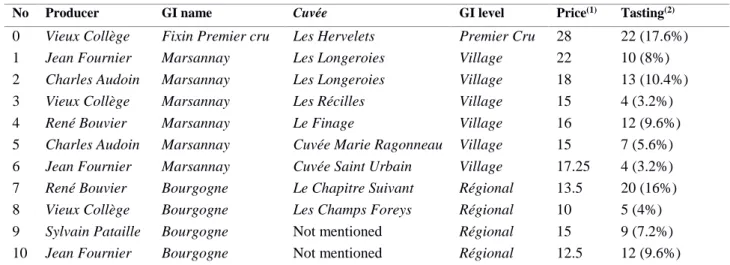
The following Table 1 presents the characteristics of the wines proposed to the participants, the producers, the names of GIs, the Cuvée, and the price. The pictures of wine labels are presented in Figure SM2. We sorted the sample of wines in order to include the
10 different producers, while maintaining the rank of current GI levels. This strategy was central in order to control for producer effects arising from a GI reshuffle, which will be confirmed by the empirical results. However, the price hierarchy reported in Table 1 was not perfectly observed, with three wines (WINE 6, WINE 8 and WINE 9) creating discontinuities along the price gradient. Recall that participants were informed only about the position of the wine on the quality gradient that we propose, and not about the true price gradient.
Table 1: Wines proposed during the experiment, all from the 2016 vintage
No Producer GI name Cuvée GI level Price(1) Tasting(2)
0 Vieux Collège Fixin Premier cru Les Hervelets Premier Cru 28 22 (17.6%) 1 Jean Fournier Marsannay Les Longeroies Village 22 10 (8%) 2 Charles Audoin Marsannay Les Longeroies Village 18 13 (10.4%) 3 Vieux Collège Marsannay Les Récilles Village 15 4 (3.2%) 4 René Bouvier Marsannay Le Finage Village 16 12 (9.6%) 5 Charles Audoin Marsannay Cuvée Marie Ragonneau Village 15 7 (5.6%) 6 Jean Fournier Marsannay Cuvée Saint Urbain Village 17.25 4 (3.2%) 7 René Bouvier Bourgogne Le Chapitre Suivant Régional 13.5 20 (16%) 8 Vieux Collège Bourgogne Les Champs Foreys Régional 10 5 (4%) 9 Sylvain Pataille Bourgogne Not mentioned Régional 15 9 (7.2%) 10 Jean Fournier Bourgogne Not mentioned Régional 12.5 12 (9.6%)
(1) Price including consumption tax, in direct sales for private individuals.
(2) Numbers and percentages of participants having already tasted the wine. Any participant could have tasted several wines.
B. Eliciting WTP
To reproduce the typical wine purchase situation, the participants did not taste the wines during the experiment. Their declared WTP was based solely on their perceptions of the GI information derived from looking at the bottles of wine and their labels. Instead of asking about the WTP for each bottle of wine individually, the wines were first grouped into batches of bottles corresponding to their current GI levels. Participants were asked to report three WTP values (one for each GI level presented to them: Premier Cru, Village and Régional) through the following question: “What is the maximum price you are willing to pay for a bottle of wine randomly drawn from this batch of bottles?” The rest of the experiment simulated, for each of the 10 groups of participants, four scenarios for reshuffling the GI levels with the creation of a
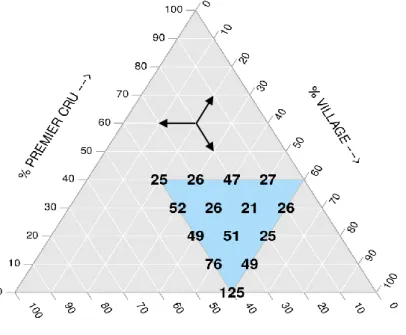
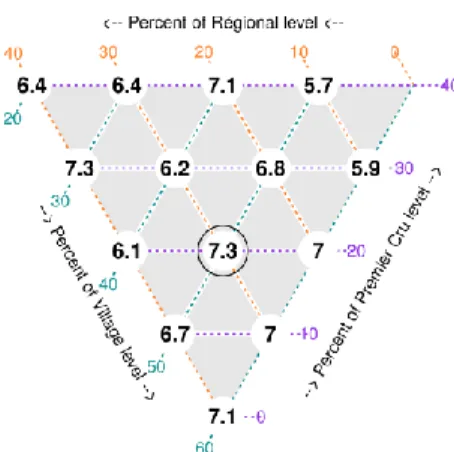
11 Premier Cru level in the Marsannay area for wines from the best Cuvées of the current Village level and upgrading wines of the Régional level to the Village level. The highest quality wines at the Village level were those that were promoted to the Premier Cru and the highest quality wines at the Régional level were those that were upgraded to the Village level (see Figure SM3). For each of these scenarios, participants were asked to state their WTP through the same question as before. Notice that the WTP was elicited before the random draw of the bottle was made. Fourteen possible reshuffle scenarios were selected for this study, as they appear on Figure 1. In order to limit the duration of the sessions, each participant was subjected to a subset of just four scenarios with a random order of presentation between groups.
Figure 1: Number of WTP responses for each of the 14 proposed scenarios
Notes: The Marsannay area is divided into three GI levels (Régional, Village, Premier Cru). This allows a triangular representation where each inner point represents a combination of the distribution that adds up to 100%. The Figure illustrates the 14 combinations proposed and the number of participants for each. For example, 125 participants indicated a WTP for the scenario corresponding to 0% Premier Cru, 60% Village and 40% Régional, which corresponds to the current distribution. The arrow in the middle represents how the projections on the axis were made.
12 The purpose of randomly drawing the bottle that will be offered for sale from the BDM mechanism was to represent the quality uncertainty that exists when buying wine from a given GI level. We informed the participants that this artificial procedure corresponded to the uncertainty with which any wine buyer is regularly confronted, as detailed in the theoretical model. During the presentation of the protocol, participants were also informed that only one of the WTPs they declared would be drawn at the end of the session and could result in a real purchase through a BDM mechanism (see Lusk and Shogren, 2007). The purchase rule was devised to be individual: any participant whose randomly drawn WTP was greater than the randomly drawn purchase price had to purchase this bottle at the drawn price. Conversely, if the participant’s WTP was less than or equal to the purchase price of the bottle, the purchase could not go ahead. For each GI level (corresponding to one batch of bottles), the classical BDM procedure was applied to each price choice. More concretely, we made three random draws at the end of each session:
1. One of the WTP values declared during the session.
2. One bottle from the batch corresponding to this WTP.
3. A purchase price for the corresponding bottle.
This way of eliciting WTP opens up a new way to measure collective reputation based on WTP for a group of bottles. Our paper clearly innovates with respect to the BDM mechanism, since participants are bidding for one bottle among batches of bottles, rather than a given bottle.
C. Description of data
With 125 participants, five scenarios proposed and three GI levels for each scenario, we had a total of 1825 declared WTP values. It will be recalled that for 65 participants a Fixin Premier Cru (WINE 0 in Table 1) was presented, whereas this wine was removed for the other 60 participants in order to estimate the umbrella effect from an existing Premier Cru. In all
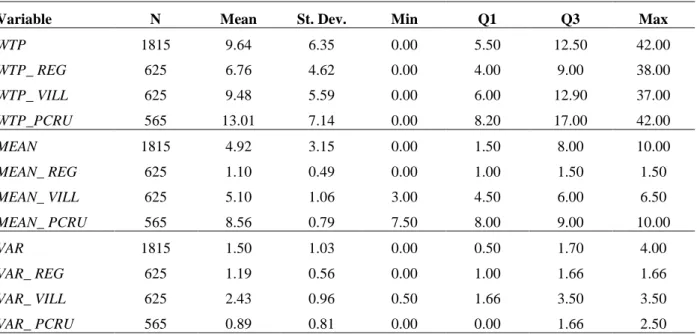
13 scenarios, the Fixin Premier Cru was classified as Premier Cru. WINE 5 and WINE 6 were always classified as Village and WINE 10 was always classified as Régional (see Figure SM3). Table 2 presents the main summary statistics about the WTP elicited with respect to the average and the variance of the quality from batches of bottles. According to the theoretical model, the distribution of wine quality in the experiment is uniform with one bottle of each wine, with an average quality increasing along the GI hierarchy and with a variance that depends on the number of bottles in each GI batch. We see that the average WTP for a bottle of Marsannay is €9.65, with significant differences between GI levels: €6.75 on average for Bourgogne, €9.50 for Village, and €13 for Premier Cru.
Table 2: Summary statistics about the elicited WTP and GI characteristics
Variable N Mean St. Dev. Min Q1 Q3 Max
WTP 1815 9.64 6.35 0.00 5.50 12.50 42.00 WTP_ REG 625 6.76 4.62 0.00 4.00 9.00 38.00 WTP_ VILL 625 9.48 5.59 0.00 6.00 12.90 37.00 WTP_PCRU 565 13.01 7.14 0.00 8.20 17.00 42.00 MEAN 1815 4.92 3.15 0.00 1.50 8.00 10.00 MEAN_ REG 625 1.10 0.49 0.00 1.00 1.50 1.50 MEAN_ VILL 625 5.10 1.06 3.00 4.50 6.00 6.50 MEAN_ PCRU 565 8.56 0.79 7.50 8.00 9.00 10.00 VAR 1815 1.50 1.03 0.00 0.50 1.70 4.00 VAR_ REG 625 1.19 0.56 0.00 1.00 1.66 1.66 VAR_ VILL 625 2.43 0.96 0.50 1.66 3.50 3.50 VAR_ PCRU 565 0.89 0.81 0.00 0.00 1.66 2.50
Note: The first (WTP), fifth (MEAN) and ninth (VAR) rows report respectively the WTP, the average quality and the variance of the quality for the pooled sample of all 1815 prices elicited from participants. The suffixes “REG”, “VILL” and “PCRU” in the other rows indicate the corresponding GI levels respectively: Régional, Village, or Premier Cru.
For all the scenarios proposed to the participants, we define the variables MEAN and VAR as representing the quality of each batch of bottles of GI level, through the average quality and the variance of quality computed from a grade allocated to each bottle distributed between 0 (for WINE 10 at the bottom of the hierarchy) and 10 (for WINE 0 at the top of the hierarchy),
14 as displayed in Figure SM3. From Table 2, the average MEAN quality of all GI levels is approximately 5 and the average VAR is 1.5, confirming the balance of the experimental design in reference to the uniform distribution of the theoretical model. The MEAN variable is by construction increasing with the GI hierarchy (MEAN_REG < MEAN_VILL < MEAN_PCRU) while the variance is higher on average for the Village level that counts on average a greater number of bottles by batch (Figure SM3). The Fixin Premier Cru was not presented to all the participants, so they were not asked for an elicited WTP for the Premier Cru in the first round of the experiment. Consequently, we observe only 565 WTP, MEAN and VAR (instead of 625) for this higher GI level.
IV. Results
We first present econometric regressions for studying how elicited WTP are influenced by the different scenarios of reshuffling the GIs, through the various batches of bottles proposed. After discussing the results, we simulate the changes in GIs in order to maximize the average WTP across all participants for each GI level separately and for all levels.
A. Econometric estimations
In the following regressions, the individual WTP values from the experiment are pooled and explained by different sets of independent variables. The most general empirical model is:
𝑊𝑇𝑃𝑖𝑗𝑠 = α𝑖+ 𝛽𝑉 𝑉𝐼𝐿𝐿𝑗 + 𝛽𝑃 𝑃𝐶𝑅𝑈𝑗 + 𝛾𝑅 𝑀𝐸𝐴𝑁𝑗𝑠 + 𝛾𝑉 𝑉𝐼𝐿𝐿𝑗× 𝑀𝐸𝐴𝑁𝑗𝑠 +
𝛾𝑃 𝑃𝐶𝑅𝑈𝑗× 𝑀𝐸𝐴𝑁𝑗𝑠+ 𝛿𝑅 𝑉𝐴𝑅𝑗𝑠+ 𝛿𝑉 𝑉𝐼𝐿𝐿𝑗× 𝑉𝐴𝑅𝑗𝑠 + 𝛿𝑃 𝑃𝐶𝑅𝑈𝑗× 𝑉𝐴𝑅𝑗𝑠 + 𝜀𝑖𝑗𝑠 (6)
In this equation (6), the index i represents the participant, j the GI level claimed for the corresponding batch of bottles, s the corresponding scenario, and 𝜀 are the residuals. In this equation, WTP is the dependent variable and the explanatory variable VILL is a dummy that codes 1 if the batch of bottles is claimed of the Village level and PCRU codes 1 if the batch of
15 bottles is claimed of the Premier Cru level (the Régional level is the reference category). The other variables in equation (6) are the main effects of the variables MEAN and VAR (respectively the average and the variance of quality within GIs) and their interactions with the dummy variables about GI levels. These models are estimated by OLS (Ordinary Least Squares) both without and with participant fixed effects α𝑖. The variance-covariance matrix of errors is
clustered within each participant (as random effects) to take into account the dependences between the different WTP values of a given participant. Standard errors of the coefficients estimated are corrected accordingly.
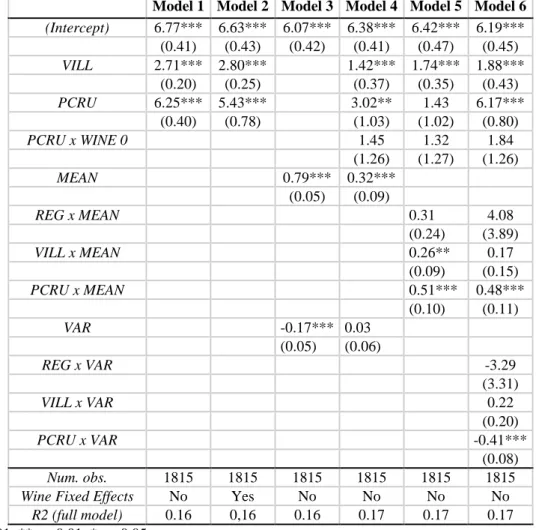
In Table 3, the Régional level is omitted, in order to be the reference category with an average WTP of €6.77 per bottle, as shown by the Intercept row of Model 1. A bottle from the Village level (denoted VILL) entails a significant WTP increase of €2.71 compared to the reference category, leading to an average WTP equals to €9.50. The Premier Cru level (denoted PCRU) imply a significant WTP increase of €6.25 compared to the reference category, leading to an average WTP of €13. The R2 shows that 16% of pooled WTP variations are explained by just these two dummy variables about GI levels. The relatively high WTP for the Premier Cru level, independently of the bottles in the corresponding batches, is a striking evidence of the credibility of the creation of the Premier Cru level in the Marsannay area. This result is robust when we alternatively consider the inclusion of participants fixed effects, as presented in Model 2 of Table SM1 in the supplementary material. Controlling for individual characteristics does not change the premiums for GI levels.
Model 2 of Table 3 introduces 11 wine fixed effects, not reported here, for the presence of each wine in the batches proposed to participants (the coefficients are available in Table SM1). This allows us to control for the individual values of each wine from WTP only elicited for batches of bottles. Compared to Model 1, the introduction of these wine fixed effects does not change significantly the WTP differential for the Village level, which shows that individual
16 wine characteristics (producer, colour of label, etc.) do not matter for consumers’ WTP. However, the WTP differential for the Premier Cru level decreases of €0.80 (from €6.25 to €5.43). The explanation comes from the so-called “umbrella effect”, related to the Fixin Premier Cru which is now controlled the dummy variable WINE 0 (in Table SM1).
Table 3: Regression Results for the WTP on batches characteristics Model 1 Model 2 Model 3 Model 4 Model 5 Model 6
(Intercept) 6.77*** 6.63*** 6.07*** 6.38*** 6.42*** 6.19*** (0.41) (0.43) (0.42) (0.41) (0.47) (0.45) VILL 2.71*** 2.80*** 1.42*** 1.74*** 1.88*** (0.20) (0.25) (0.37) (0.35) (0.43) PCRU 6.25*** 5.43*** 3.02** 1.43 6.17*** (0.40) (0.78) (1.03) (1.02) (0.80) PCRU x WINE 0 1.45 1.32 1.84 (1.26) (1.27) (1.26) MEAN 0.79*** 0.32*** (0.05) (0.09) REG x MEAN 0.31 4.08 (0.24) (3.89) VILL x MEAN 0.26** 0.17 (0.09) (0.15) PCRU x MEAN 0.51*** 0.48*** (0.10) (0.11) VAR -0.17*** 0.03 (0.05) (0.06) REG x VAR -3.29 (3.31) VILL x VAR 0.22 (0.20) PCRU x VAR -0.41*** (0.08) Num. obs. 1815 1815 1815 1815 1815 1815
Wine Fixed Effects No Yes No No No No
R2 (full model) 0.16 0,16 0.16 0.17 0.17 0.17 ***p < 0.001, **p < 0.01, *p < 0.05
Note: Regressions are from pooled data with WTP as the dependent variable with participant clustered standard errors in parentheses. MEAN and VAR are continuous variables representing the average and the variance of wine grades within each batch of bottles. The interaction PCRU x WINE 0 controls for the presence of Fixin Premier Cru for umbrella effects.
Model 3 of Table 3 removes the GI levels dummies and includes the variables MEAN and VAR (respectively the average and the variance of quality within GIs). In line with our theoretical results, the average quality has a positive effect on WTP (€0.79 for a one-point
17 increase) and the variance of quality has a negative effect on WTP (€-0.17 for a one-point increase). These values are also robust with the inclusion of participants’ fixed effect (see Model 2 of Table SM2). Model 4 of Table 3 adds GI level dummies to the variables MEAN and VAR in order to show that the average quality effect from the variable MEAN is robust to the control of GI level effects. Compared to Model 2 of Table 3, the Village premium is halved (namely, €2.8 - €1.4) and the Premier Cru premium also declines by €2.4 (from €5.4 - €3). The introduction of GI dummies cancels the significance of the variable VAR, which means that quality uncertainty is related to GI levels in consumers’ perceptions. As shown in the summary statistics of Table 1, the effects of both quality and variance cannot be significantly disentangled from the effects of GIs levels.4
Models 5 and 6 in Table 3 focus on the interactions between MEAN, VAR and dummies about GI levels. The positive effect of average quality is statistically significant for both Village (€0.26) and Premier Cru (€0.51), while it is less precisely estimated for Régional. Hence, the effect of average wine quality is higher for high-quality GI levels. Model 6 shows that heterogeneity within Premier Cru significantly decreases the average WTP for the highest GI level. The uncertainty about wine quality within GI levels has a greater impact at the top of the hierarchy. Similar regressions did not find any significant effects of the variability at Régional and Village levels (see Models 3 to 6 in Table SM3).
B. Simulating change in Geographical Indications
WTP elicited in the experiment are now used for simulating scenarios of GI change in order to maximize consumers’ WTP in accordance with the guidelines provided by the theoretical model. We use the WTP declared during the experiment (and not the values that
4 By multiplying the scenarios in future researches, it would be possible to estimate the effect of VAR more precisely while controlling for GI levels.
18 could be predicted from one of the previous regressions). This can be done safely as the premiums estimated for GI levels are robust to the inclusion of participants’ fixed effects.
With the same representation as Figure 1, Figure 2 shows the average WTP for each
specific GI level (top two panels and bottom-left panel). The last bottom-right panel displays the average WTP for the whole Marsannay area, where the three specific WTPs are weighted by the share that corresponding GI levels represent. For each specific GI level, the scenario
maximizing the average WTP corresponds to the following combination: 20% Premier Cru, 50% Village, and 30% Régional, as circled on the three panels of Figure 2. This combination presents slight improvements compared to the current situation without Premier Cru, with average gains per bottle equal to €0.2 for the Régional and €0.1 for the Village level. These gains are small because of quantity substitutions that lower the WTP for the Village level with the creation of the higher level Premier Cru. However, the gains from the optimal scenarios compared to the worst scenarios are significant: €1.2 (€7.3- €6.1) for the Régional, €2.2 (€10.2- €8) for the Village, and €3.4 (€14- €10.6) for the Premier Cru. This indicates that the WTP
under the current GI designation are close to the optimum.
Over the whole Marsannay area, the scenario that maximizes the average WTP does not correspond to the previous scenario that maximizes the WTP for each GI level individually. The average WTP is maximized for the GI designation scheme with 40% Premier Cru, 40% Village, and 20% Régional, as indicated by the circle on bottom-right panel of Figure 2. This combination presents an average WTP of €10.9 per bottle for the whole Marsannay area. This result is explained by the weights put on the designated acreages in the new high level, which weight the gains for the Premier Cru level more heavily when more bottles are designated as Premier cru. The gain compared to the current GI designation scheme is significant, €2.5 (€10.9-€8.4) per bottle on average. While this scenario maximizes the average WTP for a bottle
policy-19 relevant. In particular, the scenario that maximizes the WTP for the Premier Cru is probably the scenario that limits the impact of this change in GI for the other Premiers Crus of the area (i.e., from other municipalities). Knowing the umbrella effects from other GIs in the region, it could make the GI reshuffling of Marsannay more acceptable at the regional scale.
Figure 2: Average WTP for the three GI levels individually and for all levels.
Note: Each triangle represents the full set of combinations proposed between the three GI levels (see Figure 1 for explanations). The two triangles at the top represent the average WTP for a Village and Régional level bottle respectively. The triangle at the bottom left represents the average WTP for a Premier Cru bottle from the Marsannay area, with the value of €14.9/bottle reported at the bottom (for 0% Premier Cru) corresponding to the average WTP for the Fixin Premier Cru bottle (WINE 0). The last triangle at the bottom right aggregates the previous triangles. The numbers represent the average WTP of the three levels, weighted by the proportions of the acreages delineated in each scenario.
20
V. Conclusion
We use elicited WTP from an original experimental protocol to simulate the optimal reshuffling of vineyard plots among the current GI levels, jointly with the introduction of a new high-quality level. We contribute to the empirical literature by proposing a BDM-based experiment to elicit ex ante consumers’ WTP when changes are made to GIs that enjoy a long history and good reputation. The results reveal a significant increase in WTP for wine bottles benefiting from a new high-quality ranking, while the loss is limited in other current levels. This confirms results from the simple theoretical model showing that a change in the GI scheme may increase the consumer surplus without changing the quality of the products supplied.
The decision to reshuffle GIs is obviously important for local wine producers who are naturally in favour of moving the maximum quantity of the best parcels of their vineyard up the hierarchy. They hope to benefit from the umbrella effect of the higher quality wine of the surrounding municipalities. From consumer perceptions, this decision to reshuffle current GIs engenders a trade-off. On the one hand, the promotion of the best wines from the medium level to higher level makes it easier to identify high-quality wines from this area, thereby increasing WTP compared with the current situation. On the other hand, the removal of these high-quality wines from the medium level lowers the average quality found at this level, which reduce WTP for it. Moreover, the credibility of current GI levels following the introduction of a new high-quality GI level could also be impacted by the comparative stigma. Distinguishing certain products (or places of production) as high-quality products could adversely affect consumer perception of other products remaining at the current levels. We do not find such effect, as the optimal allocations among the different GI levels shows a relatively high number of wines joining the high-quality level.
This approach can be applied to other wine regions or food products that are hierarchically structured by GI designation schemes. Following the Burgundy model, it is now
21 quite common for Italian, German or US wine GIs to include a vertical dimension in their designation schemes. Moreover, the theoretical framework underscores the benefits of changing GIs so as to provide consumers with more accurate, albeit still imperfect, information.
We did not study the impact of the GI reshuffling in others surrounding municipalities, which already have some vineyards designated as Premier Cru. The introduction of a Marsannay Premier Cru could change the perception of other Premier Cru of Burgundy. This potential effect of GI reshuffling has an important political importance at the regional scale that needs to be addressed in future researches. Nevertheless, we suggest that maximizing the WTP for Marsannay Premier Cru alone, instead of the average WTP for all the wines of the area, could be more acceptable by surrounding wine producers.
Beyond the case study under investigation, the mechanism and the protocol presented in this paper might be replicated by the INAO (in France), or by any administrative authority around the world (of wine), when addressing the reshuffling demand of other GIs.
References
Ashenfelter, O., and Storchmann, K. (2010). Using hedonic models of solar radiation and weather to assess the economic effect of climate change : The case of Mosel Valley vine- yards. Review of Economics and Statistics, 92(2), 333–349.
Ay, J.-S. (2020). The informational content of geographical indications. American Journal of Agricultural Economics. in press.
Becker, G.M., DeGroot, M.H. and Marschak, J. (1964) Measuring utility by a single-response sequential method. Behavioural Science 9: 226-232.
Bonroy, O. and Constantatos, C. (2015) On the economics of labels: How their introduction affects the functioning of markets and the welfare of all participants. American Journal of Agricultural Economics, 97(1): 239-259.
Combris, P., Lecocq, S. and Visser, M. (2000). Estimation of a hedonic price equation for Burgundy wine. Applied Economics, 32: 961–967.
Costanigro, M., Scozzafava, G. and Casini, L. (2019) Vertical differentiation via multi-tier geographical indications and the consumer perception of quality: The case of chianti wines. Food Policy, 83: 246-259.
22 Cross, R., Plantinga, A. J., and Stavins, R. N. (2017). Terroir in the New World: Hedonic Estimation of Vineyard Sale Prices in California. Journal of Wine Economics, 12(3), 282-301.
Deconinck, K. and Swinnen, J. (2014) The political economy of geographical indications. AAWE working paper No 174.
Fourcade, M. (2012) The vile and the noble: On the relationship between natural and social classifications in the French wine world. The Sociological Quarterly, 53: 524-545. Gergaud, O., and Ginsburgh, V. (2010). Natural endowments, production technologies and the
quality of wines in Bordeaux. Does terroir matter? Economic Journal, 118 (June), F142– F157.
Gokcekus, O. and Finnegan, C.M. (2017) Price effects of establishing a new sub-AVA within Oregon’s Willamette Valley AVA. Journal of Wine Economics, 12 (345).
Hakenes, H. and Peitz, M. (2009) Umbrella branding and external certification. European Economic Review, 53: 186-196.
Lavalle, J. (1855). Histoire et statistique de la vigne et des grands vins de la Côte d’Or. Daumier, Dijon.
Lusk, J.L. and Shogren, J.F. (2007) Experimental Auctions. Methods and Applications in Economic and Marketing Research. Cambridge University Press, Cambridge, UK. Meloni, G. and Swinnen, J. (2018). Trade and terroir: The political economy of the world’s first
geographical indications. Food Policy, 81:1–20.
Menapace, L. and Moschini, G. (2012) Quality certification by geographical indications, trademarks and firm reputation. European Review of Agricultural Economics, 39: 539-566.
Mussa, M. and Rosen, S. (1978) Monopoly and product quality. Journal of Economic Theory, 18: 301-317.
Schnabel, H. and Storchmann, K. (2010) Prices as quality signals: Evidence from the wine market. Journal of Agricultural & Food Industrial Organization, Vol. 8: Iss. 1, Article 2. Tirole, J. (1996) A theory of collective reputations (with applications to the persistence of
corruption and to firm quality). The Review of Economic Studies, 63(1), 1-22.
Yu, J., Bouamra-Mechemache, Z. and Zago, A. (2017) What is in a name? Information, heterogeneity, and quality in a theory of nested names. American Journal of Agricultural Economics, 100: 286-310.
23