LETTER • OPEN ACCESS
Twenty years of European mountain permafrost dynamics—the PACE
legacy
To cite this article: B Etzelmüller et al 2020 Environ. Res. Lett. 15 104070
View the article online for updates and enhancements.
Environmental Research Letters
OPEN ACCESS RECEIVED 27 February 2020 REVISED 10 July 2020 ACCEPTED FOR PUBLICATION 12 August 2020 PUBLISHED 6 October 2020Original content from this work may be used under the terms of the
Creative Commons Attribution 4.0 licence. Any further distribution of this work must maintain attribution to the author(s) and the title of the work, journal citation and DOI.
LETTER
Twenty years of European mountain permafrost dynamics—the
PACE legacy
B Etzelmüller1 , M Guglielmin2 , C Hauck3 , C Hilbich3 , M Hoelzle3 , K Isaksen4 , J Noetzli5 , M Oliva6 and M Ramos71 Department of Geosciences, University of Oslo, Norway
2 Department of Theoretical and Applied Sciences, Insubria University, Varese, Italy 3 Department of Geosciences, University of Fribourg, Switzerland
4 Norwegian Meteorological Institute, Oslo, Norway
5 WSL Institute for Snow and Avalanche Research SLF, Davos Dorf, Switzerland 6 Department of Geography, University of Barcelona, Spain
7 Physics and Mathematics Department, Alcal´a University, Spain
E-mail:bernd.etzelmuller@geo.uio.no
Keywords: mountain permafrost, PACE, Europe, monitoring, climate change, recent warming
Supplementary material for this article is availableonline
Abstract
This paper reviews and analyses the past 20 years of change and variability of European mountain
permafrost in response to climate change based on time series of ground temperatures along a
south–north transect of deep boreholes from Sierra Nevada in Spain (37
◦N) to Svalbard (78
◦N),
established between 1998 and 2000 during the EU-funded PACE (Permafrost and Climate in
Europe) project. In Sierra Nevada (at the Veleta Peak), no permafrost is encountered. All other
boreholes are drilled in permafrost. Results show that permafrost warmed at all sites down to
depths of 50 m or more. The warming at a 20 m depth varied between 1.5
◦C on Svalbard and
0.4
◦C in the Alps. Warming rates tend to be less pronounced in the warm permafrost boreholes,
which is partly due to latent heat effects at more ice-rich sites with ground temperatures close to
0
◦C. At most sites, the air temperature at 2 m height showed a smaller increase than the
near-ground-surface temperature, leading to an increase of surface offsets (SOs). The active layer
thickness (ALT) increased at all sites between c. 10% and 200% with respect to the start of the study
period, with the largest changes observed in the European Alps. Multi-temporal electrical resistivity
tomography (ERT) carried out at six sites showed a decrease in electrical resistivity, independently
supporting our conclusion of ground ice degradation and higher unfrozen water content.
1. Introduction
Permanently frozen ground is a globally widespread phenomenon with a coverage of more than 15% over the Northern Hemisphere land surface (Obu
et al 2019). Permafrost is thermally defined, with
ground temperatures in the lithosphere required to be below 0◦C over at least two consecutive years (van Everdingen1998). During the last few decades, permafrost has faced increased attention, especially in relation to the permafrost-climate feedback asso-ciated with the release of greenhouse gases like car-bon dioxide and methane due to thawing and decom-position of formerly frozen organic material (e.g. Schuur et al2015). Mountain permafrost in Europe
occupies barren ground, steep bedrock slopes, block fields, debris slopes or, if previously glaciated, drift-covered slopes and glacier fore-fields, and is nor-mally relatively low in ice content or organic mater-ial compared to the permafrost in Arctic lowlands. Exceptions are certain landforms, such as rock gla-ciers, coarse scree deposits or bogs in sub-arctic mari-time mountain regions in the form of palsas and peat plateaus.
The potential impact of atmospheric warming on mountain permafrost and the influence on slope sta-bility in alpine terrain was hardly recognized before the 1990s (Haeberli 1992). With the expansion of tourism and building of infrastructure such as cable car stations/masts and tourist facilities in the Alps,
global warming has influenced the consciousness of permafrost distribution and its thermal regime in high-mountain settings. There has been a demand for increased knowledge of (1) mountain permafrost dis-tribution, (2) permafrost thermal state and thickness, and (3) how permafrost would respond in a changing climate.
These questions triggered a European research initiative that included researchers from the United Kingdom, Germany, Switzerland, Norway, Sweden, Italy and Spain in 1998, resulting in the EU-funded PACE (‘Permafrost and Climate in Europe’) project, followed by the European Science Foundation net-work PACE-21 initiative, both co-ordinated by Prof. Em. C. Harris, University of Cardiff, UK. The three major objectives of the PACE project were related to monitoring ground temperatures in a latitudinal borehole transect, method development for mapping and modelling mountain permafrost, and hazard
assessment following possible permafrost degradation
(Harris et al2009).
In terms of method development, the focus was set to non-invasive geophysical investigations (Von-der Mühll et al 2001, Hauck et al 2001, 2004) and development of numerical modelling schemes for permafrost distribution (Etzelmüller et al2001, Hoelzle et al2001). Regarding geophysical monitor-ing, a baseline for continuous or regularly repeated electrical resistivity and seismic tomography monit-oring was established, both in the Alps (Hauck2002, Hilbich et al2008) and, to a minor extent, in Norway (Hauck et al2004, Isaksen et al2011). Such installa-tions were crucial to understanding the change of sub-surface conditions in terms of ice and water content, which follows changing environmental forcing.
Despite the short time series available at the start in the year 2000, all PACE sites from the Alps through Scandinavia to Svalbard provided geothermal evid-ence for regional-scale secular warming, with the greatest warming in Svalbard (Harris et al 2003, Isaksen et al 2007). The PACE borehole in south-ern Spain showed no permafrost; however, isolated patches were found in shaded northerly slopes that were glaciated during the Little Ice Age (G´omez-Ortiz
et al2019).
This paper analyses the last 20 years of change and variability of permafrost in European mountains based on the borehole infrastructure and data series established in the framework of the PACE project, along with an evaluation of sub-surface conditions and changes in ice content derived from multiple elec-trical resistivity tomography (ERT) surveys.
2. PACE borehole transect
The borehole monitoring network consists of seven boreholes which are at least 100 m deep and form a north–south transect from Svalbard to Spain (figure 1, suppl. table 1 (available online at
stacks.iop.org/ERL/15/104070/mmedia)), stretching from 78◦N to 37◦N. The boreholes in Janssonhaugen (Svalbard (N)) and Stelvio Pass (Italian Alps (I)) were drilled in 1998, the Juvvasshøe borehole (southern Norway (N)) was drilled in 1999, while the boreholes in Switzerland (CH), Sweden (S) and Spain (E) were drilled and instrumented in 2000.
All boreholes are drilled well above the treeline, on mountain summits or plateaus in bedrock, and over-lain by regolith or weathered bedrock with a thickness of up to 4 m. The bedrock types vary between fine-grained sedimentary and massive metamorphic rocks (suppl. table 1). The mean annual air temperature (MAAT) at the sites ranges from –7◦C on Svalbard,
via−3 to −6◦C in Scandinavia and the European
Alps, to 0◦C at the summits of the Sierra Nevada (E). The boreholes were instrumented with thermistor strings attached to data logging equipment or indi-vidual miniature temperature data loggers (MTDs), following standardised procedures to ensure compar-ability between sites (Harris et al 2001). One 60 m deep borehole drilled in 1987 at Murt`el–Corvatsch in the Eastern Swiss Alps (Haeberli et al 1999) was also included in the PACE project. This borehole was drilled into a rock glacier, and today comprises the longest time series of permafrost ground temperat-ures in the Alps (PERMOS2019).
All borehole sites have automatic weather stations adjacent to the boreholes. They measure standard key parameters of the atmosphere (SAT—surface air tem-peratures measured 2 m above ground) and near the ground surface (GST—ground surface temperatures measured between 2 cm and 5 cm into the ground), some including snow depth (the Swiss sites) and radi-ation (by four-component net radiometers). GST is measured either by separate MTDs, usually with a resolution better than±0.1◦C, or by the uppermost thermistor within the borehole. Most boreholes are protected by a concrete chamber, and tests in Norway and Switzerland indicate that GST measurements on the ground surface are slightly cooler (<0.5◦C annual average) than the 0.2 m depth thermistor string level in boreholes. We accept this deviation in our further aggregated analysis.
To further characterise the ground ice in the per-mafrost at the individual sites and provide inform-ation on the spatial representativeness of the bore-hole data, non-invasive geophysical surveys (ERT, seismic refraction tomography, and electromagnetic induction surveys) were conducted at all sites (Hauck
et al2001, Vonder Mühll et al2001). Of these tech-niques, the combination of ERT and seismic refrac-tion in particular can be used to detect and quantify ground ice occurrences (Hauck et al2004, Mollaret
et al2020). ERT, which is further used in this study, yields the electrical resistivity distribution of the sub-surface by injecting a current, and measuring the res-ulting electrical potential differences along the pro-file. Seismic tomography yields the P-wave velocity
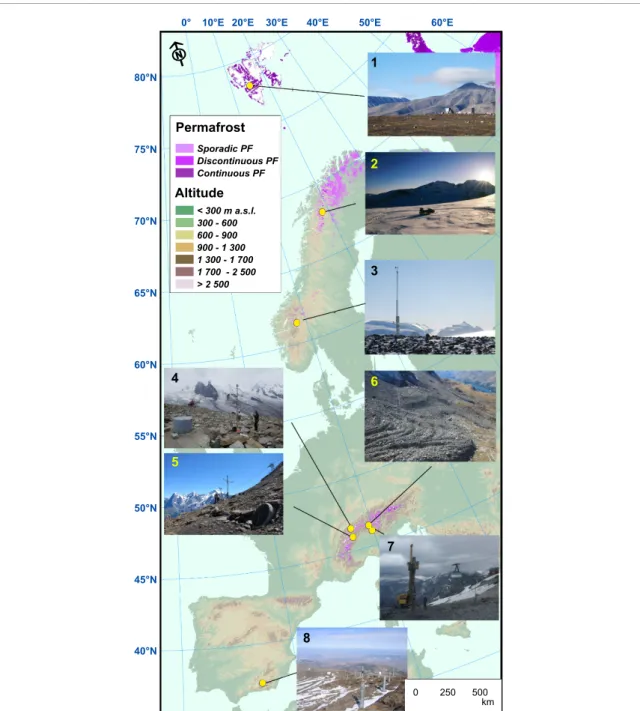
Figure 1. Location of the PACE borehole transect through Europe. (1) Janssonhaugen (Svalbard/Norway, 78◦N), (2)
Tarfalaryggen (Sweden, 68◦N), (3) Juvvasshøe (Norway, 62◦N), (4) Schilthorn (Switzerland, 47◦N), (5) Stockhorn (Switzerland, 46◦N), (6) Murt`el–Corvatsch (Switzerland, 46◦N), (7) Stelvio Pass (Italy, 47◦N), (8) Veleta Peak (Spain, 37◦N). The permafrost distribution is based on Obu et al. (2019).
distribution by using seismic shot points along the profile and measuring the resulting travel times of the seismic waves. High electrical resistivities are usu-ally associated with frozen conditions and ground ice occurrences, whereas low electrical resistivities indic-ate high liquid windic-ater content and unfrozen condi-tions. Repeated ERT surveys therefore give inform-ation about important changes in water/ice content in the ground, which cannot be detected by ground temperature measurements due to the effects of latent heat (Hauck2002). These surveys enable the determ-ination of whether a site is spatially homogeneous or heterogeneous in terms of subsurface sediment/bed-rock distribution and ice content, as each material has
different values in electrical resistivity and seismic P-wave velocity.
Profile lengths were between 200 m and 500 m, with a penetration depth of up to 30 m. A first per-manent monitoring line with fixed electrodes was established in 1999 at the Schilthorn (CH) site (Hauck 2002), and later an automatized measurement set-up as well as coincident seismic monitoring on a yearly basis were added (Hilbich2010). Since 2006 regular ERT monitoring has also been conducted along pro-files at Stockhorn (CH) and Murt`el–Corvatsch (CH) (Hilbich et al2008, Mollaret et al2019), which are operationally included in the Swiss permafrost mon-itoring network (PERMOS2019). Geophysical results
are validated at the PACE borehole locations using all additional data available along the profile lines such as spatial soil moisture data and additional boreholes (Pellet et al2016, Mollaret et al2020).
3. Climate change trends in European
mountain regions between 1981 and 2018
Near-surface air temperatures (SAT) in Europe have increased since the instrumental record began around 1860. The temperature increase has been especially pronounced over the last four decades (figure2(a)). Since 1981 the average SAT for the European land area has increased by 0.45◦C dec−1 from an aver-age value of + 8.8 ◦C for the domain (European Environmental Agency, data from June 2019). Dur-ing the ‘20 year PACE period’ (1999–2019), the SAT was 0.6◦C higher compared to the 1981–2010 nor-mal period and 1.6◦C above the pre-industrial level, which makes it the warmest 20-year period on record. The years 2014–2018 are ranked as the five warmest years on record for the European land area. Observed SAT trends obtained from the official weather stations near the PACE sites range from 1.4◦C dec−1at Sval-bard Airport to below 0.5◦C dec−1at all other sites (figure2(a), table1).The regional characteristics of the European tem-perature anomalies for 1999–2018 show that Europe has warmed, and the SAT anomaly for this period is four times larger in the high-Arctic Svalbard and about twice as large in the sub-Arctic alpine site in northern Sweden compared to southern Scandinavia and the Alps (figure2(b)), especially during winter (figure2(c)). Long-lasting extreme warm spells dom-inated during the summers (JJA) of e.g. 2002, 2014 (figure2(e)) and 2018 in Scandinavia and affected cryogenic features such as ice patches (perennial snowfields), which at the end of summer 2014 had their minimum extent on 2000 years (Ødegård et al 2017). The summers of 2003 and 2015–2019 with the exception of 2016 (figure2(f)) were extremely warm and dry in the European Alps. Cool periods were dominant during the winter seasons (DJF) 2010/11 (figure2(d)) and 2011/12 in Scandinavia, while in the Alps 2005–2006 was relatively cold.
Precipitation changes over the last decades are less well quantified than temperature changes, and they are often more heterogeneous in mountain regions (Hock2019). Since 1961 winter (DJF) precipitation in Norway has increased by 5.8% dec−1(MET Nor-way, https://www.met.no/vaer-og-klima/klima-siste-150-ar), while for Switzerland a slight increase of 0.7% dec−1 has been observed (MeteoSwiss, https ://www.meteoswiss.admin.ch/home/climate/climate-change-in-switzerland/temperature-and-precipitatio n-trends.html). Although trends in total or solid precipitation at high elevations are highly uncer-tain (Hock 2019), a winter precipitation decrease
of about 0.3% dec−1 has been found at high eleva-tions in Switzerland (Marty et al2017). In the high mountain regions of Norway the higher winter pre-cipitation since 1961 has led to increased snow accu-mulation (Dyrrdal et al2012) and a later end to the snow season (Rizzi et al2018). In contrast to Norway, snow accumulation, especially in spring, is decreasing in the Alps even at the highest locations because of decreasing precipitation amounts (Marty et al2017).
4. Development of snow cover and ground
surface temperature at the PACE sites
The trend for ground surface temperatures (GSTs) is positive for all sites (figure3) and varies between 0.2◦C dec−1 and 0.9◦C dec−1, which in general is two to three times higher than the SAT trend (table 1). At the Swiss sites this is true even though the max-imum annual snow heights do not show any signi-ficant trends during the 20-year period (suppl. Fig-ure2). The exception is Veleta Peak (E), where GST decreased with a rate of−0.3◦C dec−1, indicating a decrease in snow cover during winters. Analysing the first and last day of snow for each winter along with the number of snow days for the Swiss sites (suppl. Figure2), a reduction in annual snow-cover duration between 0 d dec−1and 15 d dec−1 is observed. The same applies at all sites for the number of thawing days each year, where we calculate an increase of up to 10 d dec−1(suppl. Figure3). GST thawing (TDD) and freezing degree days (FDD) through the hydrological year follow the same pattern, with general decreasing FDD trends (between−35◦C d dec−1and−470◦C d dec−1) and increasing TDD trends between +17◦C d dec−1and +124◦C d dec−1(table1, figure3).5. Ground thermal regime
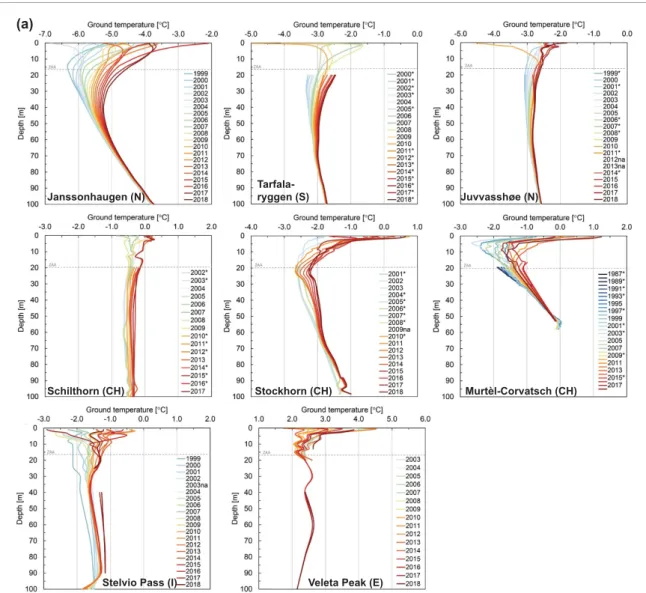
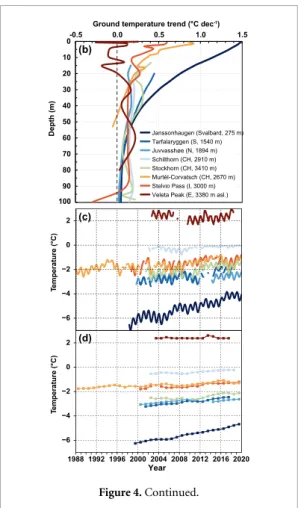
The depth of the zero annual amplitude (ZAA) was similar across the sites, with values between 15 m and 20 m (figure4(a)). Rising ground temperatures were observed at all PACE sites since 2000 down to depths of c. 50 m (figure4(b)). In 2018, record-high ground temperatures occurred at 50 m depth (figures 4(a), (b)), with the exception of Stockhorn (CH) and Murt`el–Corvatsch (CH), where the warmest year was 2015, followed by a temporary cooling due to a couple of winters with very late snow cover. At 20 m depth the warming rate varied between +0.2 ◦C dec−1 (Schilthorn, CH) and +0.8◦C dec−1 (Janssonhau-gen, N) (figures4(c), (d)). The warming trend is par-ticularly pronounced at colder sites, e.g. at Jansson-haugen (Svalbard) and Stockhorn (CH). At sites with ground temperatures close to 0 ◦C, e.g. Schilthorn (CH), latent heat consumption upon thawing per-turbs the temperature signal and ongoing changes in permafrost conditions can hardly be detected based
T ab le 1. D eca dal tr ends o f gr ound sur fa ce par ame te rs and se le ct ed gr ound te mp er atur es (GT at 10 m d ep th) at the P A CE sit es. SA T = sur fa ce air te mp er atur e, GST = gr ound sur fa ce te mp er atur e, SO = sur fa ce o ff se t (SA T – GST ). TDD = tha w ing d eg re e da ys, FDD = fr eezing d eg re e da ys. SD ep th = sno w d ep th, SDa ys = n umb er o f sno w da ys. AL T = ac ti ve la ye r thic kness. T he AL T p er ce ntag e chang es ar e calculat ed in re lat io n to the av er ag e AL T thr oug h the meas ur eme nt p er io d. TRENDS SA T GST (a vg) GST |TDD| GST |FDD| GT (20 m) SD ep th SDa ys SO AL T (2000–2019) ( ◦ C d ec − 1 ) ( ◦ C d ec − 1 ) ( ◦ C Da y d ec − 1 ) ( ◦ C Da y d ec − 1 ) ( ◦ C d ec − 1 ) (cm d ec − 1 ) (da ys d ec − 1 ) ( ◦ C d ec − 1 ) (cm d ec − 1 ) Jansso nhaug en + 0,9 + 0,9 + 57 − 470 + 0,48 N A N A + 0,1 + 17 (18%) T ar falar yg ge n − 0,7 + 0,2 N A N A + 0,28 N A N A N A + 13 (15%) Ju vvasshøe + 0,2 + 0,7 + 17 − 46 + 0,11 N A N A − 0,4 + 7 (5%) Sc hiltho rn + 0,5 + 0,3 + 18 − 34 + 0,15 − 1,4 − 7 + 0,3 + 223 (70%) St o ckho rn + 0,2 + 0,6 + 33 − 100 + 0,18 + 2,1 − 15 − 0,2 + 43 (23%) M ur t`el–C o rv atsc h + 0,3 + 0,6 + 124 − 35 + 0,12 + 4,4 + 3 − 0,1 + 36 (19%) St el v io P ass + 0,7 ∗ + 0,7 N A N A + 0,21 N A N A + 0,8 + 70 (23%) V ele ta P eak + 1,2 − 0,3 − 57 + 150 0 N A + 1.0 N A *Data fr o m near b y climat e stat io n V al V al la cia (2650 m a.s.l.). T he tr ends ar e calculat ed using a linear re gr essio n (y = ax + b ), w he re the d ep end ent var iab le (x ) is time, and the tr end is the co efficie nt o f time (a ) calculat ed fo r a d eca d e (d ec).
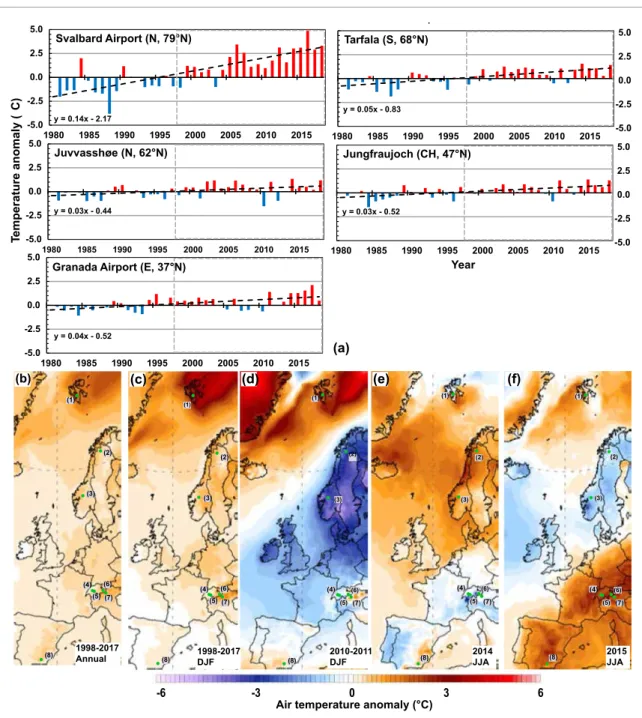
Figure 2. (a): Time series of MAAT from 1981 to 2018 obtained from official weather stations. The stations are located at the
PACE boreholes (Tarfala (S), Juvvasshøe (N)), below 5 km away (Svalbard Airport (Janssonhaugen (N)) and Jungfraujoch (Schilthorn (CH))) or 25 km away (Granada airport/Veleta Peak (ES))). Annual values are shown as temperature anomalies with respect to the 1981–2010 average. The vertical grey dotted line marks the start of the PACE period. At all stations, a warming trend is observed, most significant in the North. (b)–(f) Selected annual and seasonal air temperature anomalies during the 20-year PACE period 1998–2017 in respect to the reference period 1981–2010. Numbers on the maps refer to the PACE sites; for location names refer tofigure 1. (b) Annual air temperature anomalies for the 20-year PACE period 1998–2017. (c) Same as in (b) but for winter (DJF). (d) Particularly cold winter 2010–2011 in Scandinavia. (e) Extraordinarily warm 2014 summer in Scandinavia. (f) Summer heat wave 2015 in central Europe. Based on ERA5 Reanalysis (Hersbach et al2020) obtained from Climate Reanalyzer (https://ClimateReanalyzer.org), Climate Change Institute, University of Maine, USA.
on temperature measurements alone. Finally, Tar-falaryggen (S) shows a pronounced ground temper-ature (GT) increase, and the site is now warmer than Juvvasshøe (N) at both 10 m and 20 m depth. This is probably related to the period 2010–2013, in which very cold winters occurred especially in south-ern Scandinavia, cooling the Juvvasshøe ground tem-peratures, while ground temperatures continued to increase at Tarfalaryggen (S).
At the non-permafrost site Veleta Peak (E), we observe a cooling trend of−0.2◦C dec−1since 2002
(Oliva et al 2016), which is in alignment with the decreasing GST and probably related to shorter or lack of snow cover during winter due to higher SAT or higher winter sublimation (Herrero et al2016). Thus, at warmer and more southerly sites, including many Mediterranean mountains, the reduction in the thick-ness and persistence of the winter snow cover may keep ground temperatures more constant or even cool the ground despite increasing SAT.
The ALT, here determined by linear interpola-tion of the 0 ◦C isotherm based on daily ground
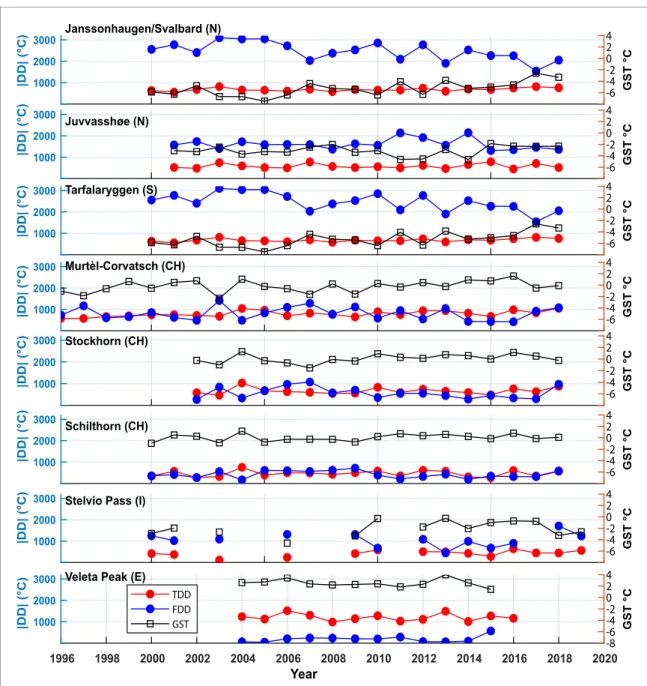
Figure 3. Freezing and thawing degree days (FDD, TDD) along with average GST trends calculated over an annual season
(September to August). At all sites, besides Veleta Peak, we observe a warming trend for GST and a clear reduction of FDD during the measurement period. The most pronounced trends are observed on Janssonhaugen/Svalbard (N, see table1). At most sites the inter-annual variation of FDD is higher than that of TDD. DD = degree days.
temperature data at different depths in boreholes, increased during the monitoring period for all per-mafrost sites. The increase varied between 0.12 m and 4 m (figures 5(a), (b)), which corresponds to between 5% and 70% in relation to the mean ALT over the study period (figures5(c), (d)). The Swiss sites showed more pronounced active layer thicken-ing in spite of similar or lower warmthicken-ing rates at the ground surface (figure5(d)). This is likely related to additional processes affecting the local thermal con-ditions (advective heat transport, radiation balance). Particularly for Schilthorn (CH), such an additional impact on the increase in SAT is likely. The ALT more than doubled during the PACE period from 4.4 m in 1999 to 10 m in 2019 (figure5(b)), while the SAT increase per year was +0.045 for the same 20-year period (PERMOS2019).
6. Changing subsurface conditions based
on geophysical investigations
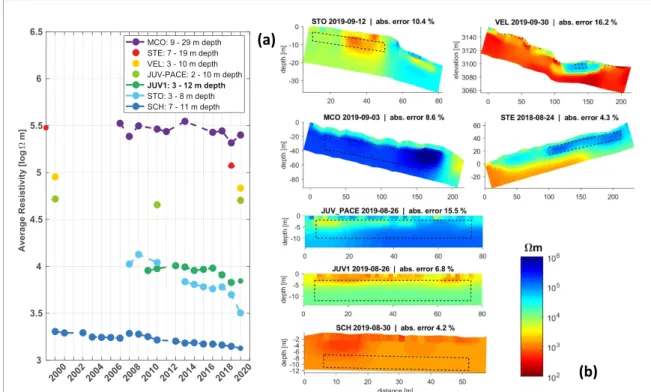
The repeated ERT surveys showed a general trend of decreasing resistivity corresponding to an ice content decrease or a liquid water content increase (figure6). The negative resistivity change is most pronounced for Stockhorn and Schilthorn (both CH), with a total decrease of >12% and 5%, respectively, between the first and the last measurement. The negative trend was less pronounced for the two profiles at Juvvasshøe (N, Juv-PACE and Juv1) with a reduction of resistivit-ies between−0.2% and −3%, and −2% at Murt`el– Corvatsch (CH). Hereby, the two ERT monitoring sites at Juvvasshøe (N), being c. 500 m apart, show different behaviour. This is probably due to the dif-ferent surface material and the overall drying of the
Figure 4. (a): Mean annual ground temperature profiles at the study sites from 1987 to 2018. The level of the ‘zero annual
temperature amplitude’ (ZAA) is marked by a grey dotted line. This line denotes the depths at which the seasonal surface temperature amplitudes vanish. Years marked with∗show mean temperature below ZAA only due to less than 300 d available for that particular year. (b): Observed GT linear trends (◦C dec−1) down to 100 m for the period 2002–2018. Only Janssonhaugen and Murt`el–Corvatsch have enough data to also calculate near-surface trends. On all sites besides Murt`el–Corvatsch, a positive trend is observed at all depths. Murt`el–Corvatsch showed a slight cooling for the deepest thermistors. The Arctic site on Janssonhaugen shows the most pronounced warming trend. Development of GT in 10 m (c) and 20 m (d) depth, respectively. There is an increasing trend for all sites, which is more pronounced for the colder sites. While at 20 m depth we mainly observe warming, at 10 m depth cool seasons can delay warming trends.
resistivity profile at the Juvvasshøe borehole. The dry-ing of degraded permafrost sites often leads to an increase of resistivities despite a decrease in ice con-tent, which has been described earlier at Juvvasshøe (N) (Isaksen et al2011).
Here we also show the mean resistivity val-ues for the ice cores of two rock glaciers in Sierra Nevada (Veleta Cirque, E) and Stelvio (I), respect-ively, less than 1 km away from the respective bore-holes (figure6). Both profiles were first measured in 1999 and re-measured in 2018/2019. The three rock glaciers (Murt`el–Corvatsch (CH), Veleta Cirque (E) and Stelvio (I)) consistently show the highest overall resistivity values, indicating ice-supersaturated con-ditions. While the rock glaciers in Veleta Cirque
(−3%) and Murt`el Corvatsch (−2%) have not
exhib-ited strong resistivity changes over the past 20 years,
the resistivity values clearly decreased in the ice core of the Stelvio rock glacier by a similar magnitude to those observed in the other PACE profiles in the Swiss Alps (−10%). However, at the Veleta rock glacier, sur-face lowering was clearly detected by geodetic meas-urements (G´omez-Ortiz et al2019), which is attrib-uted to ice loss. For massive ice bodies, resistivity changes are expected to be smaller than for sites with less ground ice, as the blocky surface layer of rock gla-ciers effectively insolates the permafrost, and ice-rich permafrost is more inert.
Resistivity at Schilthorn (CH) decreased through-out the entire investigation depth of the ERT profile (~12 m) indicating a profound permafrost degrada-tion and a general wetting of the ground. This obser-vation is probably due to the generally high amount of available snowmelt water and the larger potential
Figure 4. Continued.
water storage in the now unfrozen sediment part of the slope (Mollaret et al2019). At Stockhorn (CH), strong resistivity decreases have been observed in the uppermost permafrost layer during recent years. This decrease indicates an increasing unfrozen water con-tent in the warming permafrost and is, in contrast to Schilthorn, spatially less uniform due to more hetero-geneous ground conditions.
7. Discussion
7.1. Ground temperature change and environmental forcing factors
Permafrost temperatures and dynamics observed at the eight PACE sites show a consistent warming dur-ing the last 20 years. This is in line with observed trends elsewhere in permafrost regions of the world, both in lowland and mountain areas (Hjort et al 2018, Biskaborn et al 2019, Karjalainen et al2019). Biskaborn et al (2019) report an average increase of c. +0.2 ◦C dec−1 at the depth of ZAA for moun-tain regions, which is similar to our data set outside Svalbard. In Svalbard, we obtained a warming trend of +0.8◦C dec−1 at the ZAA (figures4(c), (d)). We observe greatest warming at the colder sites, which aligns with the general global pattern described for other regions such as from the Arctic lowland per-mafrost areas in North America and Russia (Roman-ovsky et al2010). While clear warming and cooling
trends are visible above 10 m depth, following inter-annual climate variability, at larger depths a tem-porary cooling is only visible at Murt`el–Corvatsch and Stockhorn after 2015 (both CH) due to snow-poor winters. It is evident that the last years were the warmest on record at all sites. Independently recon-structed GST by inversion of temperature data from a deep borehole drilling near Stelvio Pass (I) revealed the strongest warming per decade between 1990 and 2011 (>0.8◦C dec−1) since 1500 AD (Guglielmin et al 2018). Finally, the decreasing resistivity (ERT) trend matches the atmospheric warming since the start of the PACE project, and independently confirms per-mafrost degradation by substantial ice loss.
An interesting observation is the identification of warm and cold periods in the permafrost, which occurred in different years in northern and central/-southern Europe. Especially warm summers, like the summers of 2003 and 2015 in central Europe, led to extreme thawing of the active layer, and a reduc-tion of ice content in the ground, as observed at e.g. Schilthorn (Hilbich et al2008, Mollaret et al2019). The loss of ground ice is not necessarily recovered in the following years, even if ALT may ‘normalise’ after such events (Hilbich et al 2008). Cool sum-mers and winters, like the couple of years after the period between 2010 and 2015 in Scandinavia, led to a significant cooling in the upper permafrost lay-ers; however, the period was too short to reverse the increasing ground temperature trend at depth (fig-ure4(a)). Thus, the inter-annual ground temperature variations are not simultaneous in the Alps and the northern mountain areas.
It is evident from our observations that changes in snow conditions are major drivers of the observed differences and trends at the study sites. We find at almost every site that GST increases at a higher rate than SAT. This implies a change of the buffer layer effect by snow and/or vegetation dynamics. There seems to be no trend in snow thickness; however, snow-cover duration is shortened where measure-ments are available, therefore amplifying non-linear processes such as albedo feedbacks affecting surface temperatures and leading to corresponding strong ground thermal reactions. Related to this is the length of the thawing season, which increased at all sites. This dynamic obviously influences the GST and in turn the near-surface permafrost temperatures, as investigated using physically based models (Marmy et al2016). A decreasing trend in snowfall days has been reported in comparison to total winter precipitation days (Ser-quet et al2011), as well as an increase in rain-on-snow events during recent decades (Beniston2005, Hansen
et al2014, Vikhamar-Schuler et al2016). These events have a long-lasting warming impact on near surface ground temperatures because of latent heat release during refreezing of rain (Westermann et al2011).
Differences along the latitudinal transect are also related to the SO, which is generally higher at the sites
Figure 5. ALT development in absolute values (a), (b) and relative values in relation to overall mean ALT (c), (d), respectively for
the northern sites (a), (c) and the European Alps (b), (d). There is a general increase in ALT, which is most pronounced at the sites in the European Alps (b). The extreme seasons are clearly visible in the plots, e.g. 2003 at Schilthorn (CH). The ALT is determined by finding the largest depth during a season where GT > 0.0◦. As this depth normally falls between two thermistor locations, linear interpolation has been used to estimate the ALT. Determining ALT based on temperature measurements may result in deviations to real ALT, especially in ice-rich ground. Juv = Juvvasshøe (N), Jan = Janssonhaugen (Svalbard, N),
Tar = Tarfalaryggen (S), Sch = Schilthorn (CH), Sto = Stockhorn (CH), Cor = Murt`el–Corvatsch (CH), Stel = Stelvio Pass (I).
Figure 6. (a) Time series of the specific resistivity values (a resistivity decrease corresponds to an ice content decrease) averaged
over a representative zone within the permafrost body for the four PACE sites, where regular ERT measurements are available. Mean resistivities were calculated for a c. 15–140 m wide and 3–20 m deep subsurface zone within the permafrost body depending on the respective profile dimensions (b). Resistivity changes within this zone are considered representative for the ground ice content changes of the permafrost body. At the Juvvasshøe PACE borehole the original ERT surveys were repeated after 11 and 20 years, at Stelvio and Veleta Cirque rock glaciers (<1 km away from the respective boreholes) only once after 20 years. (b): ERT tomograms of the most recent measurements in 2018/2019 for all sites. Dashed rectangles indicate the representative zones used for the calculation of the time series in (a). MCO = Murt`el–Corvatsch (CH, 46◦N), STE = Stelvio (I, 47◦N), VEL = Veleta Cirque (E, 37◦N), JUV-PACE/JUV1 = Juvvasshøe (N, 62◦N), STO = Stockhorn (CH, 46◦N), SCH = Schilthorn (CH, 47◦N).
in the Alps and in southern Spain (SAT-GST =−2.8◦ to −5.5 ◦C during winter) than at the sites in Scandinavia (−2◦C to −0.5◦C) (suppl. figure 3). This is probably related to a thicker snow cover and stronger shortwave radiation. The meteorolo-gical observations at the Stockhorn, Schilthorn and Murt`el–Corvatsch sites (all CH) reveal that Stock-horn receives more incoming shortwave than long-wave radiation in comparison to Schilthorn and Murt`el–Corvatsch. As shortwave radiation has a pro-nounced impact on the GST and the corresponding GT below when the ground is snow-free, the resulting SO will become larger in comparison to the other sites where SAT and the corresponding incoming longwave radiation is dominant (Hoelzle et al, unpubl. data.). The development of the ALT is in line with this obser-vation, as it is larger and has deepened more at the sites in the Alps (>10% in relation to mean ALT) than at the northern sites (<10%).
7.2. Legacies of the PACE project
The PACE boreholes and data derived from the pro-ject triggered (1) the development of numerical mod-elling in permafrost areas and (2) the development of observation of permafrost change through non-invasive geophysical methods.
Concerning numerical modelling, the PACE bore-holes in Europe provide a baseline for calibration and validation of permafrost distribution and evolution models. Ground temperature monitoring is the only explicit thermal ground truth for mountain perma-frost, besides morphological evidence such as rock glaciers and palsa mounds. Any kind of thermal mod-elling efforts are thus dependent on reliable long-term monitoring stations (e.g. Ekici et al 2015, Marmy
et al2016, Pruessner et al2018). Mountain
perma-frost modelling approaches during the 1990s were dominated by empirical models based on bottom temperature of snow cover (BTS) measurements. With the PACE project, transient permafrost evolu-tion and process model development was initiated in Europe (Hoelzle et al2001, Etzelmüller et al2001), undoubtedly improving the understanding of specific mountain permafrost processes (Scherler et al2014, Marmy et al2016, Wicky and Hauck2017).
Concerning geophysical methods, the PACE initi-ative for the first time established geophysical survey-ing and monitorsurvey-ing principles within mountain per-mafrost science. The feasibility of using ERT surveys as a standard method to non-invasively and spatially detect permafrost occurrences was first established within the PACE project (Hauck and Vondermühll 1999). Subsequently, in a multitude of permafrost studies ERT was and still is applied for a large vari-ety of objectives (Supper et al2014, Kneisel et al2014, Magnin et al2015, Douglas et al2015, Keuschnig et al 2017), including the long-term permafrost monitor-ing examples shown in figure6(Mollaret et al2019).
Similarly, refraction seismic tomographic measure-ments were established as complementary method (Draebing 2016) including monitoring application (Hilbich2010).
The PACE project triggered an increased aware-ness of mountain permafrost research and prob-lems related to changing environmental conditions in high-mountain settings (Harris et al2009). Dur-ing the project period and thereafter, some stand-ards for monitoring of permafrost in mountains were developed, which later have been used in other pro-jects, e.g. for borehole and geophysical monitoring (Christiansen et al 2010, Farbrot et al 2011, Hil-bich et al 2011, Mollaret et al 2019). The drilling of the Swiss boreholes initiated the formation of the Swiss Permafrost Monitoring Network PERMOS (PERMOS2019) in the year 2000, which today man-ages the permafrost network there. In addition, in areas such as in southern Spain, no awareness about the existence of permafrost existed, and the results derived from the PACE borehole appearing in the media helped to disseminate and sensitise the public to the importance of permafrost for high-mountain Mediterranean ecosystems as well as its perception as a geo-indicator of climate change.
8. Conclusions
From this study the following conclusions can be drawn:
• All boreholes along the European latitudinal
tran-sect have warmed since the start of this century, down to depths of 50 m. At 20 m depth, warming rates varied between +0.2◦C dec−1and +0.8◦C dec−1.
• The ground temperature increase in the Arctic
(Svalbard) is very pronounced. Measurements at the sites in Scandinavia and the Alps reveal slightly reduced warming, which is mainly related to latent heat effects caused by relatively higher ice contents and by SO effects.
• In general, surface air temperature showed a
smal-ler increase than ground surface temperature, while the SO increased during the measurement period. This seems to be associated with reduced snow cover duration.
• The ALT increased at most sites, particularly at
those in the European Alps. This might be asso-ciated with ice loss during extreme warm sum-mers and generally higher summer temperatures. ALT is largest at the sites in the European Alps, which seems to be associated with partly lower ice contents, higher shortwave surface insolation and advective heat transport effects due to warmer ground conditions.
• Electrical resistivity tomography monitoring
showed a decrease of specific electrical resistivity at all presented sites, indicating ice loss and/or higher
unfrozen water content. The observed resistivity decrease seems more pronounced for ice-poor permafrost sites.
The PACE boreholes continue to act as a baseline for observing thermal changes in permafrost in European mountain areas. The sustainability of long-term monitoring is essential to documenting changes in high-mountain environments in the future. Only the combined efforts of long-term monitoring of ground temperatures and ice contents with the local observations of the microclimatic conditions at the different sites offer a much better insight into the permafrost dynamics since the first results from the PACE project were published.
Acknowledgments
The study is based on the co-operative work of the authors, who put together the various data sources related to the PACE transect boreholes. All authors contributed likewise, and the author list therefore is alphabetical. The first author (BE), together with KI, MH, JN, CHi and CHa, took the initiative to pro-duce this summarising study. BE has co-ordinated the writing process and therefore serves as correspond-ing author. All authors affiliated to universities have received support for following up data monitoring from their respective home institutions. The study provided by KI and long-term permafrost monitoring at the two Nordic sites Janssonhaugen and Juvvasshøe were supported by the Norwegian Meteorological Institute. Permafrost data from Tarfalaryggen was provided by Profs. Peter Jansson and Per Holmlund, and the data are available through the Bolin Centre for Climate Research (https://bolin.su.se/). MO is supported by the Ram´on y Cajal Program (RYC-2015-17597) and the Research Group ANTALP (Ant-arctic, Arctic, Alpine Environments; 2017-SGR-1102) funded by the Government of Catalonia through the AGAUR agency. Data of the three Swiss boreholes are provided by the Swiss Permafrost Monitoring Net-work (PERMOS) with financial support from the Federal Office for the Environment, MeteoSwiss in the framework of GCOS Switzerland and the Swiss Academy of Sciences. The boreholes were maintained by the Universities of Zurich and Fribourg. Part of the study (CHa and CHi) was conducted within the REP-ERT project (funded by the Swiss GCOS Office). The Stelvio station in Italy was maintained thanks to different projects run during the monit-oring period, in particular the project ‘Share Stelvio’ of Regione Lombardia and the project ‘Responses of Sensitive Alpine Ecosystems to Climate Change’ (RESACC, 2015N8F555) funded by Italian Ministry of Research and University (MIUR). Figures2 and
4(a), (b) were created by KI, while JN created fig-ure4(c). Sebastian Westermann, University of Oslo, commended an earlier version of this article.
Professor Em. C. Harris (UK) was coordinator of the PACE project, enabling the international collab-oration and the inspiration for our study. The differ-ent national groups participating in the PACE pro-ject were led by Professor W. Haeberli and Dr. D. Vonder Mühll (both CH), Professor J.L. Sollid (1932– 2019) (N), Professor P. Holmlund (S), Professor F. Dramis (I), Professor L. King (D) and Professor D. Palacios (E). The manuscript was greatly improved by the review comments of Dr Louise Farquharson, University of Alaska Fairbanks (USA), an anonymous reviewer and the editor. We want to thank all men-tioned persons and institutions.
Data statement
All the Swiss data are subject to the PERMOS Data Policy (open access), available online (via http://permos.ch/data.html). The latest DOI is 10.13093/permos-2019-01 and includes all data used in this study. For the other sites, the data that sup-port the findings of this study are available from the corresponding author upon reasonable request.
ORCID iDs
B Etzelmüller https://orcid.org/0000-0001-5156-3653 K Isaksenhttps://orcid.org/0000-0003-2356-5330 M Ramoshttps://orcid.org/0000-0003-3648-6818References
Beniston M 2005 Warm winter spells in the Swiss Alps: strong heat waves in a cold season? A study focusing on climate observations at the Saentis high mountain site Geophys. Res. Lett.32 L01812
Biskaborn B K et al 2019 Permafrost is warming at a global scale Nat. Commun.10 264
Christiansen H H et al 2010 The thermal state of permafrost in the Nordic area during the international polar year 2007–2009 Permaf. Periglac. Process.21 156–81
Douglas T A, Jorgenson M T, Brown D R, Campbell S W, Hiemstra C A, Saari S P, Bjella K and Liljedahl A K 2015 Degrading permafrost mapped with electrical
resistivity tomography, airborne imagery and LiDAR, and seasonal thaw measurements J. Geophysics
81 WA71–85
Draebing D J 2016 Application of refraction seismics in alpine permafrost studies: a review Earth Sci. Rev.155 136–52
Dyrrdal A V, Saloranta T, Skaugen T and Stranden H B J H R 2012 Changes in snow depth in Norway during the period 1961–2010 J. Hydr. Res.44 169–79
Ekici A, Chadburn S, Chaudhary N, Hajdu L, Marmy A, Peng S, Boike J, Burke E, Friend A and Hauck C 2015 Site-level model intercomparison of high latitude and high altitude soil thermal dynamics in tundra and barren landscapes Cryosphere9 1343–61
Etzelmüller B, Hoelzle M, Heggem E S F, Isaksen K,
Stocker-Mittaz C, Ødegård R S, Haeberli W and Sollid J L 2001 Mapping and modelling the occurrence and
distribution of mountain permafrost Nor. Geogr. Tidskr.
55 186–94
Farbrot H, Hipp T F, Etzelmuller B, Isaksen K, Odegard R S, Schuler T V and Humlum O 2011 Air and ground temperature variations observed along elevation and continentality gradients in Southern Norway Permaf. Periglac. Process.22 343–60
Guglielmin M, Donatelli M, Semplice M and Capizzano S S 2018 Ground surface temperature reconstruction for the last 500 years obtained from permafrost temperatures observed in the SHARE STELVIO Borehole, Italian Alps Clim. Past
14 709-24
G´omez-Ortiz A, Oliva M, Salvador-Franch F, Palacios D, Tanarro L M, de Sanjos´e-Blasco J J and Salv`a-Catarineu M J P 2019 Monitoring permafrost and periglacial processes in Sierra Nevada (Spain) from 2001 to 2016 Permaf. Periglac. Process.
30 278–91
Haeberli W 1992 Construction, environmental problems and natural hazards in periglacial mountain belts Permaf. Periglac. Process.3 111–24
Haeberli W, K¨a¨ab A, Wagner S, Mühll D V, Geissler P, Haas J N, Glatzel-Mattheier H and Wagenbach D 1999 Pollen analysis and 14 C age of moss remains in a permafrost core recovered from the active rock glacier Murtel–Corvatsch, Swiss Alps: geomorphological and glaciological implications J. Glaciol.
45 1–8
Hansen B B, Isaksen K, Benestad R E, Kohler J, Pedersen Å Ø, Loe L E, Coulson S J, Larsen J O and Varpe Ø 2014 Warmer and wetter winters: characteristics and implications of an extreme weather event in the high Arctic Environ. Res. Lett.
9 114021
Harris C, Haeberli W, Vonder Mühll D and King L 2001 Permafrost monitoring in the high mountains of Europe: the PACE Project in its global context Permaf. Periglac. Process.12 3–11
Harris C et al 2009 Permafrost and climate in Europe: monitoring and modelling thermal, geomorphological and geotechnical responses Earth-Sci. Rev.92 117–71
Harris C, Vonder Mühll D, Isaksen K, Haeberli W, Sollid J L, King L, Holmlund P, Dramis F, Guglielmin M and Palacios D 2003 Warming permafrost in European mountains Glob. Planet Change39 215–25
Hauck C 2002 Frozen ground monitoring using DC resistivity tomography Geophys. Res. Lett.29 1–4
Hauck C, Guglielmin M, Isaken K and Vonder Mühll D 2001 Applicability of frequency- and time-domain
electromagnetic methods for mountain permafrost studies Permaf. Periglac. Process.12 39–52
Hauck C, Isaksen K, Vonder Mühll D and Sollid J L 2004 Geophysical surveys designed to delineate the altitudinal limit of mountain permafrost: an example from
Jotunheimen, Norway Permaf. Periglac. Process.15 191–205
Hauck C and Vonder Mühll D 1999 Using DC resistivity tomography to detect and characterise mountain permafrost EAGE 61st Conference and Technical Exhibition (Helsinki, Finland) (https://doi.org/10.3997/2214-4609.201407626) Herrero J, Polo M J and Eugster W 2016 Evaposublimation from
the snow in the Mediterranean mountains of Sierra Nevada (Spain) Cryosphere10 2981–98
Hersbach H, Bell B, Berrisford P, Hirahara S, Hor´anyi A, Muñoz-Sabater J, Nicolas J, Peubey C, Radu R and Schepers D 2020 The ERA5 global reanalysis Q. J. Roy Meteor. Soc.146 1999–2049
Hilbich C, Fuss C and Hauck C 2011 Automated time-lapse ERT for improved process analysis and monitoring of frozen ground Permaf. Periglac. Process.22 306–19
Hilbich C, Hauck C, Hoelzle M, Scherler M, Schudel L, Voelksch I, Vonder Mühll D and Maeusbacher R 2008 Monitoring mountain permafrost evolution using electrical resistivity tomography: a 7-year study of seasonal, annual, and long-term variations at Schilthorn, Swiss Alps J. Geophys. Res.113 F01S90
Hilbich C 2010 Time-lapse refraction seismic tomography for the detection of ground ice degradation Cryosphere4 243–59
Hjort J, Karjalainen O, Aalto J, Westermann S, Romanovsky V E, Nelson F E, Etzelmüller B and Luoto M 2018 Degrading permafrost puts Arctic infrastructure at risk by mid-century Nat. Commun.9 5147
Hock R E A 2019 IPCC - Intergovernmental Panel on Climate Change IPCC Special Report on the Ocean and Cryosphere in a Changing Climate pp 131–202
Hoelzle M, Mittaz C, Etzelmüller B and Haeberli W 2001 Surface energy fluxes and distribution models relating to permafrost in European Mountain areas: an overview of current developments Permaf. Periglac. Process.12 53–68
Isaksen K, Odegard R S, Etzelmuller B, Hilbich C, Hauck C, Farbrot H, Eiken T, Hygen H O and Hipp T F 2011 Degrading mountain permafrost in Southern Norway: spatial and temporal variability of mean ground temperatures, 1999–2009 Permaf. Periglac. Process.
22 361–77
Isaksen K, Sollid J L, Holmlund P and Harris C 2007 Recent warming of mountain permafrost in Svalbard and Scandinavia J. Geophys. Res.112 F02S04
Karjalainen O, Aalto J, Luoto M, Westermann S, Romanovsky V E, Nelson F E, Etzelmüller B and Hjort J 2019 Circumpolar permafrost maps and geohazard indices for near-future infrastructure risk assessments Sci. Data6 190037
Keuschnig M, Krautblatter M, Hartmeyer I, Fuß C and Schrott L 2017 Automated electrical resistivity tomography testing for early warning in unstable permafrost rock walls around alpine infrastructure Permaf. Periglac. Process.
28 158–71
Kneisel C, Emmert A and K¨astl J J G 2014 Application of 3D electrical resistivity imaging for mapping frozen ground conditions exemplified by three case studies Geomorphology
210 71–82
Magnin F, Krautblatter M, Deline P, Ravanel L, Malet E and Bevington A 2015 Determination of warm, sensitive permafrost areas in near-vertical rockwalls and evaluation of distributed models by electrical resistivity tomography J. Geophys. Res. Earth Surf.120 745–62
Marmy A, Rajczak J, Delaloye R, Hilbich C, Hoelzle M, Kotlarski S, Lambiel C, Noetzli J, Phillips M and Salzmann N 2016 Semi-automated calibration method for modelling of mountain permafrost evolution in Switzerland Cryosphere
10 2693–719
Marty C, Tilg A-M and Jonas T 2017 Recent evidence of large-scale receding snow water equivalents in the European Alps J. Hydrometeorol.18 1021–31
Mollaret C, Hilbich C, Pellet C, Flores-Orozco A, Delaloye R and Hauck C 2019 Mountain permafrost degradation documented through a network of permanent electrical resistivity tomography sites Cryosphere
13 2557–78
Mollaret C, Wagner F M, Hilbich C, Scapozza C and Hauck C 2020 Petrophysical joint inversion applied to alpine permafrost field sites to image subsurface ice, water, air and rock contents Front. Earth Sci.8 85
Obu J, Westermann S, Bartsch A, Berdnikov N, Christiansen H H, Dashtseren A, Delaloye R, Elberling B, Etzelmüller B and Kholodov A 2019 Northern Hemisphere permafrost map based on TTOP modelling for 2000–2016 at 1 km2scale
Earth-Sci. Rev.193 299–316
Ødegård R S, Nesje A, Isaksen K, Andreassen L M, Eiken T, Schwikowski M and Uglietti C 2017 Climate change threatens archaeologically significant ice patches: insights into their age, internal structure, mass balance and climate sensitivity Cryosphere11 17-32
Oliva M, G´omez-Ortiz A, Salvador-Franch F, Salv`a-Catarineu M, Palacios D, Tanarro L, Ramos M, Pereira P and
Ruiz-Fern´andez J 2016 Inexistence of permafrost at the top of the Veleta peak (Sierra Nevada, Spain) Sci. Total Environ.
Pellet C, Hilbich C, Marmy A and Hauck C 2016 Soil moisture data for the validation of permafrost models using direct and indirect measurement approaches at three alpine sites Front. Earth Sci.3 91
PERMOS 2019 Permafrost in Switzerland 2014/2015 to 2017/2018 Glaciological Report Permafrost No. 16–19 Cryospheric Commission of the Swiss Academy of Sciences ( https://doi.org/10.13093/permos-rep-2019-16-19)
Pruessner L, Phillips M, Farinotti D, Hoelzle M and Lehning M 2018 Near-surface ventilation as a key for modeling the thermal regime of coarse blocky rock glaciers Permaf. Periglac. Process.29 152–63
Rizzi J, Nilsen I B, Stagge J H, Gisnås K and Tallaksen L M 2018 Five decades of warming: impacts on snow cover in Norway Hydrol. Res.49 670–88
Romanovsky V E, Smith S L and Christiansen H H 2010 Permafrost thermal state in the Polar Northern Hemisphere during the International Polar Year 2007–2009: a synthesis Permaf. Periglac. Process.21 106–16
Scherler M, Schneider S, Hoelzle M and Hauck C J E S D 2014 A two-sided approach to estimate heat transfer processes within the active layer of the Murt`el–Corvatsch rock glacier Earth Surf. Dynam.2 141–54
Schuur E A, Mcguire A D, Sch¨adel C, Grosse G, Harden J, Hayes D J, Hugelius G, Koven C D, Kuhry P and Lawrence D M 2015 Climate change and the permafrost carbon feedback Nature520 171
Serquet G, Marty C, Dulex J P and Rebetez M 2011 Seasonal trends and temperature dependence of the snowfall/ precipitation-day ratio in Switzerland Geophys. Res. Lett.38
L07703
Supper R, Ottowitz D, Jochum B, Römer A, Pfeiler S, Kauer S, Keuschnig M and Ita A J N S G 2014 Geoelectrical monitoring of frozen ground and permafrost in alpine areas: field studies and considerations towards an improved measuring technology Near Surf. Geophys.12 93–115
van Everdingen R O (ed) 1998 Multi-language Glossary of Permafrost and Related Ground-ice Terms (Calgary: International Permafrost Association, The University of Calgary)
Vikhamar-Schuler D, Isaksen K, Haugen J E, Tømmervik H, Luks B, Schuler T V and Bjerke J W 2016 Changes in winter warming events in the Nordic Arctic region J. Clim.
29 6223–44
Vonder Mühll D, Hauck C, Gubler H, Mcdonald R and Russill N 2001 New geophysical methods of investigating the nature and distribution of mountain permafrost with special reference to radiometric techniques Permaf. Periglac. Process.
11 27–38
Westermann S, Boike J, Langer M, Schuler T V and Etzelmüller B 2011 Modeling the impact of wintertime rain events on the thermal regime of permafrost Cryosphere5 945–59
Wicky J and Hauck C 2017 Numerical modelling of convective heat transport by air flow in permafrost talus slopes Cryosphere11 1311–25