HAL Id: hal-02280920
https://hal.archives-ouvertes.fr/hal-02280920
Submitted on 3 Apr 2020
HAL is a multi-disciplinary open access
archive for the deposit and dissemination of
sci-entific research documents, whether they are
pub-lished or not. The documents may come from
teaching and research institutions in France or
abroad, or from public or private research centers.
L’archive ouverte pluridisciplinaire HAL, est
destinée au dépôt et à la diffusion de documents
scientifiques de niveau recherche, publiés ou non,
émanant des établissements d’enseignement et de
recherche français ou étrangers, des laboratoires
publics ou privés.
Integrating expressive rendering techniques in a GIS
cartographic pipeline.
Bertrand Dumenieu, Sidonie Christophe
To cite this version:
Bertrand Dumenieu, Sidonie Christophe. Integrating expressive rendering techniques in a GIS
carto-graphic pipeline.. AGILE 2016 - Code Loves Maps:cartocarto-graphically oriented programming workshop,
Jun 2016, Helsinki, Finland. �hal-02280920�
See discussions, stats, and author profiles for this publication at: https://www.researchgate.net/publication/309489415
Integrating expressive rendering techniques in a GIS cartographic pipeline.
Conference Paper · June 2016CITATIONS
0
READS
130
2 authors:
Some of the authors of this publication are also working on these related projects: MapMuxing View project
GeoHistoricalData View project Bertrand Duménieu
École des Hautes Études en Sciences Sociales 6PUBLICATIONS 20CITATIONS
SEE PROFILE
Sidonie Christophe
Institut national de l’information géographique et forestière 78PUBLICATIONS 433CITATIONS
SEE PROFILE
All content following this page was uploaded by Sidonie Christophe on 28 October 2016.
1 Introduction
What if a mapmaker wants to create a map that ''looks like'' an artistic painting while still being a legible and efficient map? Although sounding far-fetched, this questions the capability of current GIS cartographic tools to produce maps that meet the user's requirements regarding aesthetics, efficiency and diversity in results [5]. Imitating traditional media such as painting can also bring new opportunities to map producers by automating complex cartographic renderings that are still unavailable in current GIS (e.g. drawing mountains and glaciers). In computer graphics, expressive rendering aims at imitating traditional artistic techniques such as painting and sketching to improve the ability of an image to convey information. The relevancy of expressive rendering techniques in cartography has been identified for a couple years for improving the efficiency and aesthetics [3, 8] and for automating complex cartographic renderings (e.g. [2] about patterns for land cover uses and [4, 6] for mountain drawing).
This presentation paper resumes recent results presented in [2] and aims at discussing on a future services-oriented architecture. The contribution was the extension of a GIS cartographic tool to enable cartographers to use and control expressive rendering techniques in map design. We first introduce the software architecture created to integrate these rendering techniques. Section 3 is dedicated to the extension of the standard stylization formalism Symbology Encoding (SE) [7] to describe and control the application of these techniques on cartographic data. We finally provide a sample result and give some insights on future works in section 4.
2 Integrating expressive rendering techniques
2.1 Cartographic needs
Our approach aims at offering users the possibility to create, use and control new rendering components which, combined together and applied to cartographic data, create maps with expressive styles. We focus on three map styles:
watercolor, hand-drawn historical and inspired by paintings. Each of these styles requires different rendering components. Watercolor can be obtained by blending together paper textures, noise textures and rendered layers of cartographic data [1] whereas reproducing hand-drawing techniques or paintings requires to apply brush/pen strokes to linear features and to fill surface features with complex patterns (e.g. filling a region with brush strokes or rendering a hand-drawn forest).
2.2 Extended cartographic pipeline
The figure 1 shows how these rendering components have been integrated in the usual cartographic pipeline of a GIS based on cartographic data production, style description and finally map rendering. We implemented these components as GLSL shaders to render tessellated (done on the CPU) geometries of the cartographic data [2]. While being powerful and efficient, this choice has three downsides. First, the shaders should be invisible to the mapmakers: they don’t need to know how things are rendered but only what type of expressive component they can describe and apply. Shaders are also low-level components and thus are strongly related to the implementation of the GIS rendering engine: describing shaders in the style description stage would make this description only valid for this engine and thus less interoperable. Finally, there is no standard way to define metadata on the shaders parameters that can be controlled by users.
2.3 Expressive method descriptors
In order to separate the style description level and the expressive rendering component level and to provide an interface between them, we added an intermediary metadata level which is composed of Expressive Method Descriptors. These descriptors are XML files composed of:
a mandatory reference name to be used in the style description level (e.g. ''Van Gogh's brush stroke''),
an optional reference to another descriptor to inherit from (e.g. ''Van Gogh's brush stroke'' are ''Oil brush strokes''),
Integrating expressive rendering techniques in a GIS cartographic
pipeline
Bertrand Duménieu Sidonie Christophe
Institut National de l'Information Géographique et Forestière Laboratoire Cogit, Université Paris-Est
73 avenue de Paris, 94165 Saint-Mandé cedex, France
[email protected] [email protected]
Abstract
This presentation paper resumes recent results on an extension of the cartographic pipeline in GIS to integrate expressive rendering techniques, in order to increase the aesthetics and expressivity of maps [2]. They are implemented in the form of shaders which can be called and parameterized from a style file following the OGC style specifications. We propose an extension of the OGC Symbology Encoding specification.
AGILE 2016 – Helsinki, June 14-17, 2016
a non-empty list of expressive rendering components ( i.e. shaders),
a non-empty set of input parameters with domain restrictions and links to their name in the shaders. Parameters can be defined as optional.
Figure 2 shows an example of an expressive method descriptor which applies an ink-stroke effect on linear features. This proposition has been implemented in the open source GIS Geoxygene1. We opted for a lazy behaviour: a given descriptor is parsed only when needed, i.e. when a mapmaker creates an explicit reference to its name (see section 3).
1
Describing and controlling expressive styles
Expressive methods descriptors can be called and controlled by a mapmaker through an extension of the OGC specification Symbology Encoding (SE). SE provides stylization blocks named Symbolizers specific to each OGC
FeatureType. These symbolizers are separated into basic
controllable elements. The element related to the stylization of linear geometries (resp. surface geometries) is the Stroke element (resp. Fill). In our case, the style of a map can be fully described in a style file which relies on the SE specification and structures the cartographic data into layers following the OGC Styled Layer Descriptor specification (SLD).
To reference expressive methods descriptors in a style file, we added an ExpressiveStroke (resp. ExpressiveFill) to the Stroke (resp. Fill) element. These two new elements can reference an expressive rendering component to apply to a given input cartographic data. Each expressive element must contain the reference name of the expressive method descriptor and the set of parameters defined by this descriptor. The style file can be edited on the fly in the GIS, which automatically maps the declared file with the descriptors to guide the user.
We also extended the SE elements Symbolizer to control the blending between rendered symbolized cartographic data. This BlendingMode is defined for each Symbolizer. Four blendings can be defined: normal (default), multiply, high-toned and overlay, this last allowing watercolor-like renderings.
2
Conclusion
In this article, we presented an extension of the usual cartographic pipeline and OGC style specifications to integrate expressive rendering techniques along with the implementation of this extension. Although being a research prototype, our GIS was used by expert users from the French National Mapping Agency who highlighted the increased variability of the maps that can be designed.
1 http://ignf.github.io/geoxygene/ last access 2016/05/20
Figure 3 shows a map created from vector data layers coming from the GeohistoricalData database [9]. Multiple expressive components and layer blends have been used to produce this map. As an example, the sea polygon is stylized with a combination of a texture generated from simple tiles of waves, a color gradient and an overlaid paper texture. The proposed intermediary metadata level is a first step towards a catalog of expressive rendering techniques available for mapmakers. We plan to implement it in a service-oriented architecture.
Aknowledgments
This work was supported by a grant overseen by the French National Research Agency (ANR) as part of the Mapstyle2 project [ANR-12-CORD-0025].
References
[1] Bousseau A., Kaplan M., Thollot J., Sillion F (2006).
Interactive watercolor rendering with temporal coherence and abstraction. In International Symposium
on Non-Photorealistic Animation and Rendering (NPAR), ACM.
[2] Christophe S., Dumenieu B., Turbet J., Hoarau C., Mellado N., Ory J., Loi H., Masse A., Arbelot B., Vergne R., Brédif M., Hurtut T., Thollot J., Vanderhaeghe D. (2016). Map Style Formalization: Rendering Techniques Extension for Cartography. Pierre Bénard; Holger Winnemöller. Expressive 2016 The Joint Symposium on
Computational Aesthetics and Sketch-Based Interfaces and Modeling and Non-Photorealistic Animation and Rendering, May 2016, Lisbonne, Portugal. The
Eurographics Association, Non-Photorealistic Animation
and Rendering, 2016.
http://expressive.richardt.name/2016/,
10.2312/exp.20161064, hal-01317403
[3] Christophe S., Hoarau C. (2013) Expressive Map Design Based on Pop Art: Revisit of Semiology of Graphics?, Cartographic Perspectives, Volume 73, 2013. doi: 10.14714/CP73.646
[4] Jenny, B., Hutzler, E., & Hurni, L. (2010). Scree representation on topographic maps. The Cartographic
Journal, 47(2), 141-149.
doi: 10.1179/000870409X12525737905006
[5] Kent, A. J., Field, K., Jenny, B., & Hopfstock, A. (2012). Cartographic Design and Aesthetics “FAQ”.
Cartographic Perspectives, (73), 13-16.
doi: 10.14714/CP73.594
[6] Loi H., Hurtut T., Vergne R., Thollot J (2013). Discrete
Texture Design Using a Programmable Approach. In
AGILE 2016 – Helsinki, June 14-17, 2016
Proceeding SIGGRAPH ’13 ACM SIGGRAPH 2013 Talks, ACM, article No. 43.
doi: 10.1145/2504459.2504513
[7] Müller M. Symbology Encoding Implementation Specification, version 1.1.0, OpenGIS Implementation Specification, 05-077r4, OpenGIS Consortium (July 2006).
[8] Semmo, A., Kyprianidis, J. E., Trapp, M., & Döllner, J. (2013). Real-time rendering of water surfaces with
cartography-oriented design. In Proceedings of the
Symposium on Computational Aesthetics, ACM, pp. 5-14.
doi: 10.1145/2487276.2487277
[9] Perret, J., Gribaudi, M. & Barthelemy, M. (2015). Roads
and cities of 18th century France. Scientific data, vol. 2.
doi: 10.1038/sdata.2015.48
Figure 1: The proposed extension of a GIS cartographic pipeline, each red-filled box being an extended element. Dashed boxes represent components specific to our implementation. We distinguish two types of users: the mapmaker
(blue ''M'' bullet) who wants to access and parameterise expressive rendering components during the style description stage and the expert user or developer (orange ''E'' bullet) who creates new rendering components.
Figure 2: The Expressive Method Descriptor which draws linear features as ink strokes, as shown on the road and hydrographic networks in figure 3. This descriptor inherits from the descriptor BrushStroke.
<RenderingMethod>
<Name>linepainting_inkbrush</Name>
<GeneralMethodReference>BrushStroke</GeneralMethodReference> <ShaderList>
<ShaderRef gltype="GL_FRAGMENT_SHADER">../shaders/subshader1d.hydro.frag</ShaderRef> </ShaderList>
<Parameters>
<Parameter userdefined="true" required="false"> <Name>extremitiesLength</Name>
<Type>float</Type>
<Description>The length of the portion on the curve where the brush pressure increases.</Description>
</Parameter>
<Parameter userdefined="true" required="true"> <Name>hardness</Name>
<Type>float</Type>
<Description>The hardness of the brush</Description> </Restrictions>
<BoundRestriction min="0.0" max="1.0"/> </Restrictions>
</Parameter>
<Parameter userdefined="true" required="true"> <Name>thickness</Name>
<Type>float</Type>
<Description>The thickness of the brush</Description> </Restrictions>
<BoundRestriction min="0.0" max="1.0"/> </Restrictions>
</Parameter>
<Parameter userdefined="true" required="true"> <Name>noiseWavelength</Name>
<Type>float</Type>
<Description>The variations of the brush thickness</Description> </Restrictions>
<BoundRestriction min="0.0" max="10000.0"/> </Restrictions>
</Parameter> </Parameters> </RenderingMethod>
AGILE 2016 – Helsinki, June 14-17, 2016
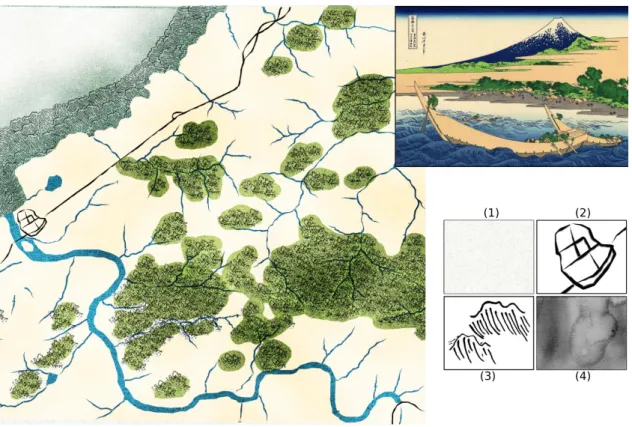
Figure 3: A map created from vector cartographic data with expressive rendering components to imitate the style of Japanese prints. This result is obtained with a combination of layer blending and application of expressive methods for the sea, the linear roads and rivers, and the forest. The bottom-right table shows some of the textures and brushes used to produce this map: (1) the paper texture, (2) the ink brush, (3) textures patches of wind waves and (4) the texture used to create the color dilution effect on the forest. (Figure from [2]).
Source (top right) : Katsushika Hokusai. Sea coast at Tago, near Ejiri. Part of the series Thirty-six Views of Mount Fuji, no. 36. c. 1830. woodblock color print, 25.2 x36 cm.
View publication stats View publication stats