HAL Id: hal-01609059
https://hal.archives-ouvertes.fr/hal-01609059
Submitted on 3 Oct 2017HAL is a multi-disciplinary open access archive for the deposit and dissemination of sci-entific research documents, whether they are pub-lished or not. The documents may come from teaching and research institutions in France or abroad, or from public or private research centers.
L’archive ouverte pluridisciplinaire HAL, est destinée au dépôt et à la diffusion de documents scientifiques de niveau recherche, publiés ou non, émanant des établissements d’enseignement et de recherche français ou étrangers, des laboratoires publics ou privés.
Application of Z-scan technique for the study of
nonlinear absorption in chemically reduced LiNbO 3
crystals
Sergey Kostritskii, Michel Aillerie, Edvard Kokanyan, Og Sevostyanov
To cite this version:
Sergey Kostritskii, Michel Aillerie, Edvard Kokanyan, Og Sevostyanov. Application of Z-scan tech-nique for the study of nonlinear absorption in chemically reduced LiNbO 3 crystals. NAMES’16 - New Achievements in Materials and Environmental Sciences, Nov 2016, Nancy, France. pp.12003 - 12003, �10.1088/1742-6596/879/1/012003�. �hal-01609059�
This content has been downloaded from IOPscience. Please scroll down to see the full text.
Download details:
IP Address: 82.236.242.36
This content was downloaded on 02/09/2017 at 17:12 Please note that terms and conditions apply.
Application of Z-scan technique for the study of nonlinear absorption in chemically reduced
LiNbO3 crystals
View the table of contents for this issue, or go to the journal homepage for more 2017 J. Phys.: Conf. Ser. 879 012003
(http://iopscience.iop.org/1742-6596/879/1/012003)
Home Search Collections Journals About Contact us My IOPscience
You may also be interested in:
Bulk wave excitation from the surface of a LiNbO3 crystal by a system of planar electrodes A V Muromets, V B Voloshinov and I A Kanonin
Investigation of the nonlinear absorption of [M(Et2timdt)2] (M = Pd, Pt) in the pico-andnanosecond timescales using the Z-scan technique
T Cassano, R Tommasi, M Arca et al.
Green synthesis and third-order nonlinear optical properties of 6-(9H-carbazol-9-yl) hexyl acetate Baili Chen, Feng Geng, Xuan Luo et al.
1
Content from this work may be used under the terms of theCreative Commons Attribution 3.0 licence. Any further distribution of this work must maintain attribution to the author(s) and the title of the work, journal citation and DOI.
Published under licence by IOP Publishing Ltd
1234567890
NAMES'16 IOP Publishing
IOP Conf. Series: Journal of Physics: Conf. Series 879 (2017) 012003 doi :10.1088/1742-6596/879/1/012003
Application of Z-scan technique for the study of nonlinear
absorption in chemically reduced LiNbO
3crystals
SM Kostritskii1, M Aillerie2,3, E Kokonyan4,5, and OG Sevostyanov6
1RPC Optolink, Sosnovaya al. 6, bd. 5, Zelenograd, 124489, Moscow, Russia
2Université de Lorraine, LMOPS, EA 4423, 57070 Metz, France 3Centrale Supélec, LMOPS, 57070 Metz, France
4Armenian State Pedagogical University, Yerevan, Tigran Mets Ave., 17, Armenia 5Institute for Physical Researches, National Academy of Sciences of Armenia,
Ashtarak-2, Armenia
6Phys. Dept., Kemerovo State University, Krasnaya str. 6, 650043, Kemerovo, Russia
E-mail: skostritskii@optolinkl.ru
Abstract. The nonlinear absorption (NLA) was studied by open-aperture Z-scan experiments in the
chemically reduced nominally pure LiNbO3 crystals at cw-illumination with the red (644 nm) and
green (514.5 nm) laser beams. The magnitude of the measured NLA is considerably different from the reported Z-scan results obtained in as-grown LiNbO3. The positive sign of NLA obtained with the red
light has been related to the generation of the small bound polarons absorbing in red and near-IR ranges. Application of green light results in the light-induced transparency, i.e. the Z-scan traces show negative sign of NLA. Intensity dependence of Z-scan traces allows for conclusion that the photo-induced dissociation of small NbLi4+:NbNb4+ bipolaronsand sequent generation of small polarons gives
the dominating contribution to the nonlinear optical absorption in reduced crystals with a large bipolarons concentration.
1. Introduction
Recently, a new interest to LiNbO3 crystals was stimulated by the study of small polarons and
bipolarons [1,2]. Besides of fundamental aspects, polarons are very perspective entities for practical purposes: e.g., the polarons can be used in the holography as intrinsic photorefractive centers in undoped and doped LiNbO3 crystals, including chemically reduced nominally pure ones [2-4]. There
are many hints that short-living small polarons strongly influence the photorefractive sensitivity. Furthermore, it has been shown that small bound polarons may act as intermediate shallow traps in a multi-step recording scheme for phase holograms featuring non-destructive read-out [3,5].To optimize the crystal properties for photorefractive holography, it is necessary to study the efficiency of single polarons excitation. We propose to use the open-aperture Z-scan method, as it has been established [6,7], that the photorefractive sensitivity is proportional to the light-induced absorption. Indeed, both effects present the same microscopic origin, i.e. the photo-generation of small single NbLi3• polarons as
result of light-induced dissociation of small NbLi4+:NbNb4+ bipolarons. Note, that the Z-scan technique
is a well-established method for quantitative measurement of the nonlinear absorption (NLA) and nonlinear refraction (NLR) [7,8].
1
2
1234567890
NAMES'16 IOP Publishing
IOP Conf. Series: Journal of Physics: Conf. Series 879 (2017) 012003 doi :10.1088/1742-6596/879/1/012003
2. Experimental techniques
A lithium niobate (LiNbO3) crystal grown from a melt of 48.5 mol % Li2O has been used for preparation of the reduced samples studied, which are listed in Table 1. These six samples were annealed in pure hydrogen atmosphere (partial pressure of 0.1 atm) at different temperatures ranged from 500 to 700 0C for various times in range from 0.5 to 11 hours. One additional sample of the as-grown (unreduced) crystal was used as a reference specimen for the comparative study of the chemical reduction effect on NLA. All the samples were cut 2-mm-thick plates with the front and back Z-surfaces polished at an optical-grade.
The typical optical absorption spectrum is shown in figure 1. As can be seen from our data, the strength of the bipolaron absorption band depends on the reduction temperature in a strongly nonlinear way. This fact makes it difficult to control the reduction process and may lead to arbitrarily different results for slightly altered experimental conditions [2,4]. Since the dependence of bipolaron concentration on the reduction conditions in nominally pure LiNbO3 is not generally known, the most convenient characterization is given by the properties of the bipolaron band itself. According to the reference [2], we will refer to the linear absorption coefficient α0 at λ = 500 nm, i.e., at a maximum of the bipolaron absorption band, as the degree of reduction.
Figure 1. Spectral dependence of the linear absorption coefficient α0 for the moderately reduced nominally pure LiNbO3 crystal (sample #2). Sample notation is given in accordance with Table 1.
Experimental information on NLA was obtained from open aperture Z-scan measurements [7]. The samples were scanned in the vicinity of the lens focus (z = 0) starting from a position ahead of focus (-z) and moving toward a position behind the focus (+z). The scanning range was about ±25 mm in all the experiments. The data were collected at every 0.2 mm on the lens axis, by translating the sample under test through the focal point using a computer controlled stepper motor. An argon-ion laser operating at 514.5 nm was focused with a 200 mm focal length lens into the z-cut LiNbO3 sample. This adjustable argon-ion laser generates a Gaussian light beam with an output power, corresponding to a light intensity I0 at the focal point of the setup (i.e. at z = 0) in the 0.05 to 3.5
3
1234567890
NAMES'16 IOP Publishing
IOP Conf. Series: Journal of Physics: Conf. Series 879 (2017) 012003 doi :10.1088/1742-6596/879/1/012003
kW/cm2 range. Besides, we use a diode laser at λ = 644 nm in a second series of NLA measurements with the same open-aperture Z-scan set-up. Calibrated neutral density filters were used to vary I0 from
0.04 to 1.2 kW/cm2. The thickness of a sample (2 mm) was chosen in such a way that it was smaller than the Rayleigh range zR of the focusing lens. The Rayleigh range was evaluated by zR = πω02/λ; as the beam waist ω0 = 4fλ/πd at the focal point (z = 0), where f is the focal length of the lens and d is the beam diameter at the aperture, i.e. zR = 5.9 and 4.8 mm at λ = 644 and 514.5 nm, respectively.
Note, that the Z-scan response with a fully open aperture is insensitive to the nonlinear refraction and is only a function of the nonlinear absorption [6-9]. Such Z-scan traces with no aperture are expected to be symmetric with respect to the focus (z = 0) and the coefficient of nonlinear absorption can be easily calculated from a transmittance curve, when the low-intensity Z-scan background is subtracted to reduce the effects of linear sample inhomogeneity [7].
3. Experimental results
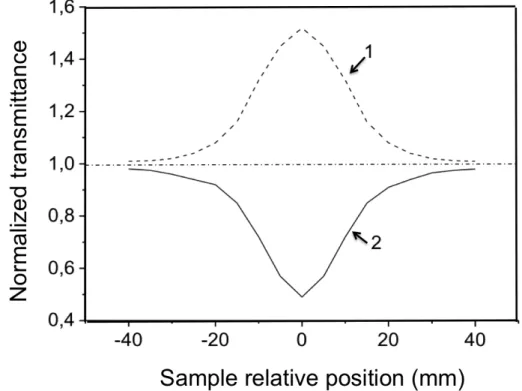
In figure 2 the normalized transmission is shown for an open aperture Z-scan as a function of the distance along the lens axis for 514.5-nm and 644-nm laser beams in the deeply reduced crystal having high values for the linear absorption coefficient α0 at the both wavelengths. The transmission without
an aperture was measured in the far field as the sample was moved through the focal point.
Figure 2. Open-aperture Z-scan traces measured in the sample #6 (Table 1) with 514.5-nm (curve 1) and 644-nm (curve 2) laser beams, respectively. The light intensities of 1.2 and 1.9 kW/cm2 were used at 644 nm and 514.5 nm, respectively. Both transmittances T(z) are normalized to the corresponding transmittances TL in the regions of ⎢z⎢> 40 mm. Thus, the normalized transmittance is NT = (T(z)/TL)×100%.
The curve (2) of figure 2 depicts the open aperture response, which accounts for a decrease in the transmittance T due to nonlinear absorption of the 644-nm laser beam. Such a shape of the optical response is typical for open-aperture Z-scan measurements in the as-grown nominally pure and doped LiNbO3 crystals [7-10]. In this case called Reverse Saturable Absorption (RSA) [11], the sample
4
1234567890
NAMES'16 IOP Publishing
IOP Conf. Series: Journal of Physics: Conf. Series 879 (2017) 012003 doi :10.1088/1742-6596/879/1/012003
experiences the strongest I at focus (I = I0 at z = 0); therefore it absorbs the most energy and allows least transmittance. Away from the focus in the directions of both increasing and decreasing z, transmittance increases evenly because the irradiance decreases symmetrically about the focus. However, the magnitude of this decrease of T has much larger values in the reduced crystals in comparison with an as-grown nominally pure Z-cut sample of same thickness, when the light intensity
I0 is fixed to any constant level within the range available with the 644-nm laser used. The open-aperture response, curve (1) in figure 2, obtained for the deeply reduced crystals (α0 > 20 cm-1, i.e. in the samples #4-6, Table 1) with the 514.5-nm laser beam demonstrates the increase of T with I, i.e.
T(z) has a maximum value at z = 0, that is typical for Saturable Absorption (SA) [11], when the
nonlinear absorption has negative sign. It can be related to the bleaching of the defect centers absorbing at this laser wavelength in the deeply reduced crystals. In contrast to the reduced LiNbO3, no alteration of nonlinear absorption sign has been observed in as-grown LiNbO3 crystals at the change of light wavelength from 644 to 514.5 nm.
NLA can be determined directly from a T(z) curve measured by the open aperture Z-scan. For a small nonlinear absorption the normalized change in transmittance (ΔT = T(z) - 1) becomes [6,11]:
ΔT(z) = - q0/2√2, (1) where
q0 = ΔαLeff /(1 + z2/z2R) (2) here, Leff = [1 – exp(-α0L)]/α0 is the effective length, α0 is the linear absorption coefficient, L is the
thickness of the sample, Δα is the light-induced change in absorption (i.e., the total absorption coefficient is α = α0 +Δα), z is the actual sample position relative to the focus and zR = (πw02/λ) is the confocal parameter given for the beam waist radius w0 at the focus and the laser wavelength λ. The
change in optical absorption coefficient Δα refers to the ordinary polarization, since the optical axis of the crystal under test was always set parallel to the propagation direction of the laser beam.
The open aperture Z-scan data was used to evaluate the nonlinear absorption coefficient β (according to the common definition of two-photon absorption caused by third-order optical nonlinearity [6-9]: β =Δα/I0) in the as-grown LiNbO3 crystals at excitation with the both laser wavelengths used in our experimental study. The experimental data on T(z) yields the following values: β = 0.45 cm/kW at 514.5 nm and β = 0.08 cm/kW at 644 nm. Note, that such a spectral dependence is general feature of NLA [6]. These β values are much smaller than the previously reported values (β = 2.7 cm/kW was evaluated [10] at λ = 532 nm and β = 5 cm/kW was evaluated [9] at λ = 514.5 nm) obtained with cw-laser beams for the undoped as-grown lithium niobate crystals. This difference can be attributed to the significant influence of the photorefractive effect on NLA measurements, as the photorefractive effect depends strongly on many uncontrollable crystal parameters and specific excitation conditions [7,12].
Table 1. Samples notation, linear optical absorption coefficient α0 values at λ = 514.5
nm, maximum light-induced absorption coefficient change Δα observed at saturation of NLA and modified nonlinear absorption coefficient β’ for the reduced LiNbO3 samples. β’ was evaluated from the Z-scan data on Δα values measured with 514.5-nm laser beam
at I0 = 59.5 W/cm2, as Δα = β’√I0. The signs of Δα and β’ were defined in accordance
with the expression for the total absorption coefficient α = α0 +Δα .
Sample #: 1 2 3 4 5 6
α0, cm-1 4.6 10.6 19.1 25.3 27.6 37.4
Δα, cm-1 -2.25 -6.8 -12.5 -16.8 -18.3 -24.3
5
1234567890
NAMES'16 IOP Publishing
IOP Conf. Series: Journal of Physics: Conf. Series 879 (2017) 012003 doi :10.1088/1742-6596/879/1/012003
In the reduced crystals the light-induced absorption changes Δα have been found to be proportional to the square root of I0 within the quite low-intensity range, Tables 1 and 2. These Δα(I0) dependences for the both 644-nm- and 514.5-nm-excitations demonstrate the tendency to saturation even at the moderate intensities. However, there is a spectral dependence of the both modified NLA coefficient β’ (obtained by fitting of experimental dependences by Δα(I0) = β’√I0 [13]) and a maximum value of NLA, i.e. a value of Δα observed at maximum I0.
4. Discussion
To explain the anomalous dependence of Δα on I0 we took into account that the dominating mechanism of nonlinear absorption in reduced crystals at low and moderate intensities I0 is the photo-dissociation of bipolarons B into single polarons P, which can be described by a second-order reaction
B ↔ P + P as proposed in reference [13]. Note, that this finding is in contrast to the other mechanisms of NLA in LiNbO3 reported in references [6-11], as all these mechanisms can be described by a first-order reaction. The latter term is used in accordance with the definition given previously [13].
Figure 3. Schematic description for the mechanism of excitation (generation) and recombination (depopulation) of small polarons in reduced LiNbO3. Thick arrows denote excitations by pump light, dashed arrows denote relaxations. Bent thick arrows stand for the transformation (annihilation) of single polaronic states without electronic transitions. Note that all the energy levels of polarons and bipolarons are within forbidden band and it are shown schematically; they do not represent defect energies.
At room temperature almost all of these polarons are paired forming the bipolarons in equilibrium. Bipolarons can be broken into single polarons again by illumination within visible range (see figure 3). At room temperature single polarons are short-living (≤ ms) because of their small activation energy (0.3 eV) for annihilation [1,2]. Such a photo-dissociation of bipolarons changes the optical absorption spectrum of the crystals. The broad absorption band near 500 nm has been attributed to the presence of bipolarons and a narrower band at 760 nm (a short-wavelength tail is extended down to 600 nm) has
Conduction band 644 nm Bipolaron NbNb4+ free polaron NbLi4+ bound polaron 514.5 nm or 644 nm
6
1234567890
NAMES'16 IOP Publishing
IOP Conf. Series: Journal of Physics: Conf. Series 879 (2017) 012003 doi :10.1088/1742-6596/879/1/012003
been assigned to the formation of single polarons under illumination with proper wavelength [2,13,14]. Therefore, the existence of such a dissociation-annihilation process in continuous wave (cw) illuminated crystals is expected to manifest itself in the optical absorption change dependent on the wavelength of pump laser beam [2,13].
Table 2. Samples notation, linear optical absorption coefficient α0 values at λ = 644 nm,
maximum light-induced absorption coefficient change Δα observed at I0 = 1200 W/cm2,
and modified nonlinear absorption coefficient β’ for the reduced LiNbO3 samples. β’ was
evaluated from Δα values measured with 644-nm laser beam at I0 = 38 W/cm2.
Sample #: 1 2 3 4 5 6
α0, cm-1 2.6 5.9 10.7 14.1 15.4 20.8
Δα, cm-1 0.43 1.15 2.01 2.56 2.85 3.63
β’, W-0.5 0.013 0.031 0.056 0.077 0.084 0.112
Thus, the photon-induced dissociation of small NbLi4+:NbNb4+ bipolarons, absorbing in the green spectral range, results in a light-induced transparency, i.e., SA effect, when Δα has negative sign (equation (3)), at excitation with 514.5-nm laser beam. The generation of the small bound NbLi4+ polarons, absorbing significantly in the red and near IR ranges, yields a positive light-induced absorption Δα related to the RSA at excitation with the 644-nm laser beam. According to the data on spectral shape of the bipolaron absorption band [2,4], the red light is still sufficient for one-photon dissociation of bipolarons due to a high light intensity within focused laser beam despite of a small linear absorption α0 at this wavelength.
Combined solution of equations, describing the dissociation-annihilation process and the optical absorption, the following dependence of the light-induced absorption changes ⎢Δα ⎢on I0 can be expressed by [13]:
⎢Δα ⎢= N×s(gI0/r)1/2 = β’ √I0 (3) with s = sP – 0.5sB, where sP denotes the absorption cross section of polarons and sB that of bipolaron,
g and r are generation and recombination rates, respectively, of small bound polarons in the
photo-induced dissociation process of bipolarons.
Using the maximum transmission change ΔT measured at z = 0 in differently reduced crystals as input data for equations (1,2,3), the modified nonlinear absorption coefficient β‘ values were evaluated and presented in Tables 1 and 2. These β’values evaluated with the aid of the Z-scan technique have the same order of magnitude that its value reported previously (β’ = 0.27 W-0.5) [13]. At the same time, there is an alteration of the β’ sign and a significant increase of ⎢β’ ⎢magnitude, when the pump wavelength changes from 644 to 514.5 nm for any deeply reduced crystal studied, as shown by the values reported in Table 2. Such a drastic spectral dependence of β’ is in accordance with the data on the light-induced changes of the polaron/bipolaron absorption in the reduced lithium niobate crystals.
5. Summary
Chemically reduced nominally pure LiNbO3 crystals were prepared and characterized for nonlinear absorption (NLA) using the open-aperture Z-scan technique at the wavelength of 514.5 and 644 nm. Z-scan spectra reveal the sign alteration of NLA across this wavelength range with a positive sign of NLA at 644 nm accompanied by a negative one for NLA at 514.5 nm.These anomalous nonlinearities in reduced LiNbO3 induced by low- and moderate-intensity illumination are established to be mainly due to a two-photon absorption process associated with the photodissociation of bipolarons, which are generated in large quantity by the chemical reduction annealing. It has been found that the NLA of the deeply reduced crystals is much larger than that of the as-grown (unreduced) lithium niobate.
7
1234567890
NAMES'16 IOP Publishing
IOP Conf. Series: Journal of Physics: Conf. Series 879 (2017) 012003 doi :10.1088/1742-6596/879/1/012003
6. References
[1] Schirmer O F, Imlau M, Merschjann C and Schoke B 2009 J. Phys.: Condens. Matter 21 123201 [2] Merschjann C, Schoke B and Imlau M 2007 Phys. Rev. B 76 085114
[3] Guenther H, Macfarlane R, Furukawa Y, Kitamura K and Neurgaonkar R 1998 Appl. Opt. 37 7611 [4] Kostritskii S M, Aillerie M, Margueron S, Bourson P 2013 J. Phys.: Conf. Ser. 416 012033 [5] Hesselink L, Orlov S, Liu A, Akella A, Lande D, and Neurgaonkar R 1998 Science 282 1089 [6] Christodoulides D N, Khoo I C, Salamo G J, Stegeman G I, and Van Stryland E W 2010 Advances
in Optics and Photonics 2 60
[7] Kostritskii S M, Aillerie M, Kokanyan E 2013 Proc. SPIE 9065 906508
[8] Pálfalvi L, Hebling J, Almási G, Péter Á, Polgár K, Lengyel K and Szipocs R 2004 J. Appl. Phys. 95 902
[9] Henari F Z, Cazzini K, Akkari F E, and Blau W J 1995 Appl. Phys. Lett. 78 1373 [10] Chen Y, Liu S W, Wang D, Chen T, and Xiao M 2007 Appl. Opt. 46 7693 [11] Wei T H, Huang T H, Lin H D, and Lin S H 1995 Appl. Phys. Lett. 67 2266 [12] Kostritskii S M, Sevostyanov O G 1997 Appl. Phys. B 65 527
[13] Jermann F, Simon M, Bower R, Krätzig E, and Schirmer O F 1995 Ferroelectrics 165 319 [14] Badorreck H, Nolte S, Freytag F, Bäune P, Dieckmann V, and Imlau M 2015 Opt. Mater.