Publisher’s version / Version de l'éditeur:
Vous avez des questions? Nous pouvons vous aider. Pour communiquer directement avec un auteur, consultez la première page de la revue dans laquelle son article a été publié afin de trouver ses coordonnées. Si vous n’arrivez pas à les repérer, communiquez avec nous à PublicationsArchive-ArchivesPublications@nrc-cnrc.gc.ca.
Questions? Contact the NRC Publications Archive team at
PublicationsArchive-ArchivesPublications@nrc-cnrc.gc.ca. If you wish to email the authors directly, please see the first page of the publication for their contact information.
https://publications-cnrc.canada.ca/fra/droits
L’accès à ce site Web et l’utilisation de son contenu sont assujettis aux conditions présentées dans le site
LISEZ CES CONDITIONS ATTENTIVEMENT AVANT D’UTILISER CE SITE WEB.
Laboratory Technical Report (National Research Council of Canada. National
Aeronautical Establishment); no. LTR-LA-269, 1984-04
READ THESE TERMS AND CONDITIONS CAREFULLY BEFORE USING THIS WEBSITE. https://nrc-publications.canada.ca/eng/copyright
NRC Publications Archive Record / Notice des Archives des publications du CNRC : https://nrc-publications.canada.ca/eng/view/object/?id=eabebcd5-cc7a-4a77-bffd-691554999015 https://publications-cnrc.canada.ca/fra/voir/objet/?id=eabebcd5-cc7a-4a77-bffd-691554999015
NRC Publications Archive
Archives des publications du CNRC
For the publisher’s version, please access the DOI link below./ Pour consulter la version de l’éditeur, utilisez le lien DOI ci-dessous.
https://doi.org/10.4224/23000515
Access and use of this website and the material on it are subject to the Terms and Conditions set forth at
Further model studies of the wind resistance of two loose-laid
roof-insulation systems (high rise buildings)
Ser-TL570 L913 ational Research Ci ouncil Canada LTR-LA-
Jb
/
Conseil national de recherches Canada ARCV ____jNATIONAL AERONAUTICAL ESTABLISHMENT
LABORATORY TECHNICAL REPORT
LTR- LA- 269
FURTHER
MODEL STUDIES
OF THE
WIND RESISTANCE
OF
TWO LOOSE-LAID ROOF-INSULATION SYSTEMS
(HIGH
RISE BUILDINGS}
R.J. KIND, M.G. SAVAGE AND R. L. WARDLAW
RAPPORT TECHNIQUE DE LABORATOIRE
ETABLISSEMENT AERONAUTIQUE NATIONAL
N R C - CISTI
AERO
I
M.E.
LIBRARY
APRIL 1984
BIBLIOTH
UE
OTTAWA, CANADAAER:O
I
G.M
.
I+
National Research Council Ganada Conseil nationalde
recherches Canada NATIONAL AERONAUTICAL ESTABLISHMENT t'TABLISSEMENT AtRONAUTIQUE NATIONAL PAGES PAGES FIG. DIAG. TABLES TABLES FOR POUR REFERENCE RtFfRENCE26
21
1REPORT
RAPPORT
LABORATORY/ LABORATOIREDow Chemical of Canada, Limited
Purchase Order
#X90401dated Sept.
2, 1983LTR-
LA - 269
FURTHER MODEL STUDIES OF THE WIND
RESISTANCE OF TWO LOOSE-LAID
ROOF-INSULATION
SYSTEMS
(HIGH-R
ISE
BUILDINGS)
DATE
APRIL
1984 DATI;__;..:....;..;..:_;;:...,:..;...:...;__ LAa. DADIA CONN. LAI· - - -~·;: •• ,,._4_0_4_0_-_1 _ _ sueMITTED av R. J.Templin
PRti!IENTf P A R : . . 1 . . -L.A•OIIIATOflltY HIEAD CHK, DK LAaOIIIATOIRIR.
J.Kind
M. G. Savage
AUTHOR R Lw
dl
APPROVED APPAouvt _ _ ~G::-:.!::-:!:Ml...!.~L:..:!i:.!.n~dl.!<b~e~r~g_ _
_
OIIIICTDII 1'011 .. P'OIIIINULAUII A DIIIICtiUII AUTEUA_:...::....;..• -=.•;...;.;.:a:..:r:...=.=:..::;a~W----COitY NO.'?.t./784-t,
COitll N A ·-SUMMARY
This report is concerned with wind tunnel tests of two protected membrane roofing systems in which insulation boards are loosely laid over the water-impermeable membrane. The tests were carried out to investigate the resistance of these systems to damage by high winds when they are installed on high-rise buildings. These tests are an extension of earlier tests conducted for low-rise buildings.
A number of variants of each system were tested and the observed wind speeds for failure are presented. Failure modes are described. Failure can be by gravel scour when gravel is used, or by uplift of insulation boards or pavers. Uplift is caused by pressure differences which can develop across boards or pavers located in regions where the pressure distribution produced by wind flow over the building
is highly non-uniform.
High parapets are very effective for reducing susceptibility to wind damage. Mechanical interconnection of insulation boards or pavers is also effective.
TABLE OF CONTENTS
Summary
Table of Contents List of Symbols
1. INTRODUCTION
2. DESCRIPTION OF THE TESTS
3.
4.
5.6.
2. 1 Description of the Models 2.2 Test Conditions
2.3 Test Procedures EXPERIMENTAL RESULTS
3.1 Failure Wind Speeds and Failure Hodes
3.1.1 Failure Hodes or the Basic Fabric
&
Gravel System 3.1.2 Failure Hodes or XFS-4249 System3.1.3 Failure Hodes or Paving Slab Arrays 3.2 Pressure Distribution Results
3.2.1 Bare Roof Deck
3.2.2 Fabric and Gravel Roofing System 3.2.3 XFS-4249 Roofing System
3.2.4 Pressure at Base or Parapets DISCUSSION CONCLUSIONS REFERENCES TABLE 1 FIGURES i i i ii iii 2 3 6 7
8
8
8 10 11 12 13 14 15 18 18 23 24 G n p Poo S(n) tu
u'
v
w z a v pi i i iii 2 3 6 7
8
8 8 10 1 1 12 13 14 15 18 1823
24
G h L n p S(n) tu
u'v
LIST OF SYMBOLSstatic pressure coefficient,
(
p-p
)/~pV2; Cp= (p-p00)/~PV2; Cp:(p-p00)/~pV2 00nominal gravel size as determined by sieve analysis (50% by weight is larger than this size and 50% by weight is smaller) gust factor; ratio of one-second gust speed to hourly mean wind speed
building height, see Figure 1 parapet height, see Figure 2 building length, see Figure 1 a reference length
frequency (Hz)
local static air pressure;
p
is mean static pressure,p is
peak-suction pressureambient static air pressure
power spectral density at frequency n thickness of an insulation system element
mean velocity of ambient wind approaching model at any height z
mean velocity of ambient wind approaching model outside the boundary layer
root-mean-square of fluctuating component of velocity of wind approaching model at any height z
mean speed of ambient wind at rooftop leve~also a reference velocity
VF1,VF2 ambient wind speed at rooftop level at which minor and major, respectively, failure of roof-insulation system occurs (see Section 3.1) w z a v p
building width, see Figure 1 height above ground
wind direction angle, see Figure 1
thickness of boundary layer in wind tunnel kinematic viscosity of air
density of air
density of solid objects, such as insulation system elements ~s width of paving slabs or insulation boards
SUBSCRIPTS M denotes model P denotes prototype iv 1.
n
scale, purpo~ damage ear liE on a r in the of Do\li previo the me The s; tunnel report avoid 1 for , theme 1 referrE the fal layer c a sta81 were rE on top at the ('paver rooftop (Ref ere • Regis •• alsots 1. INTRODUCTION
This report is concerned with wind tunnel tests, at model scale, of two roofing systems designed for flat roofed buildings. The purpose of the tests was to investigate the resistance of the systems to damage by high winds. The same two roofing systems were the subject of earlier tests (Ref. 1). In the present tests the systems were installed on a model of a high-rise building; a low-rise building model was used in the earlier work. Both sets of tests were carried out at the request of Dow Chemical Canada Inc.
The present tests can be considered as an extension of the previous tests, the main difference being the shape or proportions of the model building on which the model roofing systems were installed.
The same methods and the same model roofing-system components, wind tunnel and test setup were used in both sets of tests. The present report is written so as to be essentially self-contained; however, to avoid undue repetition, the reader is occasionally referred to Reference 1 for detailed information which is not essential for following the main theme of this report.
The two roofing systems that were tested will henceforth be referred to as the 'fabric system'** and as the 'XFS-4249 system'. In the fabric system the impermeable membrane is placed on the roof deck; a layer of 2 ft x 4 ft Styrofoam* insulation boards is then loose-laid in a staggered joint array on top of the membrane. Two-inch thick boards were represented in the present study. Next, a permeable fabric is laid on top of the insulation boards and finally a layer of gravel is spread at the rate of about 10 lb/ft2 of rooftop area. Concrete paving slabs ('pavers' ) can be used in lieu of gravel at the upwind corners of the rooftop where gravel is especially prone to scouring by the wind (Reference 2). No bonding agents or mechanical fasteners are necessary. t Registered trademark
11 also referred to as the 'fabric and gravel system'
The XFS-4249 system is a system in which the impermeable membrane is also placed directly on the roof deck. A layer of 2 ft x 4 ft insulation units is then laid in a staggered array on top of the membrane. These insulation units or 'boards' are of composite construction, consisting of 2 to 3 in thick Styrofoam boards having a 3/8 in thick latex modified concrete facing. The concrete facing forms the exterior surface of this system. Two-inch thick Styrofoam boards were represented in this investigation. The boards are tongued and grooved along their long edges so that they form an interlocking system when installed; they weigh about 4.5 lb per square foot. Around the outer periphery of the rooftop the boards may be mechanically fastened to the parapets or gravel-stop edge, but other than this there is normally no direct mechanical fastening of the boards to the roof deck. The boards may however be fastened to one another in certain regions of
the rooftop by means of sheet-metal 'strapping' laid on the surface and fastened to the boards by screws which penetrate into, but not through, the boards. Similarly, boards may be interconnected at intersection points in the board array by use of small sheet metal plates which are attached by a single screw into each of the three adjoining boards.
This report describes the wind tunnel tests and presents and discusses the results obtained with the high-rise building model.
2. DESCRIPTION OF THE TESTS
The tests were conducted in the NAE 30 ft x 30 ft wind tunnel. Arrangements were made so that the flow in the wind tunnel approximately simulated the natural wind. One-tenth scale model buildings and roof-insulation systems were used for the tests. The majority of the runs were done with the walls of the building at 45° to the wind direction because past experience indicated that this is the most critical orientation; in two runs the wind angle a (see Fig. 1) was 34°, a case for which some full scale field data were available.
2 2.1 DE and in pro tot In trod report X 60 J define. intercl height: The ro smooth interne during (1.2 ID1 conforrr distrib either structu parapet, was lea could b• area eq bonded-D model t model mE The mod continuo full-sea of 1,100 model me
>le
:
4
the ite g a rms .rds and 5tem the ened r is .eck. .s of 1 and )Ugh, :::tion 1 are s and unnel. mately roof-e runs •ection ~itical a case2.1 Description of the Models
All model dimensions, including those of the gravel, pavers and insulation boards, were one-tenth of the corresponding full-scale or prototype dimensions of the fabric and XFS-4249 systems described in the Introduction. Unless otherwise stated, all dimensions quoted in this report are full-scale values.
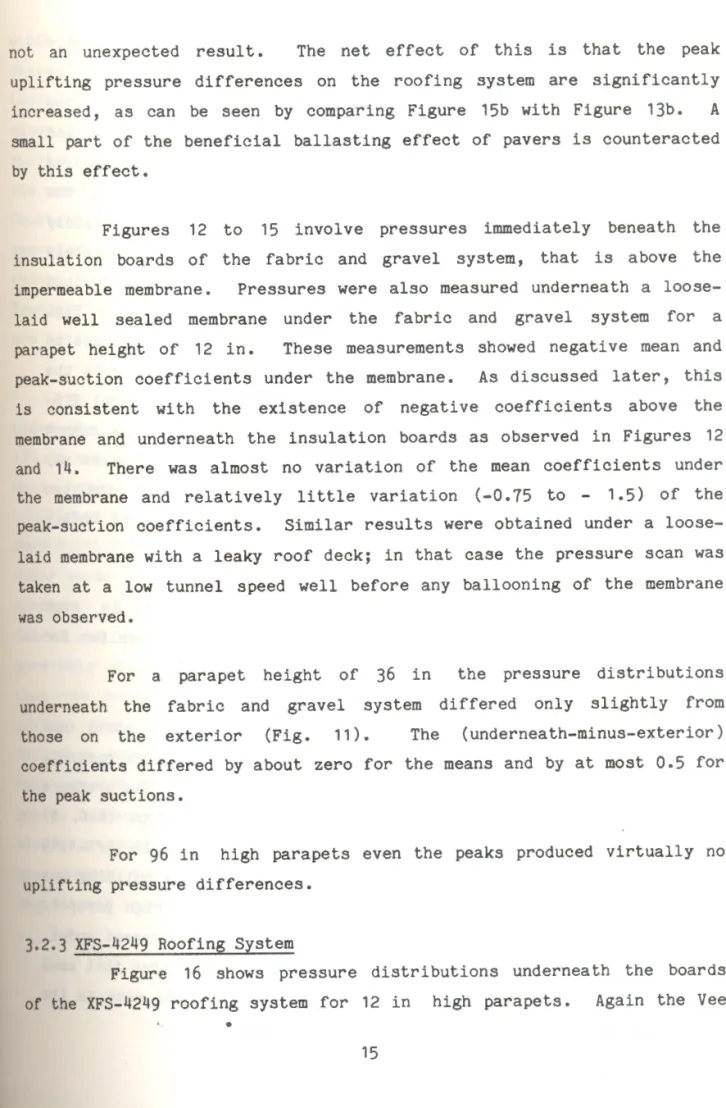
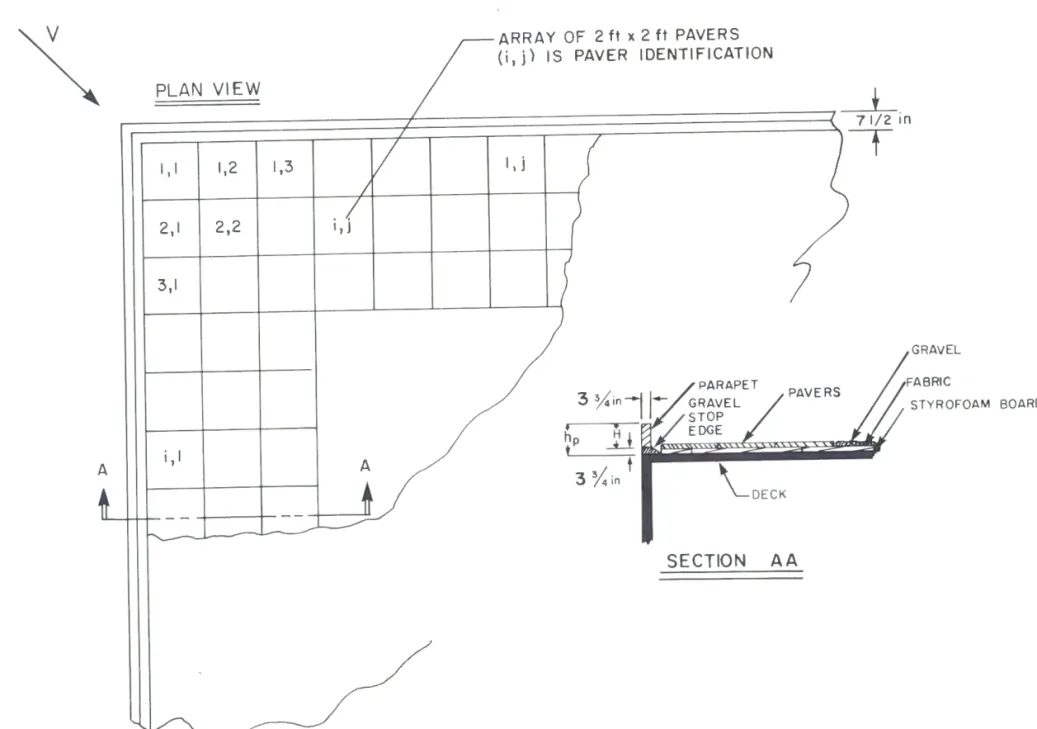
Only one building was tested; its basic dimensions were 30 ft x 60 ft x 75 ft high. Figure 1 shows a sketch of the building and defines some of the nomenclature. The parapets on the model were interchangeable and tests were run with a number of different parapet heights. The parapet geometry and dimensions are shown in Figure 2.
The roof deck of the model was made of Plexiglas and was therefore
smooth and quite flat; the roof deck and building were reinforced with internal stiffeners so that no perceptible panel vibrations occurred during testing. The roof deck was fitted with 180 static pressure taps
( 1 • 2 mm ID); as shown in Figure
3,
these were arranged in a pat tern conforming with the roofing-system board pattern since pressure distributions underneath individual boards were of interest.In full-scale installations the impermeable membrane can be either bonded to the roof deck or loose-laid and sealed to the roof structure only around its outer periphery, that is at the base of the
parapets or gravel-stop edge. The model building had a roof deck which was leak-tight except for ten 2.5 in (full scale) diameter holes which could be sealed if desired. When open, these holes gave a total leakage
area equal to 0. 02% of the deck area. When these holes were sealed a bonded-membrane situation was simulated and no membrane was used in the model tests for this situation. It was, however, necessary to use a model membrane to correctly simulate the loose-laid membrane situation. The model membrane consisted of a 0.00045 in thick (model scale) continuous plastic film having a Young's modulus, E, of 13,000 psi. The full-scale membrane is typically 0.045 in thick with a Young's modulus of 1,100 psi. The product, Et, of Young's modulus and thickness for the model membrane should ideally have been one-hundredth that of the full
scale membrane to correctly simulate membrane elasticity. Unfortunately
thin films having E significantly less than 13,000 psi are unobtainable and 0.00045 in was about the lower limit on thickness. Thus the model membrane was about 10 times too stiff in tension. However the tensile loads on the model membrane appeared to be modest and it is judged that membrane behaviour is not greatly influenced by tensile stiffness. In the model, the membrane weight per unit area should ideally be 1/10 that of the full-scale membrane; in actual fact the ratio was 1/100. However the membrane weight is insignificant compared to that of the gravel or XFS-4249 boards so that the improper scaling of membrane weight is of no consequence. When used, the model membrane material was laid flat on the roof, lightly stretched so as to just remove all wrinkles and, except for Run No. 83.23, clamped under the gravel stop edge or parapet of the model; grease and tape were used under and outside the gravel stop and parapet to seal the membrane periphery. This arrangement was judged to give a good repesentation of a full-scale loose-laid membrane
installation in which the membrane is well sealed to a leak-tight roof deck around its periphery. Some or all of the ten 2. 5 in holes mentioned above were left open when simulation of a leaky roof deck was
required. Figure 4 shows the positions of these holes.
A number of variants of the two roofing systems were tested.
Only one nominal gravel size, d, was used with the fabric system, namely
0.9 in. In many runs, arrays of 2 ft square pavers were placed near the
upwind corner of the rooftop; with the XFS-4249 system these were placed
on top of the boards and with the fabric system they were placed on top
of the fabric and no gravel was used in the area covered by pavers. The building and roofing system configurations used in each individual test run are given in Table 1.
The wind-induced motion of the model roofing system elements must be dynamically similar to that of the prototype elements, that is, the elements of the fabric and XFS-4249 systems. This requires that the
4 aver. as insu maki boar by u woul syst havi lb/f comp tent corr• 4249 boarc roof: long mode) paver thic~ accur perme tenth perme fabri• proto in th fabric all d: rooft< The
a=
The sttely able odel sile that In that ~ever ~1 or 'f no 1t on and, rapet ;ravel t was lbrane . roof holes ested. namely ar the placed on top The .1 test lements 1at is, hat the
average density (mass per unit volume) of the model elements be the same as that of the prototype elements. In the case of the Styrofoam insulation boards used in the fabric system this was achieved simply by making the model boards out of the same material as the prototype boards. Similarly, in the case of the gravel this requirement was met by using small size natural gravel as the model material. This approach would have been difficult in the case of the boards used in the XFS-4249 system and the model boards were instead made of sealed white pine wood having a density of 25 lb/ft3 which is close to the average density, 23 lb/ft3 of the prototype boards; the slight density difference was compensated for by making the model boards slightly thinner than one-tenth the prototype thickness so that the board weight per unit area was correctly scaled. The tongue-and-groove geometry of the prototype XFS-4249 boards was accurately reproduced at one-tenth scale on the model boards. With only one exception (run No. 83.47) the boards of both roofing systems were always laid with their long axes parallel to the long walls of the building and the joints were always staggered. The model pavers were made of aluminum and were equivalent to full-scale pavers having a weight per unit area of 26 lb/ft2 and a nominal thickness of 1 3/4 in; all surfaces and edges of the model pavers were accurately flat, smooth and square relative to each other.
As already mentioned, the fabric roofing system makes use of a permeable fabric which is laid over the insulation boards. Correct one-tenth scale modelling requires that the fabric used in the model has a permeability
"\)"1()
times greater than the prototype fabric. A model fabric having a permeability of 10.2 ft3/lbf-sec, about 3.3 times the prototype permeability, was used; this fabric was identical to that used in the tests of Reference 1 • Like the prototype fabric, this model fabric was non-woven and was judged to be essentially inextensible in all directions under the anticipated loads. The fabric was laid on the rooftop in 10 ft wide strips with about 1 ft overlap between strips. The axes of the strips were parallel to the long walls of the building. The strips were not bonded to one another along the overlap.Fabric-backed adhesive tape was used to simulate strapping and other mechanical fastening arrangements.
2.2 Test Conditions
If the model tests are to be meaningful, conditions must be such that the model behaviour is dynamically similar to that of the prototype. The requirements for achieving this are discussed in detail in Reference 1. Briefly, wind speeds must be related according to the equation
( 1)
and roofing system elements such as gravel and boards must meet requirements already mentioned in Section 2. 1
approaching the model should have the same
Furthermore, the wind velocity profile and turbulence structure as the natural wind. This requirement cannot be met at one-tenth scale in the
30
ft x30
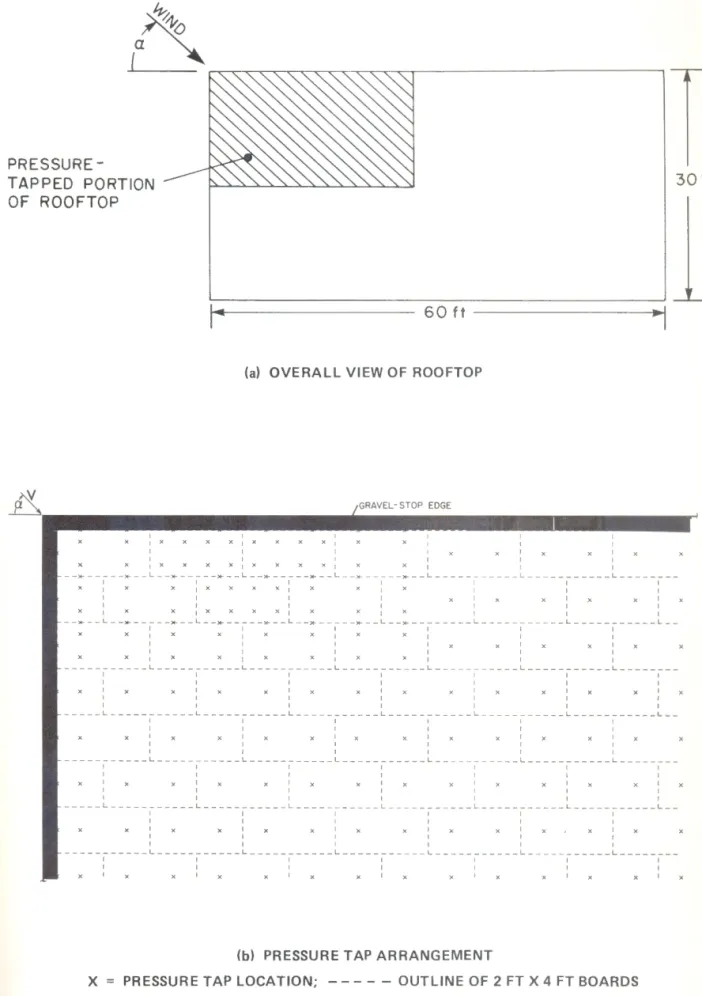
ft wind tunnel as i t would require a 150 ft thick wind profile, an obvious impossibility. As in the tests of Reference 1 , a turbulent boundary layer was produced by placing 15 ft high spires at the upstream end of the working section, followed by 60 ft of 6 in cube roughness elements. The velocity profile and turbulence characteristics were measured in the present tests since this was necessary to determine the gust factor at rooftop level of the present model. The velocity and turbulence profiles are shown in Figures 5 and 6 respectively; these agree well with the corresponding data given in Reference 1. Power spectra of the longitudinal turbulence are shown in Figure1.
The gust factor, G, at rooftop level in the wind tunnel is1.3.
The suitability of this wind simulation is discussed in Reference 1.The centre of the model building was positioned on the centre line of the 75 ft long working section of the wind tunnel, 68 ft downstream of the spires.
6 wind roof. tube the const in t\ was ' the speed the ~ co nne trans co nne in. ampli freqw tests the tt Hz an1 at 1 l should instru transd and ea second rather
and 3t be ' the .etail o the meet ~ wind e and not be would As in teed by ection, elocity present rooftop les are ~.th the of the , G, at tis wind e centre 68 ft 2.3 Test Procedures
The basic test procedure consisted of gradually increasing the wind speed in the tunnel and visually observing the behaviour of the roofing system. The behaviour was also recorded on video tape.
Wind speed in the tunnel was determined from a pitot-static tube mounted about 18 in out from the wind tunnel side wall, 15 ft above the floor. This Pitot-static tube was connected across the long time-constant precision manometer normally used to measure dynamic pressure in the tunnel. The dynamic pressure sensed by this Pitot-static tube was correlated with the wind speed at rooftop level of the model during the velocity-profile measurements mentioned earlier. Thus, mean wind speed at rooftop level could be accurately determined; multiplication by the gust factor,
1.3,
gives the corresponding gust speed.The 180 static pressure tappings mentioned earlier were connected via 4 SCANIVALVES to flush-diaphragm SETRA
±
0.5 psid pressure transducers (one transducer in each SCANIVALVE). Each pressure tap was connected to the SCANIVALVE head by plastic tubing, 24 in longx
0.054 in. ID; according to Reference3,
this arrangement should give an amplitude response flat within 10% for pressure fluctuations up to 20 Hz frequency. This was judged to be entirely adequate for the present tests because at tunnel speeds used during pressure scans the peak of the turbulence spectrum of Reference 1 occurs at a frequency of about 1Hz and at 20 Hz the eddies are about 5 times less energetic than those at 1 Hz. In other words, the pressures produced by the strongest gusts should easily be measured without significant distortion by the pressure instrumentation used in these tests. During pressure scans the transducer outputs were sampled at the rate of 200 samples per second and each pressure tap was sampled over a total time of
8
seconds; the8
second period consisted of 4 independent blocks of 2 seconds each. This rather unusual procedure was necessitated by peculiarities of thetunnel's data acquisition system at the time of the tests. The
8
secondsampling time was judged to give a reasonable compromise between quality
of time-history data and consumption of running time. The pressure data
were processed to give mean (time-average), root-mean-square, maximum
and minimum pressure coefficients.
3.0 EXPERIMENTAL RESULTS
3.1 Failure Wind Speeds and Failure Modes
This section presents the wind speed values which were observed to cause failure of the roofing system in each test run. Also presented are the descriptions of the failure modes.
For presentation of these results it is convenient to define
two failure speeds as follows:
VF1 The ambient wind speed at rooftop level at which significant, but relatively
(e.g. one or two pavers
minor failure occurred or insulation boards scoured off several dislodged, or gravel completely
square feet of rooftop, etc.).
The ambient wind speed at rooftop level at which relatively major failure occurred (e.g. 10 or more pavers or insulation boards dislodged, etc.).
Table 1 lists the full-scale values of the gust speeds VF1 and VF2; only
gust speeds are given because gust speed is the pertinent speed for design purposes. The failure modes are also briefly described in
Table 1.
3.1.1 Failure Modes of Basic Fabric
&
Gravel System:Failure of the basic fabric and gravel roofing system over a bonded impermeable membrane always occurs in essentially the same way on
both the high-rise building (present tests) and the low-rise building
(Ref. 1). At wind speeds predictable by use of Reference 2, a portion 8 of gra· a CCI The. boa1 pre: undt sysi At : und1 linE the lonf the lea~ para the of 1 virt as i deck this impe roof betw• bill< cond: roof for
econd ality data xi mum were Also lefine which mrred >Oards !veral which more ; only :d for )Ver a way on ilding oOrtion
of the rooftop near the upwind corner of the building is scoured bare of gravel; some of the scoured gravel leaves the rooftop but most of it accumulates in relatively deep piles near the edges of the bare patch. These piles tend to hold the fabric in place. The Styrofoam insulation boards in the bare portion of the rooftop tend to be lifted up by pressure differences genera ted by the wind flow, but they are trapped under the fabric. The fabric is very effective in stabilizing the system so that failure occurs gradually rather than catastrophically. At some higher wind speed the edges of the fabric may be pulled out from under the gravel accumulations, or, if the bare patch is over an overlap line between fabric strips, a gap may open between the adjacent strips; the Styrofoam boards from the bare portion of the rooftop, being no longer trapped by the fabric, are then blown away, usually right off the rooftop. This is the F2 failure condition.
With a loose-laid impermeable membrane laid directly on a leak-tight roof deck and fastened and sealed around the base of the parapet or gravel stop, failure occurred at the same wind speeds and in the same manner as with a bonded membrane. No billowing or ballooning of the membrane was observed for these conditions and the membrane had virtually no effect on roofing system behaviour. This is not surprising as it is impossible for the loose-laid membrane to lift up from the roof deck unless air can enter between the membrane and the roof deck, and this is precluded by the sealing around the membrane periphery and the impermeability of the membrane and of the roof deck.
When a loose-laid impermeable membrane is installed on a leaky roof deck or without good sealing around its periphery, air can enter between the membrane and the deck and the membrane can balloon or billow. Such ballooning was in fact observed in all runs where these conditions prevailed. The ballooning tends to facilitate failure of the roof system and failure occurs at slightly lower wind speeds; compare, for example, the F 1 speeds for Runs 83.29 and 83. 16 in Table 1. The
only cases where leakiness of the roof deck or of the peripheral sealing
was observed to have a substantial effect on the fabric system were Runs
83.23 and 83.24(a). In these runs the loose-laid membrane was fastened
at the top rather than at the base of the 1 ft. high parapet. There was
thus a great deal more slack available in the membrane so that it was
able to balloon to greater heights immediately adjacent to the parapets.
As a result the F2 wind speed in run 83.23 was substantially lower than
that of run 83.16 and the F1 speed of run 83.24(a) was substantially
lower than that of run 83.24(b). It is clearly advantageous to fasten
loose-laid membranes at the base of the gravel stop or parapet, rather
than at the top.
3.1.2 Failure Modes of XFS-4249 System
In all of the present test runs except No. 83.47 the
peripheral boards of the XFS-4249 system were restrained in one of two
ways:
(a)
(b)
'picture-frame' strapping, where continuous strapping
is installed all around the roof-system to tie together all the peripheral boards; in addition short lateral straps are installed at 10 ft. intervals to tie the
peripheral strap to the parapet or gravel stop (see photos, run 83.31, Table 1).
peripheral boards are mechanically fastened to the gravel stop or parapet base, for example by extending the peripheral counterflashing a few inches out over the top of the boards.
Neither restraining scheme involves any perforation of the impermeable
membrane. As mentioned earlier, in the model tests adhesive tape was
used to simulate the fastening arrangements.
With these restraining schemes the peripheral boards were
somewhat free to tilt towards the parapets or gravel stop, and, with
10 pict litt inte spee its rows laye: sinc1 OCCUI ft cons: mean wind bulgE inter bet we for E speed strap adjac locat rooft near these sud del the r
ing uns ned was was ~ts. ;han llly ~ten ther the two >ping :!ther teral ! the (see the mding over neable >e was , were with
picture-frame strapping, to heave or bounce. However they generally had little freedom to move laterally and as a result the whole layer of interlocking boards behaved as an integrated system. At the higher wind speeds the board layer bulged upwards. The bulge was elongated, with its long axis parallel to the tongue-and-groove joint lines between the rows of boards, these joint lines acted essentially like hinges in the layer of boards. In the other direction the layer was somewhat stiffer since the boards were laid with the other joints staggered.
With parapet heights of 1 ft or lower the peak of the bulge occurred about 3 joint lines in from the long upwind side and about 15 ft from the upwind corner of the rooftop. The bulges fluctuated considerably in height with an amplitude roughly equal to 50% of the mean bulge height. The bulge height generally increased with increasing wind speed and, unless prevented by extra strapping in the region of the bulge, failure occurred at the bulge by virtue of the tongue-and-groove interlock coming apart along the joint lines. The wind speed increase between first observation of bulging and failure was typically modest: for example, in Run No. 83.34 bulging was first observed at a mean wind speed of 58 mph and failure occurred at 65 mph. In some runs extra strapping or interconnection of boards were used over the 3 to 6 rows adjacent to the long upwind side of the rooftop; in these cases the location of major failure was shifted to the downstream end of the rooftop (compare, for example, runs 83.34 and 83.41, Table 1).
With the 3 ft and 8 ft high parapets, the bulging occurred near the downwind end of the rooftop and was rather erratic. Failure in these cases occurred very suddenly with a larger number of boards suddenly dislodged and blown off the rooftop.
3.1.3 Failure Modes of Paving Slab Arrays
A variety of paver arrays was used near the upwind corner of the rooftop with both the fabric and the XFS-4249 system. In some
cases, strapping was used to interconnect the pavers. In general, the
pavers served their intended purpose, namely to defer gravel scouring or
lifting of XFS-4249 boards to higher wind speeds. However at
sufficiently high wind speeds the paver arrays are themselves
susceptible to failure; the failure generally occurs as described in Reference 1. That is, in the absence of strapping, individual pavers adjacent to the long upwind edge of the rooftop are tilted towards the parapet and dislodged by uplifting pressure differences; at higher wind speeds, pavers in the second row from the parapet are dislodged. No pavers were blown off the rooftop. When strapping is present individual pavers cannot move independently; this increases the wind speed required to damage the paver array. At sufficiently high wind speeds, however,
several interconnected pavers are simultaneously lifted by the stronger gusts so that these pavers tend to bounce; at still higher wind speeds these pavers remain almost continuously 'airborne' at a height of roughly 6 - 12 inches (full scale) and are held only by the strapping. The airborne pavers may overturn. At these windspeeds other modes of
failure are typically occurring in other parts of the rooftop, for
example by gravel scour, or by failure of the XFS-4249 board system.
3.2 Pressure Distribution Results
As mentioned earlier, static pressures were measured at 180
points on the rooftop of the model building, near its upwind corner (see
Fig. 3). The results are presented in terms of computer-generated
contour plots of pressure coefficient. Both mean and peak-suction pressure coefficients are presented for a variety of runs.
Root-mean-square and minimum-suction coefficients were also evaluated but no plots are presented as these data offer little additional insight into roofing
system behaviour. All pressure coefficients are based on the mean
dynamic pressure of the approaching wind at rooftop level.
• 12 ins dis sys~ 11 1 roof,
36
i cont cons expe dired vorte In tl even imply: lengt of co exhib. build· (most with l broadE increa aforea inward coeffi 11(36
The me the me parape·the .g or at ~lves d in :~.vers 3 the wind No idual uired rever, ·onger Jpeeds :1t of ~ping. les of ., for lt 180 1r (see 1erated 3uction ;-mean-> plots roofing .e mean
3.2.1
Bare Roof DeckPressure distributions measured without any roofing system installed on the model (bare roof deck) correspond to the pressure distribution, which would prevail on the exterior surface of a roofing
system for any given building geometry and wind direction. Figures
8
to11
present mean and peak-suction pressure distributions for the bareroof deck with full-scale parapet heights, hp, of
3 3/4
in and12
in and36
in. The wind angle a is45°
except in Fig. 10 where it is34°.
Thecontours are rather irregular; much of this is thought to be a
consequence of the relatively short sampling period used during the
experiments.
The contours show the 'Vee' pattern that is typical for wind
directions oblique to the building walls and is due to the presence of a
vortex near each upwind edge of the rooftop for such wind directions.
In the present case the patterns are not symmetrical about a
45°
lineeven for
45°
wind angles because the building is a high-rise shape,implying that the flow field near the upwind corner is influenced by the
length: width ratio; the ratio for the present building is 2, implying,
of course, a non-symmetrical roof planform. The pressure distributions
exhibit the same trends as those observed in the case of low-rise
buildings (References 1,1). That is, suction pressures are greatest
(most negative values of Cp) for low parapets and decrease monotonically
with increasing parapet height. Also the regions of high suction become
broader and move inwards from the roof edges as parapet height
increases. Both trends are consistent with higher parapets causing the
aforementioned vortices to stand farther above the rooftop and farther
inwards. In Figure
8
(3 3/4
in parapets) mean and peak-suctioncoefficients as low as -4 and -8 respectively, are observed; in Figure
11
(36
in parapets) the lowest values are only-1
and -1.8 respectively.The mean and peak-suction pressure coefficients were almost uniform over the measurement area at -0.5 and -1 respectively for the 96 in high
parapets; contour plots are therefore not shown for this
13
case. The peak-suction coefficients have magnitudes about twice those of the mean coefficients in all cases. The magnitudes of the coefficients are lower for a
=
34°
than for a=
45°
(compare Figs.10
and8),
suggesting that45°
is the critical wind direction. Howeverit is possible that a
=
60°
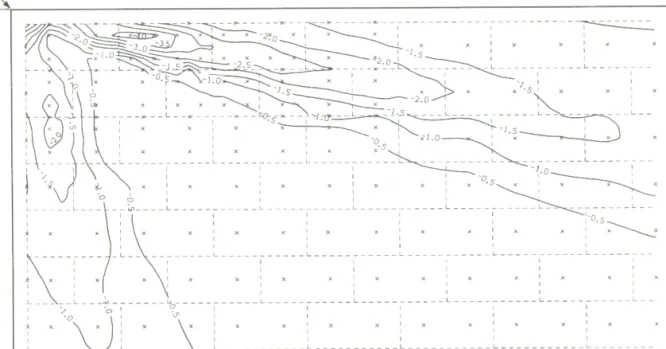
is a more critical wind direction.3.2.2 Fabric and Gravel Roofing System
Figures 12 to 15 show pressure distributions for the fabric
and gravel roofing system for 12 in. high parapets. Comparison of
Figures 9 and 12 shows that the Vee-shaped pressure pattern on the
exterior of the roofing system (Fig. 9) also establishes itself
underneath the roofing system (Fig. 12); as discussed in References 1
and
4,
the results show that the exterior and underneath regionscommunicate via the joints between the boards so that the suction
pressures on the exterior give rise to suctions underneath the boards as
well. Thus the pressures above and below the boards tend to equalize
and the uplifting forces on the boards are much less than would be
suggested by the exterior pressures alone. This phenomenon applies to
both the mean and peak-suction pressures. The strongest suctions occur
on the exterior surface, however, so that there may be some uplifting
pressure force acting on some of the boards, notably those in the
regions of strongest suction. This is clearly seen in Figure 13 which
shows contours of the pressure difference across the roofing system,
obtained by subtracting the data of Figure
9
from those of Figure 12.Figure 14 shows pressure distributions underneath a fabric
roofing system identical to that of Figure 12, except that an array of
48 pavers has been added in the upwind corner of the rooftop. The
pavers have only a relatively small effect on the mean pressure distribution but the magnitudes of the peak suctions underneath the boards are significantly reduced. This suggests that the extra layer of elements slows down the pressure-equalization process by introducing addi tiona! resistance to flow between the joints and under the boards,
14
•
not upli incr1 smal: by tl insuJ imper laid para I peak-is c membr and the r peak-laid taken was o under those coeff: the P• uplift of thEiOSe the .gs. brio , of the self es 1 ;ions Is as :t.lize d be ~s to occur fting 1 the which •stem, )
..
~abric •ay of The essure . h the yer of ducingnot an unexpected result. The net effect of this is that the peak uplifting pressure differences on the roofing system are significantly increased, as can be seen by comparing Figure 15b with Figure 13b. A small part of the beneficial ballasting effect of pavers is counteracted by this effect.
Figures 12 to 15 involve pressures immediately beneath the insulation boards of the fabric and gravel system, that is above the impermeable membrane. Pressures were also measured underneath a loose-laid well sealed membrane under the fabric and gravel system for a parapet height of 12 in. These measurements showed negative mean and peak-suction coefficients under the membrane. As discussed later, this is consistent with the existence of negative coefficients above the membrane and underneath the insulation boards as observed in Figures 12 and 14. There was almost no variation of the mean coefficients under the membrane and relatively little variation (-0. 75 to - 1.5) of the peak-suction coefficients. Similar results were obtained under a loose-laid membrane with a leaky roof deck; in that case the pressure scan was taken at a low tunnel speed well before any ballooning of the membrane was observed.
For a parapet height of 36 in the pressure distributions underneath the fabric and gravel system differed only slightly from those on the exterior (Fig. 11). The (underneath-minus-exterior)
coefficients differed by about zero for the means and by at most 0.5 for the peak suctions.
For 96 in high parapets even the peaks produced virtually no uplifting pressure differences •
3.2.3 XFS-4249 Roofing System
Figure 16 shows pressure distributions underneath the boards of the XFS-4249 roofing system for 12 in high parapets. Again the Vee
•
pattern of the exterior pressure distribution (Fig. 9) is clearly
apparent underneath the system. The pressure-difference coefficients
across the system are shown in Figure 17. The mean results (Figs. 16a
and 17a) are much the same as the corresponding results (Figs. 12a and
13a) for the fabric and gravel system. However the peak-suction results
(Figs. 16b, 17b vs. Figs. 12b, 13b) are noticeably different; the pressure-equalization process apparently does not occur quite as rapidly
with the XFS-4249 system so that the peak suctions are not as completely
equalized. The peak uplifting pressure-difference coefficients thus tend to be slightly larger for the XFS-4249 system (Fig. 17b vs Fig. 13b). This is presumably due mainly to a somewhat higher resistance to flow of the joints between the XFS-4249 model boards as compared to the model Styrofoam boards of the fabric and gravel system. The model
XFS-4249 boards did in fact fit together snugly. Joint resistance cannot
however be modelled with great accuracy and the equalization process may
well be virtually the same for full-scale installations of the two
systems. In any case it would appear to be desirable to avoid unduly
tight joints between boards.
Results for the XFS-4249 system with 36 in and 96 in high
parapets are similar to the corresponding results described earlier for
the fabric and gravel system.
Figures 10 and 18 show pressure distributions above and
underneath, respectively, the XFS-4249 system for 12 in high parapets
and a wind angle a of 34°. Figure 19 shows contours of the pressure
difference for this case. These data were taken because Cook (Ref. 8)
has measured pressures underneath and above a full-scale XFS-4249
installation in real winds for similar conditions. Cook's building was
98 ft long, 49 ft wide, 49 ft high and had a 12 in high parapet.
Its planform thus had the same proportions as that of the present model,
but the relative parapet height, hp/w was about 50% lower than that used for Figures 10, 18 and 19; moreover since its height is the same as its
•
16 widt shap thos show suet the 1 Cook sec01 repoz Bearj are r under (83.3 well coeff peak-, other simil< fabric bore ( that pre sse Styrof have 1 gravel static have t signif:( y s
'.
>-:>t ay wo tly l..gh for and >ets ~ure.
8)
4249 was ,pet. >del, used ~ itswidth i t cannot be considered to be either a high-rise or a low-rise shape. Thus Cook's results should not be expected to agree closely with those of Figures 10 or 19 or with results of Reference 1 • Figure 20 shows Cook's results; they are in the form of 4-second-average peak-suction coefficients and thus cannot be compared directly with either the mean or peak-suction coefficients of this report. The wind speed in
Cook's run was about 5 m/s and Bowen's data (Ref. 6) suggest that the
4-second-average peak suction values should be less than the peaks of this report by roughly 30% of the difference between peaks and means. Bearing in mind the preceding sentences, the data of Figures 10 and 19
are reasonably consistent with those of Figure 20.
Pressures were also measured underneath a loose-laid membrane
under the XFS-4249 boards with 12 in high parapets. In these runs (83.31 and 83.33) the pressure scans were taken at very low wind speeds,
well before any membrane ballooning was observed. The pressure coefficients under the membrane were found to be negative with mean and
peak-suction distributions quite similar to those in Figure 16. In
other words the pressure distributions above and below the membrane were similar. This is different from the corresponding results for the fabric and gravel system where the pressure pattern under the membrane oore only slight resemblance to that above the membrane. It is thought that the model XFS-4249 boards may have acted as 'bridges' and not pressed down directly on the pressure taps, unlike the more compliant Styrofoam boards of the fabric and gravel system which would probably have pressed directly onto the pressure taps under the weight of the
gravel ballast. If the XFS-4249 boards did indeed act as bridges, the
static pressure above and below the virtually weightless membrane would have tended to be equal, as observed. This behaviour would have no significant impact on the behaviour of the roofing system.
•
3.2.4 Pressure at Base of Parapets
In Reference 1 it was speculated that there might be a high positive static pressure at the base of the parapets. The present model incorporated a number of static taps at this position and no positive static pressure coefficients were observed for any test conditions.
4.
DISCUSSIONThe present results and those of Reference 1 show that roofing
system elements such as boards or pavers are dislodged by uplifting
pressure differences between their top and bottom surfaces. These
differences develop as a result of the airflow over the building. The mechanisms responsible for this are discussed in detail in References and
4;
since those discussions still appear to be entirely valid only a brief outline of the mechanism will be given here.In flowing over a building with relatively low parapets, the wind produces a highly non-uniform static pressure distribution over the exterior surface of the roofing system. In the fabric and gravel system this distribution persists virtually unaltered right through the gravel
layer. Where there are static pressure variations over the exterior
surface of the system there will of course be pressure variations around
the periphery of any given system element (paver or board). This
pressure variation evidently causes air to flow under the element from
the high pressure portions of the periphery to the low pressure
portions. This air enters and leaves the under-element region via the joints between elements. In this way a pressure pattern broadly similar to that on the exterior surface is established underneath the array of roofing system elements.
Figures 12, 14 and 16 clearly exemplify this phenomenon.
However the pressures underneath and above the elements are not
identical and in some portions of the rooftop the differences are such as to produce uplift, as seen, for example in Figures 13, 15 and 17.
18
Al
for of a steac =2), tunne a secgh el .ve ing ing .ese The !S 1 .y a the the rstem •a vel :!rior round This from :ssure a the .milar •ay of menon. e not e such nd 17.
Although pressures underneath and above the elements are not identical, they are reasonably similar because the aforementioned flow through the joints results in considerable pressure equalization. Therefore the pressure forces on the boards or pavers are generally much less than the pressure forces on a corresponding area of roof deck. This is because the pressure underneath the roof deck is the internal pressure inside the building and this is relatively independent of the pressure on the roof exterior and can be markedly different from it; the pressures under the boards or pavers on the other hand depend directly on the exterior pressures and differ relatively little from them.
As explained in References and
4,
the roofing system elements most prone to being dislodged are those over which the exterior pressure distribution is most non-linear. This is illustrated in Figure 21. Clearly if the exterior pressure distribution is relatively uniform, as in the case of high parapets, equalization of mean pressures above and below system elements will be virtually complete and almost no uplifting mean pressure differences will act on the elements. If pressure equalization occurred more slowly than the fluctuations of the external pressures, fluctuating uplift forces could develop even in cases where the exterior pressure distribution is spatially uniform, but fluctuating in time. The present results suggest, however, that when only a single layer of elements (boards or pavers) is present the equalization process occurs at least as rapidly as the fluctuations in exterior pressure and in wind speed. The evidence for this is that the ratio of peak-suction to mean pressure coefficients has about the same value for the exterior and underneath pressures in such cases; compare for example Figures 9 and 12 or Figures 9 and 16. The ratio has a value of about 2, which moreover is consistent with instantaneous or quasi-steady response to a fluctuating wind having a gust factor of 1 • 3 ( 1 • 32 =2), 1.3 being the measured gust factor of the approaching wind in the tunnel at rooftop level. As mentioned in Section 3.2.2, the addition of a second layer of elements ( a layer of pavers over the insulationboards) appeared to slow down the pressure-equalization process.
However even in that case the process is evidently quite rapid.
Furthermore, Cook (Ref. 5,
8)
has established that the static pressureunderneath the boards in a full-scale XFS-4249 laboratory installation
can respond very rapidly to changes in the external pressures, the
response time being of order 0.1 second.
In the light of the above, it appears that the uplifting
pressure differences on full-scale boards should easily be able to
respond in a quasi-steady fashion to gusts having a period of order one
second. In addition, aerodynamic forces on a dislodged board or paver,
or on a piece of gravel should behave quasi-steadily in such gusts,
bearing in mind that a particle of air will travel almost 100 ft in one
second at the typical wind speed of about 60 mph at minor failure. It
thus seems reasonable to conclude that the response of the
roofing-system elements is quasi-steady for gusts having periods at least as low
as 1 second.
The data of Durst, quoted in Reference 2, and of Bowen (Ref.
6) indicate that in natural winds of about 15 mph the fastest gusts have
a period of about 0.1 second and that gusts having a period of 1 second
register speeds almost as high. In view of this and the preceding
paragraph it can be concluded that gust speeds are the crucial wind
parameter in so far as failure of the roofing systems is concerned and
that the wind tolerance of a roofing system can be assessed by comparing
the wind-tunnel gust speeds of Table 1 with design gust speeds
determined using the procedure of Reference 2. Minor or major failure
can be expected when the design gust speed is equal to the F1 or F2 gust
speeds, respectively, of Table 1. Since the gust factor of 1.3 in the
wind tunnel is substantially less than gust factors near the ground in
the natural wind, the mean wind speeds of this report should not be used
for design purposes; rather the gust speeds should be used.
20 uplifti over th wind sp weight speed c to the that sy: when hif exterior complete differen importan rooftop importan pavers. increase board or mind, re what con clear. certainl: .s/w, but is very : enable a This is the relat uniform; boards 01
e ~0
r,
s,
ne It ag-.ow ef. ave :ond ling Jind and ring eeds lure gust 1 the 1d in usedAs outlined above, boards and pavers are dislodged by uplifting pressure differences which develop as a result of the air flow over the building. These pressure differences will be proportional to wind speed squared and uplift will occur when pressure difference equals weight per unit area of the boards and/or pavers. Therefore the wind speed causing failure of any particular roofing system is proportional to the square root of the weight per unit area of the elements used in that system.
The results show that wind speeds for failure are greatest when high parapets (hp
=
36 in , 96 in ) are used. This is because the exterior pressure is then nearly uniformcomplete pressure equalization then occurs differences are small. Relative parapet
over the rooftop; and uplifting height, (hp/w),
almost pressure is the important parameter; in controlling the pressure variation over the rooftop as a whole, but the ratios ( t::. s/w) or ( hp/ t::. s) also have an important bearing on the pressure variation over individual boards or pavers. Since board or paver width, t::. s, is constant in practice,
increased hp results in less variation of pressure over an individual ooard or paver even if w increases proportionally. Keeping Figure 21 in mind, resistance to wind damage therefore increases. The question of what constitutes a 'high' parapet for present purposes is not totally clear. The present pressure results indicate that parapets can certainly be considered high if (hp/w) ~ 0.1 regardless of the value of s/w, but lower (hp/w) values would tend to be equally effective when t::.s/w is very small •
Strapping or other methods of interconnecting boards or pavers enable a roofing system to withstand greater wind speeds without damage. This is because strong uplifting pressure differences occur only over the relatively small regions where the exterior pressure is highly non-uniform; i f boards or pavers in that region are mechanically tied to ooards or pavers outside that region, the total weight resisting the
uplifting forces is greater and higher wind speeds are thus required to
cause system failure.
As mentioned in Section
3.
1. 1, a loose-laid membrane is notlifted or caused to billow by the wind, provided that it is well sealed
around its periphery and that it is placed on a leak-tight roof deck.
This is because any lifting of the membrane under these conditions would
imply an increase in volume of the small amount of air trapped between
the membrane and the roof deck and this large fractional volume increase
would imply a very large decrease in pressure (or increase in suction)
of the trapped air. In effect the suction holds the membrane down. If,
however, air is able to leak into the deck/membrane interface the
membrane can rise without development of high suctions. Thus a well
sealed loose-laid membrane on a leak-tight roof deck behaves just like a bonded membrane and does not alter the failure speeds of the roof
system. On the other hand, a loose-laid membrane will billow if air
from a region of relatively high static pressure (such as the building
interior if wind is blowing) can leak into the deck/membrane interface.
The billowing of the membrane is itself a form of failure and it also
tends to facilitate other failures of the roofing system.
In one run (No. 83.49) an impermeable membrane was loose-laid
over the insulation boards and covered with 10 lb/ft2 of gravel. Even when the roof deck was well sealed some billowing of the membrane was
observed where the rooftop had been scoured bare of gravel. In this case a substantial amount of air was trapped between the membrane and deck due to the somewhat irregular surface presented by the array of Styrofoam boards under the membrane. Under the influence of the
non-uniform static pressure distribution prevailing over the membrane
exterior when the wind was on, some of the trapped air evidently
migrated to the upwind corner of the rooftop where static pressures were
lowest. That is, in the high-pressure regions of the rooftop the
membrane was pressed more firmly onto the Styrofoam boards and this
squee corne the chana roof billo area that Styro. suppoJ essen1 unifo1 Styro1 5.
cc
( 1) 1/10 t in hii buildi which (2) pres en (3) those of boar (4) become through cannot distrib0 :d r
..
Ld :m se n) f, he :11 >Of 1ir l.ng ce. lso .aid :ven was ~his and r of non-rane :ntly were the thissqueezed some air towards the low-pressure region near the upwind
corner. Expansion of the trapped air would not have been a factor as
the pressure differences were too low to produce significant density
changes. Later in this test run, two of the leakage holes in the model
roof deck were opened. This resulted, as expected, in increased billowing of the membrane. It is noteworthy that even though a large area of the rooftop had been scoured bare of gravel at this point and that the billow was over 1 ft high and quite unsteady, no motion of the Styrofoam boards was observed under the billowed membrane. This fully supports the view that the space under the billowed membrane is essentially a plenum with very low air velocities and essentially uniform static pressure throughout, including above and underneath the Styrofoam boards.
5. CONCLUSIONS
( 1) A number of variants of two roofing systems were tested at
1/10 th scale in a wind tunnel to investigate their resistance to damage in high winds. The systems were installed on a model of a high-rise building. The tests were an extension of earlier tests (Ref. 1) in which a low rise building was used.
(2) The observed wind speeds at which failure occurred are presented and the various failure modes are described.
(3) The mechanisms responsible for wind damage are the same as those identified in the earlier tests, namely gravel scour and uplifting of boards or pavers by pressure forces.
(4) The static pressures become equal to those on the
underneath boards or pavers tend to exterior surface because of air flow through the joints between boards or pavers. Complete equalization cannot occur, however, in regions where the exterior pressure distribution is highly non-linear (see Fig. 21) and uplifting pressure
differences occur in those regions. System failure by uplift therefore
tends to occur in these regions.
( 5) With relatively high parapets (hp/w > 0. 1 ) the exterior
pressure distributions are approximately uniform and uplifting pressure
differences are small. Failure by uplift then occurs only at relatively
high wind speeds and high parapets are very effective in increasing
resistance to wind damage.
(6) Mechanical interconnection of boards or pavers by use of
strapping, tongue-and-groove etc. is an effective method for increasing resistance to wind damage.
( 7) For any particular system configuration, the wind speed to
cause failure by uplift is proportional to the square root of system weight per unit area.
(8) Gust speed at rooftop level, rather than mean speed, is the
pertinent speed for use in assessing the resistance of the roofing
systems to wind damage.
6. REFERENCES
1. Kind, R. J. and Wardlaw, R .L., "Model Studies of Two Loose-Laid
Roof-Insulation Systems", National Research Council of Canada,
Report LTR-LA-234, May 1979.
2. Kind, R. J. and Wardlaw, R .L., "Design of Rooftops Against Gravel
Blowoff", National Research Council of Canada, Report NRC No. 15544,
Sept. 1976.
3.
Irwin,H.P.A.H.,
Cooper, K.R. and Girard, R., "Correction of Distortion Effects Caused by Tubing Systems in Measurments ofFl ( 1 4. Ki: ROI Ae1 5. Coc Buj 19E 6. Bow ove on Pre
7.
Kin1 Win< ResE8.
CooH Esta Chern Buil 1983ore ior 1ure rely Jing of sing \ to ·stem the )fing -Laid nada, ~ravel
15544,
)n of ts ofFluctuating Pressures", Journal of Industrial Aerodynamics, Vol.
5
(1979), pp. 93-107.4. Kind, R.J. and Wardlaw, R.L., "Failure Mechanisms of Loose-Laid Roof-Insulation Systems", Journal of Wind Engineering and Industrial
Aerodynamics, Vol. 9 (1982) pp. 325-341.
5
.
Cook, N.J., referred to in "Wind Loads on Flat Roofs and Cladding",Building Research Establishment, Garston U.K., BRE News 56, Spring
1982.
6.
Bowen, A.J., "Full Scale Measurements of the Atmospheric Turbulenceover Two Escarpments", Proc. of the Fifth International Conference on Wind Engineering, Ft. Collins, Colorado, July 1979 (Pergamon Press).
7. Kind, R. J., "Wind Tunnel Tests on Some Building Models to Measure
Wind Speeds at Which Gravel is Blown Off Rooftops", National
Research Council of Canada, Report LTR-LA-162, June 1974.
8. Cook, N.J. , "Final Report on Tests by the Building Research
Establishment on the Performance Under Wind Loading of Dow Chemical's Roof Insulation System Type XFS-4249", BRE Feb. A35/9/31,
Building Research Establishment, Garston, Watford, England, June 1983 (commercial in confidence).
83.121 12 I 83.131 36
I
83.141 96I
83.1513i
I
83.461 3tI
83.541 12I
83.161 12I
TABLE 1FAILUR~ WIND SPEEUS ANU FAILURE MOUES FOR TESTEU CONFIGURATIONS
DESCRIPTION
45°lbare roof-pressure scan only
45°1bare roof-pressure scan only
45°1bare roof-pressure scan only
45°lbare roof-pressure scan only
45°,bare roof-pressure scan only
34°1bare roof-pressure scan only
45°,Fabric & Gravel:
- bonded membrane
ROOFING SYSTEM
UNDER TEST
PHOTO
- loose laid insul. boards - permeable fabric - 0.9 in gravel 70 ROOITOP-LEVEL GUST SPEED AT FAILURE 90 (mph) FAILURE MODE
~: continuous gravel scour as per Ref. 2; large bare patch eventually forms with boards
lifting under fabric.
F2: fabric peeled back from long edge of rooftop; 4 boards blown
off rooftop first row. ·- -- --
-83.201 96
83.211 12
r - .,
-
..-off rooftop from bare area;
also gravel scour at base of
downstream parapet.
ALL DIMENSIONS AND WIND SPEEDS ARE FULL-SCALE
TABL~ 1 (CDNT'D)
DESCRIPTION
45°1Fabric & Gravel:
- bonded membrane
ROOFING SYSTEM UNDER TEST
- loose laid insul. boards
- permeable fabric
- 0.9 in gravel - 48 pavers
45°1Fabric & Gravel:
- bonded membrane
- loose laid insul. boards
- permeable fab~ic
- 0.9 in gravel - 48 pavers strapped
(paver array modified during run - see photos)
(175) (a) 105 (b) 105 ROOFTOP-LEVEL GUST SPEED AT FAILURE (mph) FAILURE MODE
(180)
I
Fl: gravel scour near base ofdownstream paraPets; one board blown off rooftop
F2: two more boarffiblown off
rooftop; vigorous gravel scour near centre of rooftop.
Fl: gravel scour downstream of
b) 130
I
pavers (i ,8) for paver configu-ration (a); gravel scour down-stream of pavers (i,l2) for paver configuration (b).F2: large bare patch and
continuing scour downstream of pavers (i,l2) with boards
lifting up, but contained under
fabric; also scour adjacent to