HAL Id: hal-01091510
https://hal.archives-ouvertes.fr/hal-01091510
Submitted on 5 Dec 2014
HAL is a multi-disciplinary open access archive for the deposit and dissemination of sci-entific research documents, whether they are pub-lished or not. The documents may come from
L’archive ouverte pluridisciplinaire HAL, est destinée au dépôt et à la diffusion de documents scientifiques de niveau recherche, publiés ou non, émanant des établissements d’enseignement et de
STED-SPIM made simple
Teodora Scheul, Irène Wang, Jean-Claude Vial
To cite this version:
Teodora Scheul, Irène Wang, Jean-Claude Vial. STED-SPIM made simple. Optics Express, Optical Society of America - OSA Publishing, 2014, 88, pp.163901 - 915. �10.1364/OE.22.030852�. �hal-01091510�
STED-SPIM made simple
Teodora Scheul, Irène Wang and Jean-Claude Vial* Univ. Grenoble 1 / CNRS, LIPhy UMR 5588, F-38041 Grenoble, France
Abstract: We report the development of a stimulated emission depletion (STED) selective plane illumination (SPIM) microscope based on a single diode-pumped solid state (DPSS) laser that simultaneously delivers nanosecond-pulses at two wavelengths. The two wavelengths, 355 nm and 532 nm, are generated by harmonic conversion and they are used to induce respectively excitation and stimulated emission depletion. This source should allow a low-cost, compact, very efficient and simplified STED scheme since the two beams are intrinsically aligned and synchronized. Using a chromatic beam shaping device which leaves the excitation beam unaffected and produces a donut-shaped STED beam, we demonstrate a 300% reduction of the light sheet thickness, together with an enhancement of the sheet uniformity over larger field of view, at low STED power, in Coumarin dye solution.
©2014 Optical Society of America
OCIS codes: (180.2520) Fluorescence microscopy; (180.0180) Microscopy.
References and links
1. S. W. Hell and J. Wichmann, “Breaking the diffraction resolution limit by stimulated emission: stimulated-emission-depletion fluorescence microscopy,” Opt. Lett. 19(11), 780–782 (1994).
2. M. Dyba and S. W. Hell, “Focal spots of size λ/23 open up far-field fluorescence microscopy at 33 nm axial resolution,” Phys. Rev. Lett. 88(16), 163901 (2002).
3. K. I. Willig, B. Harke, R. Medda, and S. W. Hell, “STED microscopy with continuous wave beams,” Nat. Methods 4(11), 915–918 (2007).
4. V. Westphal, C. M. Blanca, M. Dyba, L. Kastrup, and S. W. Hell, “Laser-diode-stimulated emission depletion microscopy,” Appl. Phys. Lett. 82(18), 3125–3127 (2003).
5. G. Moneron, R. Medda, B. Hein, A. Giske, V. Westphal, and S. W. Hell, “Fast STED microscopy with continuous wave fiber lasers,” Opt. Express 18(2), 1302–1309 (2010).
6. D. Wildanger, E. Rittweger, L. Kastrup, and S. W. Hell, “STED microscopy with a supercontinuum laser source,” Opt. Express 16(13), 9614–9621 (2008).
7. P. J. Verveer, J. Swoger, F. Pampaloni, K. Greger, M. Marcello, and E. H. Stelzer, “High-resolution three-dimensional imaging of large specimens with light sheet-based microscopy,” Nat. Methods 4(4), 311–313 (2007).
8. T. A. Planchon, L. Gao, D. E. Milkie, M. W. Davidson, J. A. Galbraith, C. G. Galbraith, and E. Betzig, “Rapid three-dimensional isotropic imaging of living cells using Bessel beam plane illumination,” Nat. Methods 8(5), 417–423 (2011).
9. F. O. Fahrbach, V. Gurchenkov, K. Alessandri, P. Nassoy, and A. Rohrbach, “Self-reconstructing sectioned Bessel beams offer submicron optical sectioning for large fields of view in light-sheet microscopy,” Opt. Express
21(9), 11425–11440 (2013).
10. T. Vettenburg, H. I. Dalgarno, J. Nylk, C. Coll-Lladó, D. E. Ferrier, T. Čižmár, F. J. Gunn-Moore, and K. Dholakia, “Light-sheet microscopy using an Airy beam,” Nat. Methods 11(5), 541–544 (2014).
11. M. Friedrich, Q. Gan, V. Ermolayev, and G. S. Harms, “STED-SPIM: Stimulated emission depletion improves sheet illumination microscopy resolution,” Biophys. J. 100(8), L43–L45 (2011).
12. P. Zhang, P. M. Goodwin, and J. H. Werner, “Fast, super resolution imaging via Bessel-beam stimulated emission depletion microscopy,” Opt. Express 22(10), 12398–12409 (2014).
13. G. Donnert, C. Eggeling, and S. W. Hell, “Major signal increase in fluorescence microscopy through dark-state relaxation,” Nat. Methods 4(1), 81–86 (2007).
14. T. A. Klar, S. Jakobs, M. Dyba, A. Egner, and S. W. Hell, “Fluorescence microscopy with diffraction resolution barrier broken by stimulated emission,” Proc. Natl. Acad. Sci. U.S.A. 97(15), 8206–8210 (2000).
15. G. Donnert, J. Keller, R. Medda, M. A. Andrei, S. O. Rizzoli, R. Lührmann, R. Jahn, C. Eggeling, and S. W. Hell, “Macromolecular-scale resolution in biological fluorescence microscopy,” Proc. Natl. Acad. Sci. U.S.A.
103(31), 11440–11445 (2006).
16. M. Dyba, J. Keller, and S. W. Hell, “Phase filter enhanced STED-4pi fluorescence microscopy: theory and experiment,” New J. Phys. 7, 134 (2005).
17. L. Fulbert, J. Marty, B. Ferrand, and E. Molva, “Passively Q-switched monolithic microchip laser,” in Proc. of
Conference on Laser and Electro Optics, vol. 15, paper CWC5 (Optical Society of America, Washington D.C.,
1995), p. 176.
18. N. Pollak, C. Dölle, and M. Ziegler, “The power to reduce: pyridine nucleotides - small molecules with a multitude of functions,” Biochem. J. 402(2), 205–218 (2007).
19. E. Cheng, R. Lane, J. W. L. Nighan, A. B. Petersen, J.-W. Pieterse, and C. Pohalski, “Q-switched laser system providing UV light,” US Patent # US 5835513 A (1998)
20. B. Boulanger, M. M. Fejer, R. Blachman, and P. F. Bordui, “Study of KTiOPO gray-tracking at 1064, 532, and 355 nm,” Appl. Phys. Lett. 65(19), 2401–2403 (1994).
21. M. Leutenegger, C. Eggeling, and S. W. Hell, “Analytical description of STED microscopy performance,” Opt. Express 18(25), 26417–26429 (2010).
22. M. Reuss, J. Engelhardt, and S. W. Hell, “Birefringent device converts a standard scanning microscope into a STED microscope that also maps molecular orientation,” Opt. Express 18(2), 1049–1058 (2010).
23. E. Schimitschek, J. Trias, P. Hammond, and R. Atkins, “Laser performance and stability of fluorinated coumarin dyes,” Opt. Commun. 11(4), 352–355 (1974).
24. M. R. Kasimova, J. Grigiene, K. Krab, P. H. Hagedorn, H. Flyvbjerg, P. E. Andersen, and I. M. Møller, “The free NADH concentration is kept constant in plant mitochondria under different metabolic conditions,” Plant Cell 18(3), 688–698 (2006).
25. M. C. Skala, K. M. Riching, A. Gendron-Fitzpatrick, J. Eickhoff, K. W. Eliceiri, J. G. White, and N. Ramanujam, “In vivo multiphoton microscopy of NADH and FAD redox states, fluorescence lifetimes, and cellular morphology in precancerous epithelia,” Proc. Natl. Acad. Sci. U.S.A. 104(49), 19494–19499 (2007). 26. J. R. Lakowicz, H. Szmacinski, K. Nowaczyk, and M. L. Johnson, “Fluorescence lifetime imaging of free and
protein-bound NADH,” Proc. Natl. Acad. Sci. U.S.A. 89(4), 1271–1275 (1992).
27. G. Vicidomini, G. Moneron, K. Y. Han, V. Westphal, H. Ta, M. Reuss, J. Engelhardt, C. Eggeling, and S. W. Hell, “Sharper low-power STED nanoscopy by time gating,” Nat. Methods 8(7), 571–573 (2011).
28. P. Török and P. R. T. Munro, “The use of Gauss-Laguerre vector beams in STED microscopy,” Opt. Express
12(15), 3605–3617 (2004).
29. B. Harke, J. Keller, C. K. Ullal, V. Westphal, A. Schönle, and S. W. Hell, “Resolution scaling in STED microscopy,” Opt. Express 16(6), 4154–4162 (2008).
1. Introduction
Fluorescence microscopy is a basic tool for imaging cells and tissues. However, its lateral spatial resolution is limited to approximately half the wavelength of light (200 to 300nm) due to diffraction laws. Stimulated emission depletion (STED) is one of the emerging superresolution techniques that have made it possible to overcome this barrier [1]. In a typical STED microscope, the excitation beam is superimposed with a donut-shaped STED beam which induces stimulated emission from the excited state of the fluorophore, thereby causing its population to be depleted. Therefore, the fluorophores in the periphery of the focal spot are kept in a dark state which reduces the size of the point spread function.
Although STED microscopy has reached resolutions down to a few tens of nanometers [2], its experimental implementation remains complex, since two beams, generally from different sources have to be coupled into the microscope and perfectly aligned. Moreover, if pulsed lasers are used, additional electronic devices are needed to synchronize the pulses from both sources. It is to be noted that no synchronization is required when continuous wave (CW) lasers are used. Nevertheless it has been shown that CW depletion is less efficient [3], so that a higher average power is required to achieve depletion. This is not desirable, since photobleaching and phototoxicity are critical issues in STED microscopy especially when imaging biological samples. STED has been demonstrated with Ti:Sa femtosecond lasers, pulsed laser diodes [4], fiber lasers [5] and supercontinuum laser [6]. However, the excitation and STED beams take different paths and have to be combined before entering the objective. This critical alignment makes the microscope performance sensitive to any drift in the optical setup, such as temperature variations. Therefore, we believe that a laser source providing two wavelengths, which are intrinsically aligned, would be an interesting alternative for STED.
Selective Plane Illumination Microscopy (SPIM), combined with fluorescence detection (also called Light Sheet Fluorescence Microscopy LSFM) has recently aroused a lot of interest due to its good sectioning capabilities and its low toxicity in living samples [7]. Indeed, only a thin slice of the sample is illuminated and the fluorescence image is acquired in the perpendicular direction. To create the illumination sheet, a laser beam is focused in only one direction using a cylindrical lens or scanned in one direction after it is focused with a regular spherical lens. One important limitation of this method is the difficulty to have
simultaneously a thin sheet and a large field of view. This is simply because, for a focused Gaussian beam, a narrow beam waist is associated to a short Rayleigh length. A partial solution to this problem has been found in the use of Bessel and Airy beams [8–10]. However, in these approaches, the side rings of the Bessel beam cause image blurring. It is possible to solve this problem by using two photon excitation [8], this solution required costly lasers and a complex microscope.
Recently it has been suggested that the STED principle can be integrated in Selective Plane Imaging Microscopy (SPIM) [11,12], in order to enhance axial resolution while maintaining a large field of view. However, up to now, no convincing experimental results have been reported. Friedrich et al. [11] report a 60% resolution improvement. This modest improvement is probably due to the mode of depletion by femtosecond pulses which is not efficient enough at the maximum energy per pulse that can be attained.
The present work aims at demonstrating the efficiency of a STED-SPIM based on a single laser which delivers both the excitation and the STED beams. Our source is a Q-switched Nd-YAG microchip laser, which is both compact and low-cost, and the sub-nanosecond pulses at two wavelengths (355 nm and 532 nm) are produced by harmonic generation. These two wavelengths have the advantage of being intrinsically synchronized and collinear since they are generated from the same fundamental beam, which greatly simplifies the optical setup and electronic apparatus. Moreover the temporal characteristics (sub-nanosecond pulse duration and 20 kHz repetition rate) are particularly well-suited to STED microscopy since they allow efficient depletion of organic dyes while minimizing photobleaching [13]
First, we present the main characteristics of our laser system and its advantages for STED microscopy. Then, the suitability of this laser for STED is confirmed in dye solutions and a method to experimentally measure the depletion efficiency at 532 nm is proposed and applied to several fluorophores. The final section is devoted to the description of a STED-SPIM prototype with preliminary results obtained in dye solutions.
2. A single laser for excitation and stimulation 2.1 Basic requirements
One objective of this work is the development of a laser that delivers both excitation and stimulated emission. The idea is to start from a single laser which is subsequently frequency doubled (by second harmonic generation) and tripled (by sum-frequency generation) using non-linear crystals. The wavelengths created by frequency doubling and sum-frequency generation are respectively used for fluorescence depletion and excitation. This approach has several advantages. One requirement for STED experiment is that the excitation and STED beam should perfectly overlap at the focus of the microscope. By using harmonic generation, the STED beam contributes to producing the excitation beam, which ensures that they are collinear and that their waists are virtually at the same position. Moreover, in this approach, the excitation and STED pulses are necessarily synchronized in time since one is generated from the other. In addition the harmonic generation can be considered as instantaneous at the scale of the photophysical processes involved in the dyes and the delay between the pulses can be neglected.
Most pulsed STED setups use a Ti:Sapphire oscillator which has a high repetition rate (80 MHz) and are relatively expensive and bulky. In addition, femtosecond regime, which exhibits hight peak power, generates multiphoton transitions on endogeneous and exhogeneous chromophors. To avoid this unwanted background, the pulses can be stretched, but it complicates the optical design [14]. It has been shown that lower repetition rates are advantageous for two reasons. First, inter-pulse duration longer than 1 μs allows triplet state population to relax to the fundamental state. Thus photobleaching is reduced and the total fluorophore emission is increased [15]. Second, at constant average power, the pulse energy is higher for low repetition rates, which induces more efficient STED. Indeed, in many cases, fluorescence inhibition essentially scales with the total photon fluence of the STED pulse [16].
For these reasons, diode pumped solid state (DPSS) lasers, also called microchip lasers, based on passively Q-Switched Nd:YAG appear as interesting alternatives. Such laser sources have the advantage of being robust, very compact and low cost, so that they have become popular for a number of applications. They have a high beam quality (with a M2 close to 1
[17]), which is important for microscopy applications, since a clean wavefront is required to obtain a small point spread function (PSF) after the objective. In this work, we explore the possibility to build a simple, cost-effective STED-SPIM microscope based on this source.
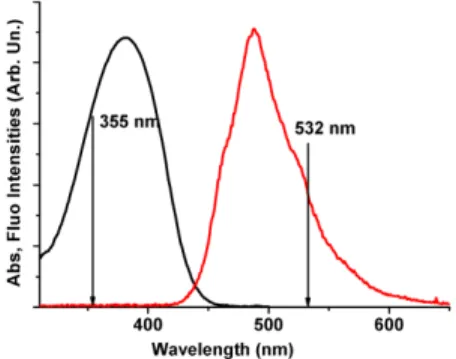
Fig. 1. Normalized absorption and emission spectra of Coumarin 490 with laser wavelengths for excitation and stimulation.
The laser used in this work emits sub-nanosecond pulses of 1.06 μm radiation at a repetition rate of 20 kHz. The temporal characteristics are well-suited to STED microscopy: the pulse width (0.8 ns) is matched with the excited state lifetime, so that no STED power is wasted while the dye is idle and the duration between pulses of 50 μs allows triplet relaxation. By second harmonic (SHG) and sum frequency generation (SFG), the 1.06 μm fundamental radiation can produce beams at 532 and 355 nm for STED and excitation, respectively. A number of blue fluorophores have spectral properties matched to the wavelengths delivered by this system (355 nm for excitation and 532 nm for stimulation) such as Coumarin 490 shown on Fig. 1. A compound of particular biological interest in this spectral range is the coenzyme NADH [18], since this endogenous molecule has essential roles in cell metabolism and is frequently imaged with 350 nm-excitation.
2.2 Practical implementation
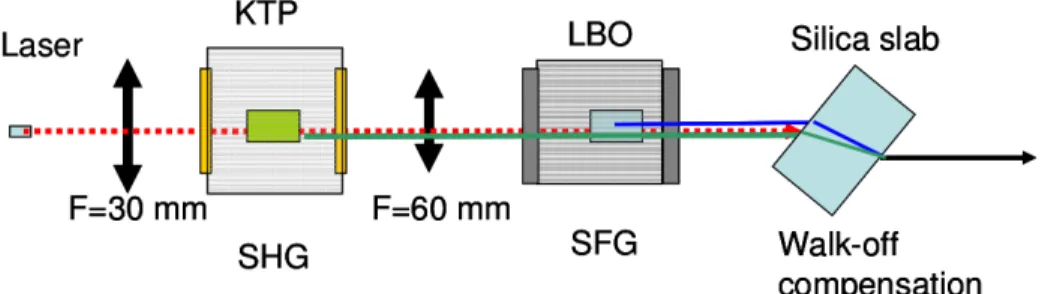
In commercial lasers providing 355 nm light, a slight shift between 532 nm and 355 nm beams is usually observed [19], because of the beam spatial walk-off inside non-linear crystals. In many cases, this effect is neglected since it maintains the two beams parallel and only shifts the propagation axis of the Gaussian beams. But in our case, the two beams, when injected in a lens with a slight longitudinal chromatic aberration, will induce a lateral mismatch near the focal point and prevent a perfect stimulation by the donut-shaped beam. Moreover the walk-off would also lead to a degradation of the beam spatial quality by making it elongated. In order to limit the walk-off effect, we have built a tandem for SHG and THG as shown on Fig. 2 which maintains beam quality and alignment. To achieve this goal, the idea is to be as close as possible to non-critical phase matching and use moderate focusing inside the non-linear crystals.
Fig. 2. Harmonic generation by a KTP-LBO tandem. The dotted red line represents the 1.06 μm beam, the green and the blue lines respectively the 532 and 355 nm beams. Crystals are embedded in hermetic boxes to protect them from humidity. For the SHG box, the front window is a half-wave plate at 1.06 μm to rotate the polarization to maximize the SHG efficiency on the KTP type II crystal, the back window is a half-wave plate at 1.06 μm and wave at 532 nm to make the polarizations of both wavelengths parallel and favor SFG conversion. The walk-off compensation is obtained by a 5 mm-thick silica slab approximately at Brewster incidence.
Our setup is based on a DPSS self-Q-switched Nd:YAG laser (TEEM-Photonics, Meylan, France) delivering 7 μJ nanosecond pulses at a rate of 20 kHz corresponding to 140 mW of average power. The beam waist inside the laser crystal was estimated to be 50 μm. For the SHG non-linear crystal, instead of Lithium Triborate (LBO), usually used in commercial systems, we have employed a Potassium Titanyl Phosphate (KTP) crystal (EKSMA-Optics, Vilnius, Lithuania), with a moderate focusing of the fundamental beam in order to minimize the “gray tracking” effect [20]. The crystal was cut for Type II excitation (Θ = 90 and φ = 23.5). This phase-matching condition has the advantage of being very close to non-critical phase matching at room temperature, while still keeping a good conversion efficiency. With a 1 cm-crystal length and a 330 μm fundamental beam waist we obtained 20 mW of 532 nm Gaussian beam. The walk-off between the fundamental and the SHG beams is virtually undetectable. To perform SFG by mixing the fundamental and the SHG beams, non-critical phase matching conditions cannot be reached. In addition the choice of commercially available crystals is very limited, so we used a 1 cm-long Type II LBO crystal (Θ = 42.2 and φ = 90) and we focused the fundamental beam to a 100 μm waist. The beam at 355 nm has a power of 2 mW with a near Gaussian profile (M2 = 1.1), while the 532 nm beam is unaffected
in power, profile and polarization. Unfortunately this crystal introduces a small lateral shift between the 355 and the 532 nm beams, due to walk-off, of approximately 40 μm which is enough to prevent the two colors from perfectly overlapping in the objective focal plane. Hopefully, the large difference of wavelengths between the two beams and the spectral dispersion of refractive index of the silica allow the compensation of the lateral shift by a simple silica slab as shown in Fig. 2. It is easy to calculate that, at Brewster incidence, a 5 mm-thick slab is enough to compensate the 40 μm lateral shift between the 532 and 355 nm beams.
Finally, the laser system we built delivers 532 nm and 355 nm pulses of durations around 700 ps and 600 ps respectively, which are temporally synchronized and spatially merged. 2.3 An efficient source for excitation and stimulation
Our 20 kHz sub-nanosecond laser delivers an energy per pulse that is 4 orders of magnitude higher than that produced by a 80 MHz laser system (typical Ti:Sa oscillator), at the same average power. Therefore, our laser source would have the advantage of inflicting less photodamage to attain a given STED efficiency. In section 4.1, we show that relatively low average intensities can induce significant fluorescence depletion. In applications where the laser repetition rate does not limit the acquisition speed such as SPIM imaging, our lasers are far more advantageous for STED than femtosecond or CW lasers [3]. Nevertheless our pulsed bicolor laser system has the particularity to deliver temporally merged excitation and
stimulation beams. Therefore the depletion efficiency should not depend exponentially on the STED intensity as considered in many articles because the exponential law is valid when the STED pulse is short compared to the excited-state lifetime and occurs after the end of the excitation pulse [1] which is the most common case when using femtosecond lasers. Our case is similar to the CW STED since the pulse duration is long enough (compared to the spontaneous decay time) to be seen as continuous stimulation by the fluorophore. In this situation the exponentially dependent depletion efficiency has to be replaced by an hyperbolic law [21]:
1
1+σISTEDτ
(1) Where σ is the stimulated emission cross-section, τ the excited lifetime and ISTED the
instantaneous STED intensity. This expression can be written in the following form 1
1+ISTED/Isat (2)
Where Isat, usually named saturation intensity, is the STED intensity resulting in the inhibition of half the initial fluorescence emission.
Expression (1) shows the advantage of the depletion by a nanosecond laser: to obtain the same depletion efficiency in CW STED, the average power would need to be as high as the instantaneous power in the pulse. The ratio of instantaneous to the average power is expressed as 1/(fΔt) (with Δt the pulse duration and f the repetition rate) which is around 104 for our
laser
3. STED-SPIM setup
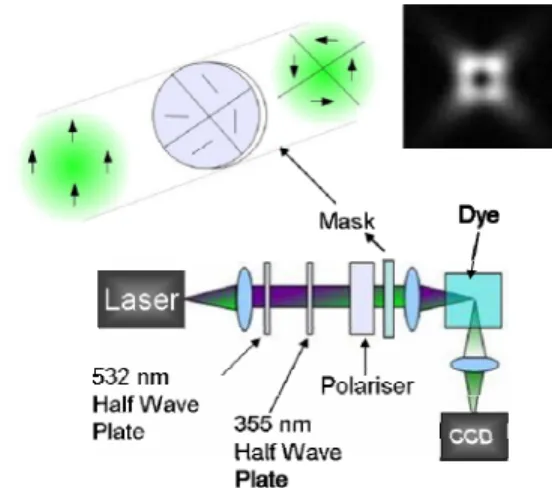
The experimental setup is presented in Fig. 3. The output of the laser system is incident on a near-UV achromat of 12.5 mm focal length (Edmund Optics, York, UK) which focuses the beam into a spectrometer cell containing a dye solution. The power at 355 nm and 532 nm are controlled independently using dual wavelength wave plates followed by a polarizer. The first birefringent plate is half-wave at 355 nm (a retardation of λ/2 is introduced between the two axis) and wave at 532 nm (the retardation is multiple of λ), so that it rotates only the 355 nm light, whereas the second has a λ/2 retardation at 532 nm while it does not affect the 355 nm beam.The fluorescence emitted in the dye solution at 90° from the laser propagation direction was imaged through a macroscope (SZX12 Olympus) and recorded by a CCD camera. Power calibration measurements were performed by splitting the two wavelengths by a glass prism and separately focusing each beam on a calibrated photodiode. The excitation (355 nm) power is kept very low (in the μW range) to avoid saturating the singlet transition.
In this layout, we kept the two wavelengths merged along the whole optical path to preserve their intrinsic alignment. However, the STED beam is to display a dark center, while the excitation beam should remain Gaussian. Therefore, we used a beam shaping device which leaves the excitation beam unaffected and changes the polarization of the STED beam [22]. This device is based on chromatic waveplates (λ/2 for 532 nm and λ for 355 nm): four segments of such a waveplate are assembled in a star-like configuration, so that, with circularly polarized incident light, the polarization of the output beam is a combination of radial and azimuthal polarizations.
Fig. 3. Experimental setup for measuring the STED SPIM efficiency of various dyes. The assembly of two waveplates at 532 and 355 nm with a broadband polarizer permits the modification of the power for the two colors independently. The upper part of the figure shows the detail of the beam shaping device with a typical beam shape on the far field of the 532 nm beam.
For depletion measurements in solution (section 4.1), the same setup was used but the beam shaping device was removed, so that 355 nm and 532 nm beams overlap in the dye solution.
4. Results and discussion
4.1. STED efficiency measured in dye solution
In this section, we demonstrate that our laser is well-suited for STED by measuring fluorescence depletion at low average intensity in dye solutions. We also propose a method to estimate the stimulated emission efficiency of different fluorophores.
The experimental setup is the one shown in Fig. 3 without the segmented waveplate. The excitation beam generates a fluorescence trace in the solution which is imaged by the CCD camera. Such images are acquired at various STED (532 nm) power. The fluorescence profile, along the propagation direction, integrated over the full width of the beam is extracted from the images.
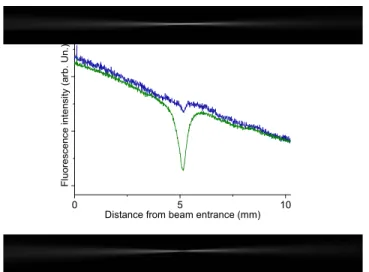
Figure 4 presents the fluorescence trace in a solution of Coumarin 490 in ethanol. Coumarin 490 is a common laser dye for blue operation [23]. Its absorption and emission spectra match the two operating wavelengths (as shown on Fig. 1). When only the excitation beam at 355 nm is present, the profile is slowly decaying, since the laser beam is attenuated by absorption in the dye solution. When the 532 nm beam is unblocked, a sharp hole appears in the fluorescence image at the position of the beam waist as shown on the CCD image and the profile reveals a dip corresponding to a strong extinction, at low STED average power (1 mW). This confirms that our laser source is capable of efficient fluorescent inhibition by stimulated emission.
0 5 10 F luo res cen ce in ten sit y (a rb. U n .)
Distance from beam entrance (mm)
Fig. 4. Images of the fluorescence trace when focusing into a solution of Coumarin 490 in ethanol with a 355 nm beam (top) and both 355 nm and 532 nm beams (bottom), at average powers of 1µw and 1mW respectively. The integrated profiles extracted from these images (center) show a strong fluorescence extinction at the focal point. The dip in the fluorescence near the waist of the 355 nm beam comes from a small bleaching of the dye which disappears by steering the solution.
The analysis of the fluorescence profile along the propagation direction provides a means to estimate the stimulated emission efficiency of fluorophores by 532 nm pulses, or more precisely the (time-averaged) saturation intensity Isat, which is by definition the STED
intensity that inhibits half of the fluorescence emission. The value of Isat indicates the ability
of a molecule to be depleted efficiently with our laser: it takes into account the stimulated emission cross section at 532 nm, as well as temporal properties such as how well the pulse duration matches the excited state lifetime.
4.2. Fit of the fluorescence profiles recorded in dye solution
To evaluate and compare the ability of these fluorophores to be stimulated at 532 nm, the fluorescence profiles recorded at varying 532 nm power were fitted with a simple formula that we derive hereafter. For the sake of simplicity, the excitation and STED beams are assumed to be similar to a Gaussian beam along the propagation axis (with the waist varying as a Lorentzian function) but to have a top-hat intensity distribution in a plane perpendicular to this axis. Therefore, at distance z from the focus, the intensity distribution is a homogeneous disk of radius w(z): 1/ 2 2 2 ( ) R 1 R Z z w z Z λ π = + (3)
with λ the wavelength and ZR the Rayleigh length. In this disk, the intensity I(z) is constant and related to the power P of the beam by
2 2 ( ) 1 R R P I z z Z Z λ = + (4)
The fluorescence emission is proportional to the excitation intensity Iexc times the depletion factor. This factor is the classic exponential law when the depletion pulse arrives later than the excitation pulse but becomes a hyperbolic law (2) when the pulses are simultaneous (or when
excitation and depletion are CW). So the fluorescence signal F at position z is, with Isat the saturation intensity (averaged over time):
1 ( ) ( ) 1 ( ) / exc STED sat F z I z I z I ∝ + (5)
Here we assumed that the STED beam completely covers the excitation beam, which is possible for a perfect alignment: if the waist size for 355 nm and 532 nm are similar (this is expected in the LBO crystal), the 532 nm beam would be more divergent than the 355 nm beam, since Gaussian beam divergence scales with the wavelength, so that it can completely cover the 355 nm beam.
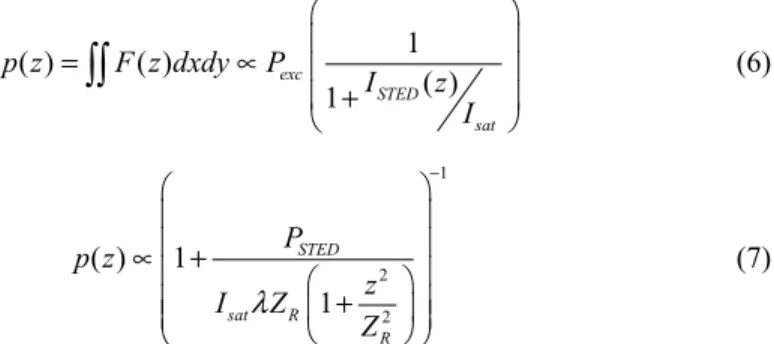
Due to the depth of field of the macroscope which is large compared to the beam width, the fluorescence trace observed on the CCD is a sum of all the planes across the beam width. The fluorescence profile is obtained by drawing a rectangle around this trace and integrating the pixel values in each column. Therefore the profile p(z) is given by the fluorescence emission integrated over a whole xy section:
1 ( ) ( ) ( ) 1 exc STED sat p z F z dxdy P I z I = ∝ +
(6) 1 2 2 ( ) 1 1 STED sat R R P p z z I Z Z λ − ∝ + + (7)with PSTED the average power at 532 nm and ZR the 532 nm beam Rayleigh range. Therefore the fitting function adapted to our data is
(
1 / 1(
2/ 2)
)
1R z Z
γ −
+ + with γ =
PSTED/(λZRIsat)−1 and the only parameter used to fit the curves is γ. The fitting curves shown in Fig. 5(a) successfully accounts for the growth and widening of the depletion dip as the 532 nm power increases. As depicted in Fig. 5(b), the estimated values of γ vary linearly with the STED power, in agreement with our model. The slope of this line yields the saturation intensity Isat for the specific compound. This method allows the comparison of different
compounds in a concentration-independent manner.
Fig. 5. Measurement of depletion efficiency in solution: (a) Normalized fluorescence profiles obtained in a Coumarin 490 solution in ethanol at different STED powers. The fit (solid black line) yields the value of γ according to the expression in the text. (b) Plot of the parameter γ obtained from the fits as a function of the STED power.
A number of common dyes have suitable spectral properties for the 355 nm/532 nm wavelengths pair. Examples include laser dyes especially from the Coumarin family and Hoechst dyes which are widely used to stain nucleus in live or fixed cells since they are cell-permeable and bind to DNA. Another compound of biological significance and possessing the adequate spectra is the reduced coenzyme NADH which is naturally present in all living cells. Fluorescence microscopy is widely used to characterize this coenzyme (oxidized or reduced, free or bound to proteins) as an indicator of the metabolic state of cells and tissues [24,25].
The values of Isat we obtained with Coumarin 490, Hoechst 3342 and NADH are shown in
Table 1. Unsurprisingly NADH is less efficient than the other fluorophores which are quite similar. One possible reason is the high rate of non-radiative decay in NADH, resulting in an excited-state lifetime of only 0.4 ns [26]. Since our pulse duration is around 0.7 ns, only a fraction of the STED pulse energy is useful for depletion, so that the power has to be increased to obtain the same depletion effect.
Table 1. Experimental time-averaged saturation intensity for stimulation obtained with different compounds.
Compound Isatin kW/cm2
Coumarin 490 1.2 Hoechst 3342 1.3
NADH 2.3
It is interesting to note that the values measured for Isat are around 1 kW/cm2, when this
same quantity is in the MW/cm2 range when using CW lasers for depletion [27]. The average
power required for fluorescence inhibition is reduced by 3 orders of magnitude. This confirms the interest of our laser source for STED, since its temporal properties would allow efficient stimulation while minimizing photobleaching.
4.3. STED-SPIM improves axial resolution and expands the field of view
Now we investigate the potential of our concept to improve SPIM resolution. Since we do not aim at performing imaging, the excitation-depletion processes are induced in a uniform distribution of fluorescence emitters, i.e. a Coumarin 490 dye solution and the beam is not scanned. The thickness of the light sheet can be obtained by simply measuring the width of the fluorescence traces. The setup of Fig. 3 is used with the four quadrant chromatic waveplate inserted. We examined the fluorescence traces induced by the UV laser beam with and without the overlapping donut-shaped 532 nm beam.
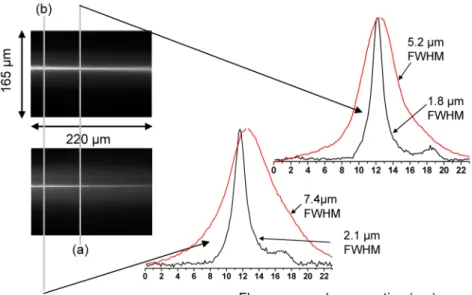
Figure 6 shows typical images of the fluorescence traces induced either by the excitation beam alone and by the excitation beam combined with the donut-shaped STED beam. An important remark is to be made. The incident converging beam has to cross interfaces between air and the spectrometer cell, which is made of glass, and into the ethanol solution. Due to the refractive index mismatch between these media, a substantial amount of spherical aberration is present in the beams. This is responsible for the asymmetric aspect of the fluorescence excited by the 355 nm beam along the propagation axis as seen in Fig. 7. Also, the FWHM waist of the UV trace is close to 5 µm, which is somewhat higher than the value expected for a 355 nm beam focused by a 0.1 NA lens. However, as we show in the following, the presence of spherical aberration is not necessarily a disadvantage in STED-SPIM microscopy.
Fig. 6. Images of the fluorescence trace in a spectrometer cell filled with a Coumarin 490 dye solution in ethanol, top with the 355 nm beam alone and bottom with donut shaped 532 nm beam added. The laser is focused by a F = 25 mm UV-Vis achromat with a numerical aperture NA~0.1. On the right: the profile plot of the images (with 1µW UV excitation alone in red and with 4 mW stimulation depletion in black) taken at distances of 40 µm (position a) and 100 µm (position b) from the UV beam waist.
First, the beam stays narrow over a longer distance, which extents the SPIM field of view. In our case, the beam width stays below 21/2ω
0 (1.4 times the waist) over a distance of 80 µm.
This is much more than the expected Rayleigh length for a perfectly focused Gaussian beam. Therefore, this distance shall be named “pseudo-Rayleigh length”. This effect can be seen in Fig. 7. Moreover, the dark hole in the center of the STED beam was shown to be mostly unaffected by spherical aberration, if a suitable shaping device is used [28]
The fluorescence trace, depicted in Fig. 6, obtained when the donut shaped 532 nm beam is superimposed on the excitation beam, show a strong reduction of the waist size, i.e. a thinner light sheet. The value of 1.8 µm FWHM can be measured on the image profile, which corresponds to a resolution improvement by factor of 3 compared to the non stimulated trace. This is much more than the 60% reduction reported in ref [11].
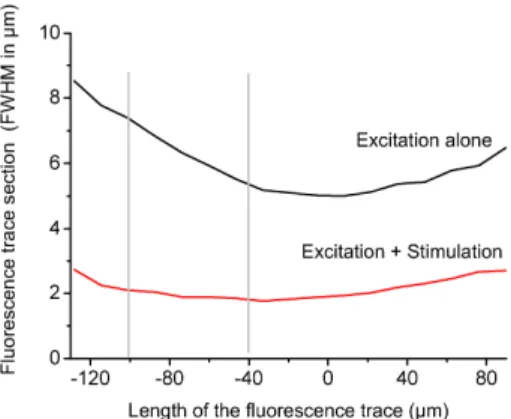
Figure 7 shows the variation of the fluorescence trace width (FWHM) along the propagation direction. Interestingly, the STED effect leads to a reduction of the waist size that is not associated with a shortening of the pseudo Rayleigh length, as with Gaussian beams. On the contrary, we observe an increase of this length: a quasi constant trace section is registered over 220 µm. This is due to the small divergence of the dark hole at the center of the STED beam, which causes the fluorescence to be quenched over a long distance along the propagation direction. These results are very promising for SPIM since the field of view can be enlarged and made more uniform, while, at the same time, the axial resolution is enhanced. When, in conventional SPIM, a compromise has to be made between these two requirements, STED can solve this dilemma by improving both aspects of the light sheet.
Fig. 7. Measurement of the fluorescent traces width under UV excitation alone (in black) and with green stimulation (in red) deduced from the two images shown in Fig. 6. The origin of the abscissa is taken at the waist of the UV-alone excited fluorescent trace. The vertical bars show the positions where the curves of Fig. 6 are taken.
4.4. Is the reduction of the sheet thickness limited?
The above results are obtained with moderate STED power and simple achromatic doublet for focusing. Nevertheless they show an interesting axial sectioning capability (~2 µm) comparable to what can be obtained with a confocal microscope, while preserving a wide field of view. Now we address the question of how this sectioning varies with the STED power and what are the limiting factors when attempting to enhance the light sheet resolution.
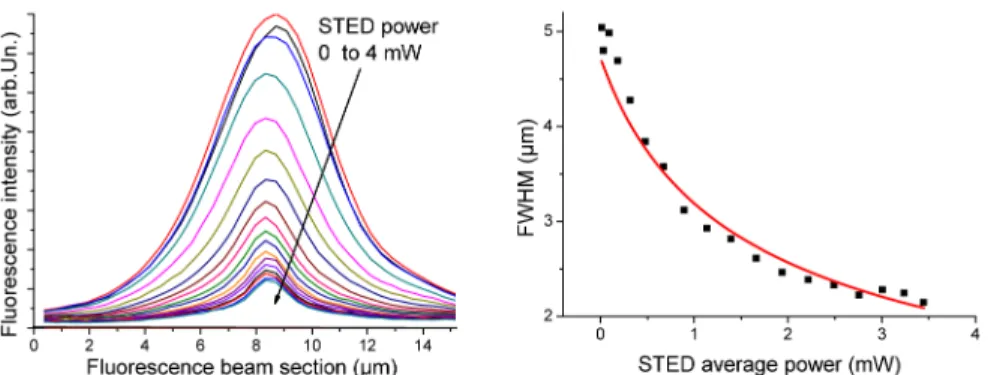
Fig. 8(a) shows the fluorescence profiles as a function of the STED power up to an average STED power of 4 mW. The focusing is moderate, the pump beam waist being 5 µm (FWHM). The evolution of the sheet thickness (measured by the FWHM of the fluorescence trace) is continuously decreasing as the STED power increases. Previous work [29] have predicted that the FWHM of the point spread function depends on the inverse square root of the STED intensity. In Fig. 8(b), we have plotted the FWHM of the profile as a function of STED power and fitted the points with an inverse square root function. We found a good agreement with this model. This result is encouraging, and we believe that highly resolved light sheets can be expected as soon as a higher STED intensity can be used.
Figure 8 (a) shows an attenuation of the fluorescence beam as the STED power increases. This problem is commonly observed in STED microscopy: some fluorescence depletion is present in the center of the beam, since the dark hole in the STED beam is not exactly zero. This would limit the resolution attainable with the system since high STED intensities could not be used. In our case, we believe it comes from identified defects in the phase masks: the four quadrants are not perfectly assembled which causes the STED intensity to not totally vanish at the center of the donut. We believe that improved phase masks need to be developed for STED-SPIM microscopy. These devices would have to produce a dark line instead of a dark hole.
Fig. 8. Fluorescence traces section at the beam waist position as a function of the average STED power. The pump and the STED lasers where focussed by a 2.5 cm lens with a ~0.1 numerical aperture. The pump beam and the detections conditions stay constant as the STED beam varies. The graph on the right is a plot of the reciprocal of the squared FWHM of the fluorescence traces
5. Conclusion
We have proposed a simplified STED scheme based on a DPSS microchip laser that simultaneously emits 355 nm and 532 nm sub-ns pulses, providing, respectively, excitation and STED beams which are intrinsically synchronized and aligned. The design of this source was optimized to preserve beam quality and minimize walk-off. The efficiency of this source for fluorescence inhibition is demonstrated by simply focusing the beam into a dye solution: in the presence of 532 nm light, a hole, denoting fluorescence quenching, appears at the beam focus. Measuring the fluorescence profile as a function of STED power affords a method to estimate the depletion performance of different compounds. The average intensity required for fluorescence depletion is reduced by 3 orders of magnitude when using our laser compared to CW lasers, confirming the interest of our laser source for STED, since its temporal properties allow efficient stimulation while minimizing photobleaching.
When coupling the two color lasers into a STED-SPIM microscope we obtain an important reduction of the fluorescent sheet thickness. Moreover, the superresolved sheets remain of uniform thickness over a larger area. A simultaneous improvement of both the sectioning resolution and the field of view is obtained. The latter advantage has never been reported before. We believe that the sheet thickness reduction by a factor of 300% for a moderate stimulation power (mW), compared with the 60% reduction, obtained with a much higher stimulation power, reported in Ref [11], is definitively a consequence of the efficiency of our dual-color nanosecond laser. Moreover, the experimental results show a continuous decrease of the sheet thickness with increasing STED power. Therefore, we expect superresolved sheets with much thinner dimensions by increasing the STED power and optimizing the beam shaping device.
Acknowledgments
This work has been partially funded by the Agence Nationale de la Recherche under the program. ANR-13-NANO-0004-01. Teodora Scheul acknowledges a doctoral fellowship from the Nanosciences Foundation (Grenoble, France). We thank the company TEEM-Photonics (Meylan, France) for the loan of a laser.