ISSN 1998-0124 CN 11-5974/O4 2019, 12(1): 000–000 https://doi.org/10.1007/s12274-020-2940-4 Re sea rc h A rt
New approach for time-resolved and dynamic investigations on
nanoparticles agglomeration
Neda Iranpour Anaraki1,2,3, Amin Sadeghpour1,4, Kamran Iranshahi4,5, Claudio Toncelli4, Urszula Cendrowska6,
Francesco Stellacci6, Alex Dommann1,7, Peter Wick2, and Antonia Neels1,3()
1 Center for X-ray Analytics, Empa, Swiss Federal Laboratories for Materials Science and Technology, St. Gallen 9014, Switzerland
2 Laboratory of Particles-Biology Interactions, Empa, Swiss Federal Laboratories for Materials Science and Technology, St. Gallen 9014,
Switzerland
3 Department of Chemistry, University of Fribourg, Chemin du Musée, Fribourg 1700, Switzerland
4 Laboratory for Biomimetic Membranes and Textiles, Empa, Swiss Federal Laboratories for Materials Science and Technology, St. Gallen
9014, Switzerland
5 Department of Environmental Systems Science, Swiss Federal Institute of Technology, ETH-Zurich, Zurich 8092, Switzerland 6 Institute of Materials, EPFL, Lausanne 1015, Switzerland
7 Cellular and Biomedical Sciences, Faculty of Medicine, University of Bern, Bern 3012, Switzerland
© The Author(s) 2020
Received: 13 April 2020 / Revised: 16 June 2020 / Accepted: 17 June 2020
ABSTRACT
Nanoparticle (NP) colloidal stability plays a crucial role in biomedical application not only for human and environmental safety but also for NP efficiency and functionality. NP agglomeration is considered as a possible process in monodispersed NP colloidal solutions, which drastically affects colloidal stability. This process is triggered by changes in the physicochemical properties of the surrounding media, such as ionic strength (IS), pH value, or presence of biomolecules. Despite different available characterization methods for nanoparticles (NPs), there is a lack of information about the underlying mechanisms at the early stage of dynamic behaviors, namely changing in NP size distribution and structure while placing them from a stable colloidal solution to a new media like biological fluids. In this study, an advanced in situ approach is presented that combines small angle X-ray scattering (SAXS) and microfluidics, allowing label-free, direct, time-resolved, and dynamic observations of the early stage of NP interaction/agglomeration initiated by environmental changes. It is shown for silica NPs that the presence of protein in the media enormously accelerates the NP agglomeration process compared to respective changes in IS and pH. High IS results in a staring agglomeration process after 40 min, though, in case of protein presence in media, this time decreased enormously to 48 s. These time scales show that this method is sensitive and precise in depicting the dynamics of fast and slow NP interactions in colloidal conditions and therefore supports understanding the colloidal stability of NPs in various media concluding in safe and efficient NP designing for various applications.
KEYWORDS
microfluidic small-angle X-ray scattering (SAXS), in situ, dynamic measurements, nanoparticle agglomeration, biological environment, label-free
1 Introduction
Colloidal stability is a crucial parameter in the efficacy and safety of colloidal nanoparticles (NPs) in various applications [1]. Minor changes in the physicochemical properties of NP media can have a tremendous influence on stability, and thereby can dominate NP functionality and effectiveness. Colloidal stability considerably matters in biomedical applications, namely NP-based imaging for diagnostics, drug or biomolecule delivery systems. In all of these applications, NPs are introduced into a complex biological environment containing electrolytes, proteins, and other biomolecules. In this new environment, several complex interactions and forces interfere with NPs, which, in consequence, might change their colloidal stability [2]. One of the most critical outcomes of changing in NP colloidal stability state in biological systems is NP agglomeration, which alters NP
size and size distribution consequently [3–8]. These changes result in different pharmacokinetics (e.g., uptake and fate) and pharmacodynamics (effects) of the NPs in vivo as well as
in vitro [9].
Despite many investigations on NP agglomeration and the effective parameters related to their stability [4, 10–12], there is a lack of information about the early stage of the dynamic behavior during the media changing from a stablecolloidal solution to a biological environment. Therefore, the precise label-free and non-disruptive monitoring of the early-stage of interactions, namely the agglomeration process, is an essential requirement for a better understanding of the underlying mechanisms concerning NP–NP interactions and their colloidal stability in various environments [13, 14]. Furthering the knowledge of NP stability in the biological environment can help in designing safer and more efficient NPs for biomedical
applications.
Different techniques can be used to measure NP size and size distributions, which include volume photon correlation spectroscopy (PCS), also known as dynamic light scattering (DLS) and NP tracking analysis (NTA). Other techniques allow for the direct observation of NPs, like scanning electron microscopy (SEM) and transmission electron microscopy (TEM). In this study, we have focused on small-angle X-ray scattering (SAXS), presenting several advantages over the above-mentioned analytical methods (Table 1) [15–19].
This study aims to systematically investigate the influence of different factors on NP agglomeration by changing the ionic strength (IS) and pH value of the NP environment, as well as the presence of protein. The chosen parameters are considered as the most influencing factors on NP agglomeration.
To achieve this goal, we selected silica NPs with a diameter of 25 nm as a model nanomaterial, because there are as well-defined and monodisperse silica NP colloids available. Also, they are easily detectable in SAXS and DLS, which are the two main methods in this study. They have a widespread usage, and are commonly studied in biological and environmental studies from
1 μg·mL–1 in biology to 200 mg·mL–1 in agriculture studies [20].
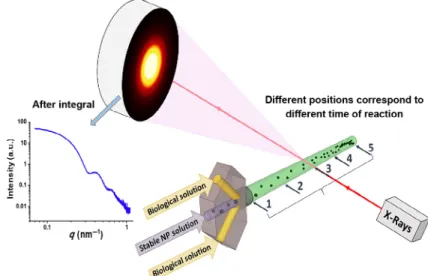
To be able to depict the early stage of NP agglomeration triggered by environmental changes, we developed a microfluidic mixing device followed by a quartz capillary allowing the investigation on the NP behavior in situ by SAXS (Fig. 1). Time-resolved DLS has been applied in parallel to cross-reference the results obtained by in situ SAXS analysis.
SAXS is a nondestructive technique where the elastic scattering of X-rays from the sample is recorded at very low angles (typically 0.1°–10° for copper Kα radiation) by a two-dimensional (2D) area detector. These data, after background subtraction, is used for further analysis [18, 21]. In SAXS, no special sample preparation is required, and the initial environment of the sample is not changed during the analysis as well as no labeling is required. Besides, a large volume can be probed for high statistics. The sample characterization is possible even for a low concentration of NP by increasing the exposure time and measuring duration. In NP biomedical applications, the final concentration in the human body is very low, and characterizing these low concentrations, for most of the methods, is an application-blocking limitation. However, it is needed for the
Table 1 Advantages and disadvantages of different techniques in measuring NP size and distribution [17, 18]
Method Advantages Disadvantages
DLS Simple sample preparation
Typically ± 1% precision
Short experiment duration: 1–2 min for the appropriate concentration of particles
Biased toward small or big particles based on the measurement angle
Only applicable for optically transparent samples Limitation for multicomponent and optically complex
aqueous matrices
Cannot be used for low particles concentrations (limit is different based on the optical properties of NP) Assumes spherical shaped particles
NTA o Ease of use
o Availability of information on individual particle counts o Dependency on the refractive index cannot be used for low particles concentrations SEM and
TEM
Topographical imaging Provides high-resolution data Crystallinity
Limited in terms of the analysis area; no volume investigation Not suitable for bulk measurements
Time-consuming and complicated sample preparation Destructive characterization method
SAXS o No sample preparation need, sample can be analyzed in their initial state
o Useful also for low concentration of particles
o Non-uniform samples and mixtures of interacting components can be analyzed
o High statistics by probing large sample volumes o Not sensitive to optical properties like transparency o Combinable with other technics like microfluidics, DLS,
and high performance liquid chromatography (HPLC)
o More time demanding if compared to other methods Limited application range due to the size of particles (roughly 1–100 nm)
Nano Research NP characterization method to reflect real conditions in the
human body as much as possible.
SAXS is a well-established characterization method to determine not only NP size but also their size distribution and shape. The final generated structural description is an average of all the NPs in the exposed volume of the sample over time. It is a great advantage of the SAXS method that colloidal systems can be investigated in real-time under their initial environment and nearly in any condition, which is an essential factor in colloidal stability research [18]. This method has been used for silica NP aggregating systems in a static state to observe the size and structural changes due to the changes in IS and humidity of the environment [22, 23]. However, dynamical studies concerning the early stage of NP agglomeration remained open. Here we show, for the first time, how these issues can be covered in detail by our novel research approach, which combines the SAXS method with microfluidics.
Microfluidics is an approach to observe dynamical processes like chemical reactions, biological assays, and NP agglomeration. Microfluidics operate with small amounts of fluids (nano to attoliters) under sub-millimeter confinement, making a non- turbulent or laminar-flow that leads to a predictable flow gradient concentration profile [24]. It is an available technology and a scientific tool for controlling the fluid flow, the mixing rate, and the processing time that offers continuous and precise monitoring of structural changes over time [25]. The com-bination of SAXS and microfluidics makes it possible to obtain structural information, especially about soft biomaterials and NPs with enhanced time-resolution capabilities [26], and to monitor at the same time flow conditions as observed in the body. Recently, SAXS-on-a-chip systems have been used in studies related to the synthesis and production of NPs or biological species and also for the evaluation of interface forces and interactions [27–30].
In this study, we investigate the early stage of NP agglomeration in different environments in comparison with the initial stable NP colloidal solution. Our research focuses on a new lab-based dynamical approach combining SAXS with microfluidics for in situ observations. We designed and developed this in situ method for time-resolved dynamical studies at the early stage of interaction between monodispersed NPs in agglomeration processes (Fig. 1). Compared to regular SAXS measurements, the advantage of this setup is the ability of dynamic measurements to monitor the ongoing process in situ and in real-time. This setup has the potential to be used for other complex reactions with different environments, also including NP synthesis.
This method can be utilized for a wide range of NPs, namely polymeric, metal, and metal oxides NPs, as well as various geometric shapes in any concentration. Although, the difference between electron density of particles and the surrounding media can be a limitation for desired concentration, this setup and the applied method are also compatible with synchrotron requirements. In the case of non-stable NPs, very low NP concentration or materials with low electron density giving weak X-ray scattering signals, the use of synchrotron radiation is a better choice compared to lab-based SAXS concerning time resolution. Equally, for very fast reactions, changes in less than a second are not reachable using current lab-based SAXS equipment. In general, the type of mixer and the measurement time determines the temporal resolution for this method. In this study, a continuous mixer is used, and the time resolution depends on the flow speed and beam size neglecting flow effects (e.g., slower flow at the edge of the capillary and faster in the center) [31]. Our time-resolved SAXS results are
compared with time-resolved DLS and electron microscopy experiments.
2 Experiments
2.1 Silica NPSilica (SiO2) nanoparticle colloidal solution was supplied free
of charge from Klebosol® (1 Rue du Flottage, 60350 Trosly- Breuil, France). The particles are amorphous, non-porous spheres with a diameter of 25 nm. The pH value and surface charge are 9 and –42 mV, respectively in the initial stock, which makes the colloidal solutions highly stable without adding any stabilizer or applying surface modifications. Five concentrations, namely 0.01, 0.1, 0.5, 1.5, and 2 mg·mL–1, were investigated.
The concentrations are selected with respect to biological applications. All the samples are prepared with distilled water. The water resistivity is 19.2 MΩ·cm at 25 °C and is filtered with a 0.22 μm filter.
2.2 Salt solutions and pH buffers
Potassium chloride (KCl) solution was used for changing the IS of the NP colloidal solution. Six different concentrations from physiological IS up to 10 times higher concentration of 0.15, 0.25, 0.5, 1, 1.5, and 2 M were studied. High-concentration salt solutions were used to have a detectable NP agglomeration. Deficient concentration is used for the biologically relevant region.
Physiological pH value ranges from 7.4 (in body fluids like blood) to 4.5 (in intracellular compartments like lysosomes) [32]. Therefore, buffers with a pH value of 7.4 and 4.5 were prepared to investigate pH’s influence on the stability of the NP colloidal solutions concerning agglomeration; hydrogen chloride (HCl) solution was used to prepare the pH buffers.
Potassium chloride (≥ 99.5%) and HCl solution (37%) were purchased from Sigma Aldrich and used without further purification. All experiments were carried out at room temperature.
Table 2 gives an overview of sample concentrations and chosen conditions. Stable NP colloidal solution and related buffers are mixed in 1:2 per volume ratio, respectively. In the SAXS measurements, a micromixer system was used for solution mixing; however, for DLS, the samples were mixed just before the measurements. Experiments were not carried out for low NP concentrations as no detectable agglomeration for higher concentrations was observed. Also, DLS measurements in low concentration of NPs could not be done due to the shallow signal to noise ratio.
2.3 Human serum albumin (HSA)
HSA was chosen for our study, as it is the most abundant
Table 2 Sample concentration for salt and pH buffers. x measurements done by SAXS; o measurements done by DLS
NP concentration (mg·mL–1) 0.01 0.1 0.5 1.5 2 2 x x x o x o x o 1.5 — — x x o x o 1 — — — x o x o 0.5 — — — x o x o 0.25 — — — x o x o KCl solution (M) 0.15 — — — x o x o 4.5 — — — x o x o pH 7.4 — — — x o x o
protein in human blood plasma with a concentration of 35–50 mg·mL–1 [33]. We used HSA from CSL Behring (20% w/v),
which is a medical product, and the protein is highly stable in this solution with no agglomeration. Sodium chloride (NaCl) buffer solution (0.9% w/v) was prepared and used to dilute the protein dispersion to 4 mg·mL–1, which is the protein
concen-tration in cell culture media. NaCl (≥ 99.5%) was purchased from Sigma Aldrich and used without further purification. 2.4 SAXS
SAXS experiments were carried out with a Bruker Nanostar instrument (Bruker AXS GmbH, Karlsruhe, Germany) equipped with a pinhole collimation system and a micro-focused X-ray Cu source (wavelength Cu Kα 1.5406 Å) providing a beam with a diameter of about 300 μm. A 2D MikroGap technology- based detector (VÅNTEC-2000) with 2048 × 2048 pixels having a pixel size of 68 μm × 68 μm provided a resolvable q-range between 0.07 and 2.30 nm–1 for a 107 cm sample-to-detector
distance (SDD), where q=4π/ sinλ θ and 2θ in the scattering angle. The instrument was also equipped with a semi-transparent, custom-built beamstop. The X-ray beam in transmission mode impinged the quartz capillary system containing the NP colloidal solution. The scattering frames were recorded for 2.5 hours at room temperature in moderate vacuum conditions of about 10–2 mbar pressure for reducing air scattering. Before
the experiments, the SDD was calibrated with the standard silver behenate powder. 1D profiles were extracted using the Bruker software DIFFRAC.EVA. The background was corrected by normalizing the total scattering profile by the transmitted intensity measured at the direct beam position. Data were acquired with exposure times for 1,800 min for each scattering pattern at vacuum conditions, 10–1 mbar.
The data has been analyzed using indirect Fourier transfor-mation (IFT) methods to obtain the pair distance distribution function (PDDF), also called p(r) function, and the average of the radius of gyration (Rg) [34, 35]. PDDF curves represent
the real space image of NPs, which corresponds to scattering curves in reciprocal space and have the information about the size and shape of the particles. All IFT calculations were done using the GIFT method (Glatter O. PCG Software 4.05.12 ed2000).
2.5 Dynamic light scattering
To measure the hydrodynamic radius (Rh), time-resolved DLS
investigations were performed using a Zetasizer Nano ZS90 Malvern instrument operating with a He–Ne laser at a wavelength of 633 nm. The scattering angle was 90°. Stable NP colloidal solutions and buffers were mixed in a ratio 1:2 per volume, respectively. The refractive index for silica NPs in these measurements was considered to be 1.457 [36]. The instruments, concerning the NP concentration, automatically selected the number of sub-measurements. Measurements for different salt concentrations and pH buffers were recorded for a total time of 2.5 h.
Samples were prepared in the lowest amount, 600 μL, in disposal polystyrene cuvettes to ensure complete mixing. The samples were mixed in the cuvette inside the instrument, and the measurement was started immediately.
2.6 Microfluidic
2.6.1 Experimental setup
For the micromixer-SAXS setup, after investigating different designs, a mixer with three inlets (each inlet dimension: 0.5 mm in diameter), of which two sheath inlets positioned at
45° with respect to the core one has been designed and fabricated with poly(methyl methacrylate) (PMMA), in house. This mixer is connected to a quartz capillary with a diameter of 2 mm (Hilgenberg company, Germany) for X-ray invest-tigations. The middle inlet is used for the stable silica NP colloidal solution and the two others on the sides for the buffer solutions. The solutions were pumped into the mixer by a NEMESYS pump. Since the mixing depends on the sample diffusion coefficient, different flow rates cause different mixing profiles. In this study, we chose the flow rate concerning the NP agglomeration rate and the SAXS size detecting limits. For the experiments with salt solution and pH buffers, a flow rate of 0.5 μL·min–1 was used for all inlets. This flow rate is
chosen regarding time-resolved DLS data and the slow NP agglomeration rate. The total reaction time in the quartz capillary was 150 min. In the case of HSA protein, due to an extremely faster NP agglomeration, a flow rate of 50 μL·min–1
was used, which reduced the total reaction time in the quartz capillary to 1.6 min. Based on the applied flow rates and the X-ray beam spot size in the lab, the time resolution for slow agglomeration is 634 × 10–3 min, and for fast agglomeration
with protein 6.34 × 10⁻³ min.
Different positions on the quartz capillary, from the inlet of the quartz capillary to the end, corresponding to advancing stages of the agglomeration process, were selected for the SAXS analysis. Figure 1 shows the mixing profile and the measurement positions on the quartz capillary and the time evolution schematically.
Based on the flow rate applied for these measurements, the positions 1–5 from the beginning to the outlet of the quartz capillary, correspond to different moments in time in the agglomeration process. For a flow rate of 0.5 μL·min–1, these
positions refer to 5, 45, 77, 110, and 150 min, respectively. For 50 μL·min–1, three points, at the beginning, middle, and end
part of the quartz capillary, were selected, which refer to 0.04, 0.75, and 1.6 min of reaction time, respectively.
In the case of HSA protein, the agglomeration process is much faster compared to the previous experiments, and in less than 2 min, the agglomerated NP size is too big (>100 nm) to be investigated by SAXS. Therefore, much higher flow rates, 50 μL·min–1, coupled with low NP concentrations, were used.
2.6.2 Computational model and simulation
The microfluidic mixing of silica nanoparticles and buffer solutions was modeled using finite element methods (FEM). A three-dimensional (3D) model was implemented in COMSOL multiphysics (version 5.4a). The model aimed to evaluate the combination of different flow rates at various concentrations to reduce the number of experiments, especially in poor mixing conditions. Moreover, the impact of the probable geometrical tolerance of the setup, namely the quartz capillary diameter variation, capillary misalignment, and capillary-inlets connection on the results, have been modeled and analyzed. With this respect, a parametric sweep for different values of flow rates (between 0.5 and 1,000 μL·min–1) as well as various geometrical
defects was performed.
The geometrical dimensions of the model have been set the same as in the experimental setup. The solutions were modeled indirectly by considering the impact of the different solvent and silica NP concentrations on fluid properties (e.g., viscosity, density). For the base case, the concentration of silica nano-particles and their density were considered 6 mg·mL–1 and
2.3 g·mL–1, respectively. Dynamic viscosity, density (including
NPs), and diffusion coefficient were considered 0.11 Pa·s (at 20 °C), 1,006 kg·m–3, and 7 × 10⁻¹⁰ m2·s–1, respectively. For the
Nano Research other case studies, these values were variable based on the
different concentrations and solution properties. The outlet of the tube was taken sufficiently far from the mixing section to avoid any influence on the mixing condition from the boundary. Atmospheric pressure condition is imposed at the outlet boundary. Appropriate grids were built based on a grid sensitivity analysis. For example, the grid of the base case consists of 1,292,832 hybrids (tetrahedral and quadrilateral) finite elements. The laminar flow was solved as both stationary and transient problems. The generalized minimal residual (GMRES) method, which is an iterative method for solving massive systems of linear equations, has been employed as a numerical solver. The tolerances for convergence and other solver settings were determined based on sensitivity analysis in such a way that increases the tolerance further did not alter the solution results anymore.
2.7 Cryogenic (cryo)-TEM
NP colloidal solution with concentration of 6 mg·mL–1 and
KCl salt solution with concentration of 3 M, were prepared and mixed thoroughly in the 1:2 per volume ratio, respectively. The final sample prepared in that way contained 2 mg·mL–1
silica NPs dispersed in 2 M KCl solution. This sample was then subsequently incubated under room temperature without agitation, and the cryo-TEM measurements were performed after 30 min, 1 h, and 2.5 h of incubation.
To perform cryo-TEM measurements, 3 μL droplet of the sample was deposited onto a lacey carbon film (electron microscopy sciences). The droplet was then blotted to a thin layer of liquid, which was subsequently flash-frozen in the cryogen (liquid ethane). An FEI Vitrobot Mark IV was used for this procedure. Imaging was performed with the use of a Gatan single tilt cryo holder operated on an FEI Tecnai F20 80 kV transmission electron microscope in LowDose Mode. The samples were imaged at an average exposure of 1–3 electrons Å–2 on a Ceta camera.
3 Results
and
discussions
3.1 Microfluidic-SAXSIn this paper, we investigate the effects of IS, pH, and protein (HSA) presence on the stability of silica NPs in a dynamic and time-resolved manner. In a first step, reference measurements
were done on the stable silica NP colloidal solution to verify the size and monodispersity.
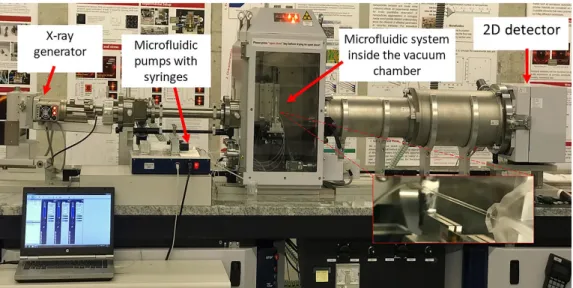
For the dynamical study of the agglomeration process, a microfluidic system has been developed and coupled with SAXS investigations. Figure 2 shows the SAXS instrument with the connected fluidic system equipped with a mixer and a pumping motor. Figure 3 shows the results for the flow simulation compared with the experimental results. The mixing profile is shown along the quartz capillary length for two different flow rates, 0.5 and 250 μL·min–1, respectively.
To check and predict the mixing profile for different flow rates along the quartz capillary, the simulation method is used. For generating the experimental data, a standard NP colloidal solution with a concentration of 2 mg·mL–1 was prepared and
investigated by SAXS. The absolute intensity in q = 0 was calculated for the standard sample concerningthe absolute intensity of water with 1.632 × 10⁻² cm–1 [37]. Then, a NP
solution with three times higher concentration than the standard sample, 6 mg·mL–1, was prepared. The micromixer
setup was used for diluting this NP solution with water in two different flow rates, 0.5 and 250 μL·min–1. The NP
concen-trations were calculated by comparing the absolute intensities
Iabs(0) for the respective samples with the Iabs(0) of the standard
sample. The Guinier approximation was used to determine
Iabs(0) [38, 39].
Based on the experiment and simulation as well, the solutions mix thoroughly in the quartz capillary for flow rates lower than 10 μL·min–1. However, at higher flow rates, which were
adopted for the study of fast agglomeration processes, there is no complete mixing in the first 2 cm of the quartz capillary. This is dedicated to investigating the early stage of interactions exactly before the complete mixing.
Since silica NPs are eager to stick to the wall of the quartz capillary, it needs to change the capillary for each sample. Based on the simulation results and confirmation by experiments, the geometrical tolerance of the experimental setup, such as minor changes in quartz capillary diameter, does not affect the mixing profile. The setup was also tested successfully for the reproducibility of experimental data over 10 h. The entire fluidic system is stable during 10 h of operations.
3.1.1 Stable silica NPs
Figure 4 summarizes the data for characterizing the stable colloidal silica NP solution. The radius of NPs is reported with
Figure 2 SAXS setup with the micromixer system for in situ studies. Solutions are pumped into the micromixer system and then into the quartz capillary for X-ray investigations.
Figure 3 Simulation and experimental results for the mixing profile along the quartz capillary length for two flow rates 0.5 and 250 μL·min–1.
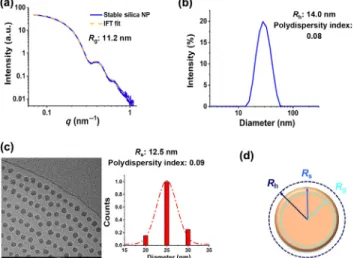
Figure 4 (a) SAXS measurements for stable silica NP colloidal solution. Results confirm the monodispersed and non-agglomerated state of NPs. (b) Cryo-TEM image of stable silica NPs. Particles have the spherical shape and are not agglomerated. (c) DLS measurements for stable silica NP colloidal solution. Results show the narrow polydispersity. (d) Comparison of the various radius terms used to characterize stable NPs. The different radiuses are shown as circles with different colors.
slight differences, which is due to the applied characterization method. In this study, we applied light and X-ray scattering methods, which determine the hydrodynamic radius Rh and
radius of gyration Rg, respectively. However, in the 2D imaging
method cryo-TEM, the geometric mean radius (Rs) was
measured.
The hydrodynamic radius Rh is obtained from the Stokes–
Einstein equation based on the diffusion coefficient and is defined as the radius of an equivalent hard-sphere diffusing at the same rate as the NP under observation. However, the radius of gyration Rg measured by SAXS, is defined as the mass-
weighted average distance from the core of a nanoparticle to each mass element in that particles and is independent of shape assumption. Figure 4(d) shows the three radiuses and their relationship in the case of a spherical nanoparticle [40]. These results confirm the dependency of NP size determination concerning the chosen characterization method.
3.1.2 Effect of NP concentration and IS on NP agglomeration
The effect of salt and NP concentration on NP stability was investigated. The initial IS of colloidal silica NP stock solution was increased by adding KCl salt solution with different molarities from 0.15 M, representing physiological conditions up to 2 M.
Figure 5(a) shows the obtained data with the corresponding fits obtained by IFT methods (Section 2.4), for the sample
containing 2 mg·mL–1 of NPs in 2 M KCl salt solution at
5 different positions of quartz capillary representing different time points of agglomeration process. As shown by the SAXS curves, the initial slope for the stable NP solution at a smaller
q is close to 0, indicating no agglomeration. The increasing
slope of the scattering spectra at small q ranges indicates the continuous agglomeration process along the quartz capillary. Figure 5(b) shows PDDF for each scattering spectra representing the NP agglomeration nicely overtime. The PDDF curve for the stable NP solution is symmetric, which not only confirms the spherical shape of the NPs but also indicates that there are no agglomerated particles [41].
According to the PDDF curve for position 5 at the outlet of the quartz capillary, the maximum dimension (rmax) for
agglomerated nanoparticles is 65 nm. The PDDF p(r), for homogeneous particles is defined as a distance histogram. Regarding rmax, forming agglomerates with around 3 NPs making
a line together can be considered. However, the formation of different configurations is possible, but the maximum dimension inside these agglomerates is rmax = 65 nm. Each of these
various NP configurations has specific scattering signals. The final scattering spectra show the average of all of these possible NP configurations. The height of p(r) is proportional to the number of distances found inside the particle within the interval r and r + dr [42]. Considering this point, p(r) has a higher value in r region for doublets and triplets. Therefore, the formation of NP doublets and triplets is the most probable compared to bigger agglomerated NPs, which confirms our observations for the early stage of the agglomeration process.
The position of the highest peak is moving to bigger r, and the mean radius of gyration increases significantly from position 1 with 11.5 nm to position 5 with 18.8 nm. This indicates the agglomeration process along the quartz capillary during the time.
Besides, agglomeration can be recognized directly from the forward-scattering intensity I(0), i.e., the intensity at q = 0 is directly proportional to the agglomeration number [41]. I(0) could be obtained from the IFT method as well.
Therefore, by dividing I(0) for each position on the quartz capillaryto the I(0) of the stable NP sample, the mean agglomeration numbers were calculated. The highest mean agglomeration number has been calculated with 2.35 for the sample at position 5 after 150 min, which shows the formation of mainly doublets and triplets. Nonetheless, the formation of bigger agglomerated NPs is also possible. However, the SAXS analysis reveals an average of all probable configurations. Table 3 shows the obtained data for the sample with 2 mg·min–1 NPs
and KCl 2 M for 150 min.
Figure 5 (a) Experimental data and fitted curves for stable silica NP colloidal solution and 2 M KCl salt solution in five different positions along the quartz capillary from the beginning to the end (1–5), see also Fig. 1. The slope of the scattering curves in the smaller q range increases with time, showing the continuous agglomeration process along the quartz capillary. (b) The PDDF for each scattering curve in positions 1–5.
Nano Research Table 3 Radius of gyration and mean agglomeration number for stable NP
sample and five different positions along the quartz capillary for 2 mg·mL–1
NPs and KCl 2 M Sample Stable NP Position 1 Position 2 Position 3 Position 4 Position 5 Rg(nm) 11.2 11.5 12 14.8 16.1 18.8 Mean agglomeration number 1 1.05 1.19 1.51 1.87 2.35 Time (min) 0 5 45 77 110 150
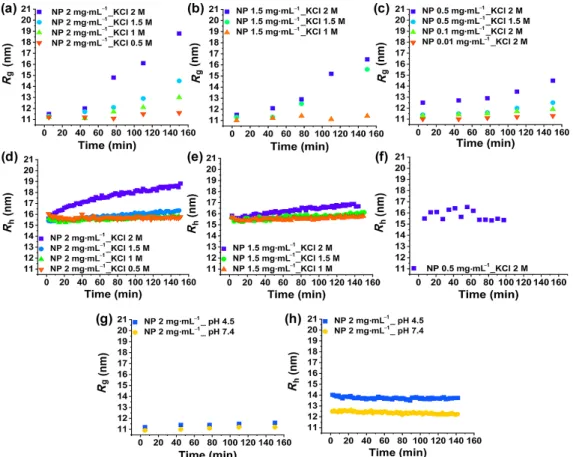
This experimental setup enabled us to monitor the early stage of NP agglomeration. The IFT fitted curves and PDDF plots show the agglomeration process not only qualitatively but also quantitatively. Samples with different NP and salt concentrations were studied to observe the effect of NP concentration and IS. For comparison, the same samples, as defined for SAXS investigations, were used for the analysis by time-resolved DLS. Figures 6(a) and 6(d) show the Rg obtained
by the microfluidic-SAXS method, and the Rh obtained by
time-resolved DLS is shown in Figs. 6(e) and 6(h). The direct influence of NP concentration and IS, which is shown by the SAXS data, is verified by time-resolved DLS data as well.
Even if the focus is to work at physiological concentrations, we start with high salt molarities, where we were able to detect agglomeration in stable NP solution. In the following, the salt concentration has been reduced. As shown, the agglomeration process is successfully tracked, and the direct effect of NP concentration and IS is confirmed for these samples by both characterization methods. The radius of gyration for the sample with 2 mg·mL–1 NPs and the highest IS with 2 M is
18.8 nm after 150 min. However, a size of only 16.5 nm is
observed for a lower NP concentration, i.e., 1.5 mg·mL–1, and
the same salt concentration. This monitors the direct effect of nanoparticles concentration on the agglomeration process. In the same way, by reducing the KCl molarity, the final NP radius is also reduced. At low concentrations, corresponding to physiological conditions, no NP agglomeration was observed.
The Derjaguin–Landau–Verwey–Overbeek (DLVO) theory is commonly used in colloidal science to describe the interactions of charged-surface NPs in solution. Based on this theory, inter- particle interaction and agglomeration are attributed to an energy balance of electrostatic double-layer repulsion and van der Waals attraction forces [43]. At low salt concentrations, the particles are repulsive, as the interactions are dominated by the double-layer contribution. Adding the salt to stable colloidal NP solutions will results in increasing the IS and consequently screen the NP surface charge and decrease the Debye layer. Resultantly, the interactions are dominated by the attractive van der Waals force, and NPs start to agglomerate [44].
For NP colloidal solutions with concentrations below 0.5 mg·mL–1 (Fig. 6(g)), the DLS measurements were not
successful since the signal-to-noise ratio was less than the instrument resolution, and the data does not meet the characterization criteria given by the instrument. For instance, the count rate for 0.1 mg·mL–1 NP colloidal solution was 11 kcps
that it is out of the range. The minimum count rate for a successful measurement is 300 kcps. Nevertheless, the SAXS method can be used for these low NP concentrations by increasing the measurement time. Figure 6(c) shows this result for 0.5, 0.1, and 0.01 mg·mL–1. In the case of a sample with
0.5 mg·mL–1 NP concentration, agglomeration was detected
during the time; however, for lower NP concentration, no agglomeration was detected.
Figure 6 (a) and (c) Microfluidic-SAXS results. The Rg for samples with NP concentration of 2 and 1.5 mg·mL–1 and lower concentrations indifferent IS
solutions, respectively, are shown for 150 min. (d) and (f) DLS results. The Rh for samples with NP concentration of 2, 1.5, and 0.5 mg·mL–1 in different IS
solutions, respectively, are shown for 150 min. (g) Microfluidic-SAXS results. The Rg for samples with NP concentration of 2 mg·mL–1 at two different pH
3.1.3 Influence of the pH on NP agglomeration
In this study, pH values of 7.4 and 4.5 were selected with respect to their biological relevance. In bio-assays as well as in cellular and subcellular uptakes, pH differences can change the NP stability or even result in the fate of them [32].
Figures 6(g) and 6(h) show the SAXS and DLS data for 2 mg·mL–1 of NPs at pH values of 7.4 and 4.5 representing cell
plasma and lysosomal pH, respectively. Since the isoelectric point for stable colloidal silica NP solution is 4, based on the provider information, and the pH for both of the buffer solutions is higher than this, it was predicted that the pH does not affect the agglomeration process. Since there was no detectable agglomeration for the highest NP concentration, the lower NP concentrations were not investigated. Also, the previous studies indicated the relative stability for silica NPs in water and phosphate buffered saline (PBS), although mesoporous silica NPs started to be eroded in biological media after one day [45, 46].
3.1.4 Influence of protein in NP agglomeration
Aside from IS, pH, and NP concentration, biomolecules are one of the key factors in biological environments affecting NP stability. A set of experiments by adding HSA protein was designed.
The microfluidic-SAXS method was used with NP colloidal solutions with a concentration of 0.5 mg·mL–1 for investigating
the effect of HSA protein in NP agglomeration. Considering the NP concentration and size, the protein to NP ratio can be calculated with the number of HSA protein to the number of silica NP, numprotein/numNPs = 1,308, which corresponds to 4 mg·mL–1 or 10% HSA protein in solution, same concentration
in biological assays [12]. For this experiment, a relatively high flow rate of 50 μL·min–1 was used since the agglomeration was
extremely fast compared to the previous experiments. A high NP concentration of 2 mg·mL–1 resulted in a rapid agglomeration
forming silica gel-like clots in the quartz capillary of the mixing system. Therefore, a much lower NP concentration of 0.5 mg·mL–1 was selected for further experiments.
The total time for the solution to pass the entire length of the quartz capillary is 1.6 min for the given flow rate. Due to the fast reaction, in this experiment, instead of 5 points on the length of quartz capillary, just 3 points were measured. The mean Rg for the positionat the outlet of the quartz capillary
after the mentioned time was 21 nm. The significant change in the slope of the X-ray scattering spectra in the low q range additionally indicates agglomeration. However, for the sample with the same NP concentration with high IS (2 M) after 150 min, the mean radius of gyration did change only to 18.8 nm. The fast changes in the silica NP radius during the 1.6 min in the presence of HSA show the extreme and direct influence of proteins on the NP agglomeration process. The HSA protein was diluted in a NaCl buffer of 0.9%. Before starting this experiment, the effect of this buffer on the stability of the NP colloidal solution was tested. No change in the stability state of the stable NP colloidal solution was observed.
Figure 7(a) shows the microfluidic-SAXS data for NP and protein interaction in 1.6 minutes. DLS measurements were performed with a higher NP concentration, 2 mg·mL–1 and
an HSA solution of 4 mg·mL–1. First, the stable NP colloidal
solution with and without 0.9% NaCl was measured. No agglomeration was monitored during the experiment. However, these DLS measurements in the presence of protein were not successful since the scattering intensity contains con-tributions from both the silica NPs and proteins. In this kind of
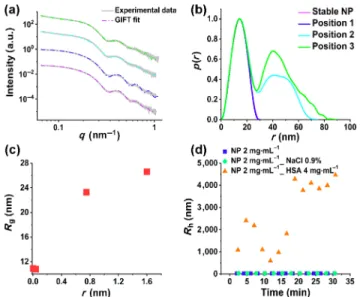
Figure 7 (a) Microfluidic-SAXS measurements for the sample with 0.5 mg·mL–1 NPs and 4 mg·mL–1 HSA. These data show a significant
change in the slope of SAXS spectra during the time in the low q range. (b) The PDDF for each scattering curve in Position 1–3 and stable NPs. (c) The Rg over time along the quartz capillary. (a)–(c) all indicate
agglomeration during the time along the capillary. (d) Time-resolved DLS measurements for the 2 mg·mL–1 silica NP sample with a NaCl buffer and
4 mg·mL–1 HSA.
measurement, with two different particle types in the sample at the same time, the DLS methodsuffers fromlow selectivity and distinguishing the relevant optical signals from the particles. Therefore, it cannot be used in this kind of studies. However, in the case of plasmonic NPs, depolarized scattering helps to overcome this limit [47].
3.2 Cryo-TEM
Cryo-TEM was additionally used for this research. However, the dynamic and time-resolved measurements, as applied in SAXS, were not possible with this method. In Cryo-TEM, large areas containing unwanted agglomerate nanoparticles were found. This could be due to the applied sample preparation procedure, more specifically, the step of depositing the NP solution on a grid. The presence of the agglomerated prevented the monitoring of the real NP size distribution in solution. However, despite the mentioned limitation of Cryo-TEM, Fig. 8 shows images of 2 mg·mL–1 silica NP dispersed in 2 M
KCl buffer solution after 1 h. Several silica NP doublets and triplets, as well as bigger clusters, were found in the ice, which indicates the occurrence of the agglomeration process. As shown in Fig. 8, the number of doublets and triplets is higher than the larger ones, which shows the early stage of agglomeration and the agreement with SAXS results.
Figure 8 Cryo-TEM images for 2 mg·mL–1 of silica NPs in 2 M salt buffer
Nano Research
4 Conclusions
Our presented microfluidic-SAXS method allows label-free,
in situ, and time-resolved measurements of dynamic processes
with high sensitivity and accuracy for slow and fast interactions. It is utilizable in laboratories and synchrotron facilities and relieves to follow changes in NP structure, size, and shape, providing not only qualitative but also quantitative data. Our microfluidic-SAXS approach enables label-free and in situ monitoring of nanosystem seven for low NP concentrations in their initial media and can be extended to explore the influence of complex environments.
In this study, the effects of IS, pH, and the presence of protein on the silica NP colloidal stability have been investigated individually. The dynamical process of the early stage of NP agglomeration has been quantified using our advanced microfluidic-SAXS concept. The significance and the direct effect of the presence of protein on silica NP agglomeration are quantitatively described. Agglomeration in the presence of protein is an extremely fast process, and in less than 1 min, the NP radius increases by around 15 nm. It contrasts with a much slower influence of IS and pH on NP agglomeration. In 2 Msalt solution, the NP radius changed around 7 nm after 150 min. The time scales show that this method is sensitive and precise in depicting the dynamics of fast and slow NP interactions in colloidal conditions.
Together with classical biochemical analysis, as well as modeling and simulation, our concept fills the knowledge gap in understanding NP agglomeration processes and provides the rationale for novel NP designs in particular for biomedical applications.
Acknowledgments
The authors are grateful to the Swiss National Science Foundation (No. 173012) for financial support. PW by the Materials Challenge NanoScreen co-funded by the Competence Centre for Materials Science and Technology (CCMX). Funding note: Open Access funding provided by University of Fribourg.
Open Access This article is licensed under a Creative Commons Attribution 4.0 International License, which permits use, sharing, adaptation, distribution and reproduction in any medium or format, as long as you give appropriate credit to the original author(s) and the source, provide a link to the Creative Commons licence, and indicate if changes were made.
The images or other third party material in this article are included in the article’s Creative Commons licence, unless indicated otherwise in a credit line to the material. If material is not included in the article’s Creative Commons licence and your intended use is not permitted by statutory regulation or exceeds the permitted use, you will need to obtain permission directly from the copyright holder.
To view a copy of this licence, visit http://creativecommons.org/ licenses/by/4.0/.
Reference
[1] Pai, A. B. Complexity of intravenous iron nanoparticle formulations: Implications for bioequivalence evaluation. Ann. New York Acad. Sci.
2017, 1407, 17–25.
[2] Moore, T. L.; Rodriguez-Lorenzo, L.; Hirsch, V.; Balog, S.; Urban, D.; Jud, C.; Rothen-Rutishauser, B.; Lattuada, M.; Petri-Fink, A. Nanoparticle colloidal stability in cell culture media and impact on
cellular interactions. Chem. Soc. Rev. 2015, 44, 6287–6305. [3] Wu, L. B.; Zhang, J.; Watanabe, W. Physical and chemical stability
of drug nanoparticles. Adv. Drug Deliv. Rev. 2011, 63, 456–469. [4] Bharti, B.; Meissner, J.; Klapp, S. H. L.; Findenegg, G. H. Bridging
interactions of proteins with silica nanoparticles: The influence of pH, ionic strength and protein concentration. Soft Matter 2014, 10, 718–728.
[5] Zook, J. M.; MacCuspie, R. I.; Locascio, L. E.; Halter, M. D.; Elliott, J. T. Stable nanoparticle aggregates/agglomerates of different sizes and the effect of their size on hemolytic cytotoxicity. Nanotoxicology
2011, 5, 517–530.
[6] Wills, J. W.; Summers, H. D.; Hondow, N.; Sooresh, A.; Meissner, K. E.; White, P. A.; Rees, P.; Brown, A.; Doak, S. H. Characterizing nanoparticles in biological matrices: Tipping points in agglomeration state and cellular delivery in vitro. ACS Nano 2017, 11, 11986– 12000.
[7] Bruinink, A.; Wang, J.; Wick, P. Effect of particle agglomeration in nanotoxicology. Arch. Toxicol. 2015, 89, 659–675.
[8] Nel, A. E.; Mädler, L.; Velegol, D.; Xia, T.; Hoek, E. M. V.; Somasundaran, P.; Klaessig, F.; Castranova, V.; Thompson, M. Understanding biophysicochemical interactions at the nano-bio interface. Nat. Mater. 2009, 8, 543–557.
[9] Hoshyar, N.; Gray, S.; Han, H. B.; Bao, G. The effect of nano-particle size on in vivo pharmacokinetics and cellular interaction.
Nanomedicine 2016, 11, 673–692.
[10] Saptarshi, S. R.; Duschl, A.; Lopata, A. L. Interaction of nano-particles with proteins: Relation to bio-reactivity of the nanoparticle.
J. Nanobiotechnol. 2013, 11, 26.
[11] Stebounova, L. V.; Guio, E.; Grassian, V. H. Silver nanoparticles in simulated biological media: A study of aggregation, sedimentation, and dissolution. J. Nanopart. Res. 2011, 13, 233–244.
[12] Hondow, N.; Brydson, R.; Wang, P. Y.; Holton, M. D.; Brown, M. R.; Rees, P.; Summers, H. D.; Brown, A. Quantitative characterization of nanoparticle agglomeration within biological media. J. Nanopart.
Res. 2012, 14, 977.
[13] Orts-Gil, G.; Natte, K.; Thiermann, R.; Girod, M.; Rades, S.; Kalbe, H.; Thünemann, A. F.; Maskos, M.; Österle, W. On the role of surface composition and curvature on biointerface formation and colloidal stability of nanoparticles in a protein-rich model system.
Colloids Surf. B: Biointerfaces 2013, 108, 110–119.
[14] Spinozzi, F.; Ceccone, G.; Moretti, P.; Campanella, G.; Ferrero, C.; Combet, S.; Ojea-Jimenez, I.; Ghigna, P. Structural and thermodynamic properties of nanoparticle-protein complexes: A combined SAXS and SANS study. Langmuir 2017, 33, 2248–2256.
[15] Kumar, A.; Dixit, C. K. 3 - Methods for characterization of nano-particles. In Advances in Nanomedicine for the Delivery of Therapeutic
Nucleic Acids. Nimesh, S.; Chandra, R.; Gupta, N., Eds.; Woodhead
Publishing: Amsterdam, 2017; pp 43–58.
[16] Titus, D.; James Jebaseelan Samuel, E.; Roopan, S. M. Chapter 12 - Nanoparticle characterization techniques. In Green Synthesis,
Characterization and Applications of Nanoparticles: A volume in Micro and Nano Technologies. Shukla, A. K.; Iravani, S., Eds.;
Elsevier: Amsterdam, 2019; pp 303–319.
[17] Mourdikoudis, S.; Pallares, R. M.; Thanh, N. T. K. Characterization techniques for nanoparticles: Comparison and complementarity upon studying nanoparticle properties. Nanoscale 2018, 10, 12871–12934. [18] Li, T.; Senesi, A. J.; Lee, B. Small angle X-ray scattering for
nanoparticle research. Chem. Rev. 2016, 116, 11128–11180. [19] Sharma, R. Experimental set up for in situ transmission electron
microscopy observations of chemical processes. Micron 2012, 43, 1147–1155.
[20] Jeelani, P. G.; Mulay, P.; Venkat, R.; Ramalingam, C. Multifaceted application of silica nanoparticles. A review. Silicon 2020, 12, 1337–1354.
[21] Pauw, B. R. Corrigendum: Everything SAXS: Small-angle scattering pattern collection and correction (2013 J. Phys.: Condens. Matter 25 383201). J. Phys.: Condens. Matter 2014, 26, 239501.
[22] Zackrisson, A. S.; Pedersen, J. S.; Bergenholtz, J. A small-angle X-ray scattering study of aggregation and gelation of colloidal silica.
Colloids Surf. A: Physicochem. Eng. Aspects 2008, 315, 23–30.
[23] Partyka-Jankowska, E.; Leroch, S.; Akbarzadeh, J.; Pabisch, S.; Wendland, M.; Peterlik, H. SAXS studies on silica nanoparticle
aggregation in a humid atmosphere. J. Nanopart. Res. 2014, 16, 2642.
[24] Silva, B. F. B. SAXS on a chip: From dynamics of phase transitions to alignment phenomena at interfaces studied with microfluidic devices. Phys. Chem. Chem. Phys. 2017, 19, 23690–23703. [25] Lutz-Bueno, V.; Zhao, J. G.; Mezzenga, R.; Pfohl, T.; Fischer, P.;
Liebi, M. Scanning-SAXS of microfluidic flows: Nanostructural mapping of soft matter. Lab Chip 2016, 16, 4028–4035.
[26] Watkin, S. A. J.; Ryan, T. M.; Miller, A. G.; Nock, V. M.; Pearce, F. G.; Dobson, R. C. J. Microfluidics for small-angle X-ray scattering. In X-ray Scattering. Ares, A. E. Ed.; InTech: Rijeka, 2017, 89–104. [27] Ghazal, A.; Gontsarik, M.; Kutter, J. P.; Lafleur, J. P.; Ahmadvand, D.;
Labrador, A.; Salentinig, S.; Yaghmur, A. Microfluidic platform for the continuous production and characterization of multilamellar vesicles: A synchrotron Small-Angle X-ray Scattering (SAXS) study.
J. Phys. Chem. Lett. 2017, 8, 73–79.
[28] Poulos, A. S.; Nania, M.; Lapham, P.; Miller, R. M.; Smith, A. J.; Tantawy, H.; Caragay, J.; Gummel, J.; Ces, O.; Robles, E. S. J. et al. Microfluidic SAXS study of lamellar and multilamellar vesicle phases of linear sodium alkylbenzenesulfonate surfactant with intrinsic isomeric distribution. Langmuir 2016, 32, 5852–5861.
[29] Khvostichenko, D. S.; Kondrashkina, E.; Perry, S. L.; Pawate, A. S.; Brister, K.; Kenis, P. J. A. An X-ray transparent microfluidic platform for screening of the phase behavior of lipidic mesophases. Analyst
2013, 138, 5384–5395.
[30] Silva, B. F. B.; Zepeda-Rosales, M.; Venkateswaran, N.; Fletcher, B. J.; Carter, L. G.; Matsui, T.; Weiss, T. M.; Han, J.; Li, Y. L.; Olsson, U. et al. Nematic director reorientation at solid and liquid interfaces under flow: SAXS studies in a microfluidic device. Langmuir 2015,
31, 4361–4371.
[31] Lattman, E. E.; Grant, T. D.; Snell, E. H. SAXS Instrumentation. In
Biological Small Angle Scattering. Oxford University Press: Oxford,
2018, 134–157.
[32] Brandenberger, C.; Mühlfeld, C.; Ali, Z.; Lenz, A. G.; Schmid, O.; Parak, W. J.; Gehr, P.; Rothen-Rutishauser, B. Quantitative evaluation of cellular uptake and trafficking of plain and polyethylene glycol- coated gold nanoparticles. Small 2010, 6, 1669–1678.
[33] Wang, R. E.; Tian, L.; Chang, Y. H. A homogeneous fluorescent sensor for human serum albumin. J. Pharm. Biomed. Anal. 2012, 63, 165–169. [34] Glatter, O. A new method for the evaluation of small-angle scattering
data. J. Appl. Cryst. 1977, 10, 415–421.
[35] Fritz, G.; Bergmann, A.; Glatter, O. Evaluation of small-angle scattering data of charged particles using the generalized indirect Fourier transformation technique. J. Chem. Phys. 2000, 113, 9733–9740. [36] Kimoto, S.; Dick, W. D.; Hunt, B.; Szymanski, W. W.; McMurry, P.
H.; Roberts, D. L.; Pui, D. Y. H. Characterization of nanosized silica size standards. Aerosol Sci. Technol. 2017, 51, 936–945.
[37] Fan, L. X.; Degen, M.; Bendle, S.; Grupido, N.; Ilavsky, J. The absolute calibration of a small-angle scattering instrument with a laboratory X-ray source. J. Phys.: Conf. Ser. 2010, 247, 012005.
[38] Jacques, D. A.; Trewhella, J. Small-angle scattering for structural biology-Expanding the frontier while avoiding the pitfalls. Protein
Sci. 2010, 19, 642–657.
[39] Mylonas, E.; Svergun, D. I. Accuracy of molecular mass determination of proteins in solution by small-angle X-ray scattering. J. Appl. Cryst.
2007, 40, s245–s249.
[40] Primavera, R.; Barbacane, R. C.; Congia, M.; Locatelli, M.; Celia, C. Laser diffraction and light scattering techniques for the analysis of food matrices. Adv. Food Saf. Health 2014, 6, 40–60.
[41] Glatter, O. Chapter 2 - General theorems and special cases. In
Scattering Methods and their Application in Colloid and Interface Science. Glatter, O., Ed.; Elsevier: Amsterdam, 2018; pp 19–32.
[42] Glatter, O. Chapter 1 - Interference, rayleigh–debye–gans theory. In
Scattering Methods and their Application in Colloid and Interface Science. Glatter, O., Ed.; Elsevier: Amsterdam, 2018; pp 1–18.
[43] Lebovka, N. I. Aggregation of charged colloidal particles. In
Polyelectrolyte Complexes in the Dispersed and Solid State I: Principles and Theory. Müller, M., Ed.; Springer: Berlin, Heidelberg, 2012;
pp 57–96.
[44] Israelachvili, J. N. Intermolecular and Surface Forces; 3rd ed. Academic Press: Boston, 2011.
[45] Yang, S. A.; Choi, S.; Jeon, S. M.; Yu, J. H. Silica nanoparticle stability in biological media revisited. Sci. Rep. 2018, 8, 185. [46] Diedrich, T.; Dybowska, A.; Schott, J.; Valsami-Jones, E.; Oelkers,
E. H. The dissolution rates of SiO2 nanoparticles as a function of
particle size. Environ. Sci. Technol. 2012, 46, 4909–4915. [47] Balog, S.; Rodriguez-Lorenzo, L.; Monnier, C. A.; Obiols-Rabasa,
M.; Rothen-Rutishauser, B.; Schurtenberger, P.; Petri-Fink, A. Characterizing nanoparticles in complex biological media and physiological fluids with depolarized dynamic light scattering.
Nanoscale 2015, 7, 5991–5997.