HAL Id: hal-02498605
https://hal.archives-ouvertes.fr/hal-02498605
Submitted on 4 Mar 2020
HAL is a multi-disciplinary open access
archive for the deposit and dissemination of
sci-entific research documents, whether they are
pub-lished or not. The documents may come from
teaching and research institutions in France or
abroad, or from public or private research centers.
L’archive ouverte pluridisciplinaire HAL, est
destinée au dépôt et à la diffusion de documents
scientifiques de niveau recherche, publiés ou non,
émanant des établissements d’enseignement et de
recherche français ou étrangers, des laboratoires
publics ou privés.
Effect of the deposition route on the microstructure of
plasma-sprayed hydroxyapatite coatings
Marine Chambard, Olivier Marsan, Cédric Charvillat, David Grossin, P. Fort,
Christian Rey, François Gitzhofer, Ghislaine Bertrand
To cite this version:
Marine Chambard, Olivier Marsan, Cédric Charvillat, David Grossin, P. Fort, et al.. Effect of the
de-position route on the microstructure of plasma-sprayed hydroxyapatite coatings. Surface and Coatings
Technology, Elsevier, 2019, 371, pp.68-77. �10.1016/j.surfcoat.2019.01.027�. �hal-02498605�
OATAO is an open access repository that collects the work of Toulouse
researchers and makes it freely available over the web where possible
Any correspondence concerning this service should be sent
to the repository administrator:
tech-oatao@listes-diff.inp-toulouse.fr
This is an author’s version published in:
http://oatao.univ-toulouse.fr/25563
To cite this version:
Chambard, Marine
and Marsan, Olivier
and Charvillat, Cédric
and
Grossin, David
and Fort, P. and Rey, Christian
and Gitzhofer, François
and Bertrand, Ghislaine
Effect of the deposition route on the microstructure
of plasma-sprayed hydroxyapatite coatings. (2019) Surface and Coatings
Technology, 371. 68-77. ISSN 0257-8972
Effect of the deposition route on the microstructure of plasma-sprayed
hydroxyapatite coatings
Marine Chambard
a,
b,
*
, O. Marsan
a, C. Chanrillat
a, D. Grossin
a, P. Fort
C,
C. Re
t1
, F. Gitzhofer
b,
G. Bertrand
a'CTRIMAT, Université de Toulouse, CNRS, INP-ENSIACET 4 allée Emlle Monso, BP44362, 31030 Toulouse cedex 4, J'tance
" CREPE, Dept of Chemtcal and Blotechnologtcal Engineering, Université de Sherorooke, Sherorooke, QC, Canada
'PROJECTION PLASMA SYSTEME (2PS), Z1 du Colombier, 12220 Montbazens, J'tance
ARTICLE INFO AB STR A CT
Keywords:
Rf - suspension plasma spraylng APS
Hydroxyapatlte coatlng Microstructure Precursor nature
Plasma-spray (PS) is the most common technique used to cover orthopaedic titanium-based implant surfaces 111,ith hydroxyapatite (HA - Ca1o(PO.)6OH2). The objective of the current work was to explore the influence of the precursor nature and characteristics (mainly powder size, Ca/P ratio, and density) on the morphology and the microstructure of HA coatings, deposited either by conventional atmospheric plasma spray (APS) or by rf-sus pension plasma spray (rf-SPS). Two powders with different size distribution, density and shape were sprayed 111,ith same operating APS conditions. In parallel two water-based suspensions with distinct particle size and chemistry (Ca/P ratio) were implemented in rf-SPS. The morphology of both APS and rf-SPS coatings observed by SEM exhibits micro and sub-micro sized structures respectively, 111,ith similar porosity and thickness. The difference in precursor particle size does not affect the coating structure in rf-SPS, unlike in APS conditions. Superimposition of topography and phases maps performed from profilometry and Raman cartographies showed no direct correlation between the surface profile and composition. But such analysis highlighted the hetero geneity of the phases composing the coating surface, opening the possibility of a better understanding of bio logical behaviour.
1. Introduction
Every year in Canada and in France, around 4 to 5% more hip and knee joints are irnplanted for medical (traumas, ctiseases such as obe sity) and demographic (aging of the population) reasons [l]. An in creasing number of these prostheses are currently made of a bioinert metal coated with hydroxyapatite (HA), whose crystalline structure and chemical composition are very close to those of the minerai part of bones. This calcium phosphate (Ca10(PO4)6OH:0 is the preferred ma
terial in the field of orthopedics for its osteoconductive and bio compatible properties [2-5]. Hence, hydroxyapatite coatings on tita nium-based implants (Ti-4Al-6V) have been used since the mid-1980s for their ability to promote early osteointegration and subsequent sta bility without the help of a cernent. Various processes were investigated to produce those calcium phosphate (CaP) coatings, but national agencies (FDA, ANSM ... ) only approve the plasma spray techniques, for their ability to produce coatings with targeted thlckness and appro priate mechanical and biological properties [6,7]. More specifically, APS (Atmospheric Plasma Spraying) is the conventional technique
• Corresponding author at: 4 allée Emile Monso, 31030 Toulouse, France.
E-mail address: marine.chambard@ensiacet.fr (M. Chambard).
favored by industrials, for its moderate cost, ease of implementation and high production rate.
Nevertheless, plasma-sprayed coatings can be partly resorbed after implantation, mainly because of the presence of small amounts of cal cium phosphate phases (tetracalcium phosphate TTCP, tricalcium phosphate TCP, oxyapatite OA, amorphous calcium phosphate ACP, calcium OJtide CaO), more soluble than hydroxyapatite in biological medium [8,9]. These minor unintended phases result from the de composition of HA during spraying, caused by the very high tempera tures encountered into the plasma jet and subsequent quenchlng ("' 104-106 K·s-1) of the molten particles onto the cooled substrate. The following reactions describe the decomposition of HA depencling on temperature.
Successive dehydroxylation of hydroxyapatite into oxyhydrox yapatite (OHA) and oxyapatite depending on vapor pressure:
Ca10(PO4}6COH)2 +-+ Ca10(PO4)6Ox(OH)2-2X + x H2O (la) 8S0°C
Ca10(PO•)6Ox(OH)z_2.x +-+ Caio(PO.)6O + (1 - x) H2O (lb)
1050-1500"C
(2)
(3)
+ +
°
Ca (PO )3 4 2 Ca (PO ) O4 4 2 CaO liquid phase.
1750 C (4)
As suggested by Overgaard [10], coating loss might not be in-trinsically a problem if enough coating is replaced by bone to sustain-ably fix the implant, although one may question the metal-bone inter-face quality. This addresses the importance of the coating quality (purity, crystallinity, microstructure, porosity, roughness, thickness, mechanical properties…) [11].
Depending on the spraying conditions (nature of the plasma gases, presence of water etc.), various degrees of decomposition occur. The presence of these phases at the substrate coating interface or into the coating gradually weakens it by a dissolution process until its possible failure and scaling [4,12–14]. There is thus an increasing need for hip prosthesis with a better mechanical stability for the long term, in order to reduce health care costs and traumas caused by revisions which re-presented > 8% of all the prostheses implanted in 2014–2015 in Ca-nada [1]. An accurate quantification and localization of the decom-posed phases which are present in plasma sprayed coatings is thus essential.
Besides, research recently enlightened the interest of producing nanostructured coatings to bring their structure closer to that of the natural bone. Such a coating is of biological and mechanical interest since Webster et al. [15] have demonstrated that osteoblastic activity on bulk hydroxyapatite synthesized by precipitation and sintered at 1100 °C is enhanced by decreasing the grain sizes from a micro to a nanometric range [16], the transition value being established around 100 nm. This strategy was also applied to the coatings production and has demonstrated tensile strength adhesion values in accordance with standards (15 MPa for adhesion test in ISO 13779-2:2008) and good cell attachment and proliferation behaviours. The elaboration of these na-nostructured coatings has been achieved by using a suspension (liquid feedstock containing submicronic to nanometric solid particles) instead of a powder to be injected in the plasma spray system (SPS) [17–19]. The Université de Sherbrooke invented the rf-suspension plasma spray in the 1990s, and since then has worked on materials and systems de-velopments using this technology. The supplementary advantages of a liquid feedstock rely on a larger tuning of the chemistry of the pre-cursors and distinct composition and temperature of the plasma. Such characteristics are expected to enable a better control of the coatings composition, and possibly limiting the decomposition of the hydro-xyapatite under optimised conditions [20]. Indeed, the solvent makes the plasma cooler but can enhance the particle treatment. The in-troduction of more species to be ionized increases on one hand the thermal conductivity of the plasma mixture (and thus the heat flux perceived by the particles), and on the other hand cools it down by consuming the power of the torch [21,22]. Not to mention the fact that the presence of water vapor shifts the balance in favor of the con-servation of hydroxyapatite according to Le Châtelier's principle in eqs.
(1a) and (1b).
It has also been shown that certain characteristics, such as surface roughness and porosity, influence the bioactivity of the hydroxyapatite coating in the short and long term, since they define the surface area that interacts with the different proteins [23,24]. It has been largely demonstrated that the higher the roughness the better the osseointe-gration of the coating [25,26]. Crystallinity is also a critical parameter in the cell behaviour as mentioned in the review of Surmenev et al. [27]. A highly crystallized coating has been proven to increase the cell
proliferation and adhesion compared to a poorly crystallized coating for identical particle size. Moreover, nanosized crystallites favored good cell attachment and spreading compared with uncoated Ti [16].
The present study aims at determining the impact of the particles characteristics (density, Ca/P ratio and size distribution) used in the suspension on the roughness, microstructure, and composition of the coatings obtained by rf-SPS. To better assess the rf-SPS coatings mi-crostructure, a comparison is performed with coatings synthesized by conventional APS implementing optimised commercial conditions with two different powders.
2. Experimental methods 2.1. Material
2.1.1. Substrates
Titanium alloy Ti-6Al-4V (grade 5) was selected as the substrate material for its sufficient mechanical strength, anti-corrosion and bioinert properties [4,28].
For both rf-SPS and APS processes, prior to plasma spraying, plates of 75 × 55 × 1.6 mm3were cleaned with solvents (ethanol and acetone
in ultrasonic bath) and grit-blasted with alumina (F46) at an incidence angle of 90°, a 120 mm blasting distance and a pressure of 4.5 bar. The arithmetic roughness of the surface (Sa) was determined with a pro-filometer to be approximately 4 μm.
2.1.2. Rf-SPS powders
Two powders (K-SPS and Q-SPS) were synthesized to produce the suspensions for rf-SPS plasma spraying. Calcium nitrate tetrahydrate (Ca(NO3)2, 4H2O – Sigma Aldrich), diammonium phosphate
((NH4)2HPO4- Fischer) and NH4OH solution at 20 wt% (Fischer) were
used as chemical precursors for Ca2+, PO
42−and OH−. The calcium
phosphates were obtained by coprecipitation according to the following balanced chemical equation:
+ + +
+
10 Ca(NO ) 6 (NH ) HPO 8 NH OH Ca (PO ) OH 6 H O
20 NH NO
3 2 4 2 4 4 10 4 6 2 2
4 3. (5)
The powder synthesis protocols were adapted from protocols de-scribed by Kannan [29] and Al-Qasas [30], respectively for K-SPS and Q-SPS. The main differences between the K-SPS and Q-SPS adapted protocols rely on the reactants feed rates and concentrations, as well as the maturation time. The pH is maintained at 9 all along the reaction by adding 20 wt% NH4OH to obtain the appropriate acidity of the
phos-phate ion leading to an apatitic structure. The Ca/P ratio of the pre-cursors is set to 1.67 to promote the formation of stoichiometric hy-droxyapatite. After the maturation time, the powders are filtered and washed with 10 times the reaction medium volume of water before freeze-drying (pressure of 0.10 mbar, −80 °C for 3 days).
2.1.3. APS powders
Two types of hydroxyapatite powders were used: a sintered one purchased from Teknimed (Blocky, density of 0.87 g/cm3, D
50 of
167 μm) and a spray-dried one from Medicoat (SD, density of 0.54 g/ cm3, D
50of 97 μm). Both powders are fully crystallized and pure
hy-droxyapatite (> 98 vol%) as determined by X-ray diffractometry before and after calcination at 1000 °C for 15 h.
2.2. Plasma spraying parameters
The operating conditions of both techniques are reported inTable I. APS coatings were produced under optimised commercial conditions by 2PS in Montbazens with a GT5 2PS torch, under reducing conditions (Ar/H2).
Rf-SPS coatings were produced at the Université de Sherbrooke (Québec) with plasma generated by a 50-kW RF plasma torch operating at 3 MHz (PL-50 model from Tekna Plasma System Inc.). The suspension was injected by a
peristaltic pump at a feeding rate of 10 mL/min with a solid load of 13 wt%. The liquid atomisation probe was designed by Tekna, with an output dia-meter of 0.8 mm. The composition of the plasma is a mixture of Ar and O2,
based on previous work performed by Loszach et al. [17] that pointed out the excess of HA decomposition caused by the use of H2due to its very high
thermal conductivity (3.74 W·m−1·K−1) and diatomic nature, increasing the
plasma density. But argon is a monoatomic gas with low thermal con-ductivity (0.64 W·m−1·K−1) and it is not energetic enough if used alone.
Oxygen is therefore the most appropriate secondary gas (1.37 W·m−1·K−1)
in this case.
2.3. Characterization of powders and coatings
All the following characterizations were performed in line with ISO standard 13,779–2:2008 and 13,779-3:2008 [31,32].
2.3.1. Particle size distribution
The particle size distribution was measured with a Malvern Mastersizer Hydro 2000S granulometer (UK) in aqueous media, with ultrasound for SPS and Blocky-APS powders. Ultrasound was not used in the case of the SD-APS powder because it caused the particles to break down into smaller pieces, distorting the results. The measuring cell reservoir was kept under agitation at 1750 rpm for all trials.
2.3.2. Ca/P ratio of powders
The chemical composition of the powders was established by com-plexometric titration with EDTA for the determination of the calcium content and UV spectrophotometry determination of the phosphova-nadomolybdic complex for the phosphorus content. It was then con-firmed by XRD analysis on calcined powders, according to the proce-dure provided by the standard ISO 13779-3 implying the use of standards of known composition.
2.3.3. Topography
The roughness of the substrates and the deposited coatings was evaluated using a Sensofar S-Neox confocal microscope (Barcelona, Spain) at ×10 magnification. The average value was determined from 5 scanning zones of 1750 × 1300 μm at 0, 90°, 180° and 270°.
2.3.4. Crystalline phases
The phase analysis of the powders was investigated using D8 dif-fractometer (Bruker AXS GmbH, Karlsruhe, Germany) with Cu Kα ra-diation (λ = 1.5406 Å) produced at 40 kV and 50 mA. Data were re-corded in the 20°–60° 2θ range with a step size of 0.02° and 38 s per step. The patterns were identified using Match! Software and Rietveld refinements were realized using Maud software [33] with a fixed background, based on the following JCPDS data:
•
HA, hydroxyapatite, JCPDS no. 00-009-0432;•
α-TCP, tricalcium phosphate Ca3(PO4)2, JCPDS no. 04-018-9895;•
β-TCP, tricalcium phosphate Ca3(PO4)2, JCPDS no. 00-070-2065;•
TTCP, tetracalcium phosphate, Ca4P2O9, JCPDS no. 00-025-1137;•
CaO, calcium oxide, JCPDS no. 04–011-9020.Amorphous phase was considered during Rietveld refinement but only for purposes of comparison between coatings, since this method is not accurate enough [34].
The crystallinity ratio R1was calculated according to the formula
proposed in the standard ISO 13779-3, involving the use of a fully crystallized standard (hydroxyapatite calcined at 1000 °C for 15 h):
= ×
R Integrated intensity of lines of the sample Integrated intensity of lines of the standard
10
10 100.
1
(6) Crystallite sizes d were estimated by Scherrer approximation:
=
d K h/ 12cos (7)
where K is the broadening constant varying with the crystal shape and chosen to be 0.9 to fit with the elongated shape of crystalline apatite, θ the scattering angle, λ the wavelength of the incident radiation (Cu Kα = 1.5418740 Å), h1/2 the value of full width at half-maximum
in-tensity of the peaks of the (002) and (300) planes, representative of the crystallites along c- and a-axes respectively. The size of crystallites is roughly estimated with this equation because of the imprecision of certain parameters such as K and the fact that the peaks of interest are out of the range 2θ = 30°–50°, which generates peak asymmetry and compromise profile analysis.
2.3.5. Non-crystalline phases
Fourier Transform Infrared FTIR analysis was carried out on pow-ders with a PerkinElmer 1700 spectrometer (USA) at a resolution of 4 cm−1and KBr pellets, in the 400–4000 cm−1range.
Raman spectra of the coating were recorded with a Labram HR 800 confocal microscope (Horiba Jobin-Yvon, Japan) equipped with a λ = 532 nm radiation, in the 100–4000 Raman shift range. A semi-quantitative evaluation of the different bands constituting the ν1PO4
domain was performed using Labspec 5 curve-fitting software, based on the peak positions given by Rey et al. [35]. This analysis is useful to evaluate the presence of phases like the amorphous calcium phosphate (ACP) and the oxyapatite (OA), two phases difficult to identify by XRD. To characterize the surface and cross section phase homogeneity of the coatings, the integrated intensity of the ν1PO4hydroxyapatite peak
IHAwas measured on a 290 × 440 and 70 × 55 μm2area for the surface
and cross section respectively, as well as the sum of the integrated in-tensity of the ν1PO4lines of all the other undesirable calcium
phos-phate phases (OP) mentioned before. A spot size of 5 μm2was used and
Table I
Plasma spraying parameters used for APS and rf-SPSa.
Technique APS rf-SPS
Power (kW) 30 35
Plasma gas Ar/H2(plasma) and Ar (carrier) Ar (23 slpm)
Carrier Gas (70–75 slpm in total) Ar (12 slpm)
Sheath Gas n.a. Ar/O2(12/50 slpm)
Pressure (torr) 750 100
Working distance (mm) App. 100 200
Solid content of the suspension (wt%) n.a. 13
a To preserve and ensure their expertise as manufacturer, 2PS keeps confidential some elements related to APS technique.
Table II
Raman line positions composing v1band in plasma-sprayed calcium phosphate coatings [35].
Phase Characteristic peaks in v1band
Hydroxyapatite HA 964 vs
Tricalcium phosphate α-TCP 976 s, 964 s, 954 sh Tricalcium phosphate β-TCP 970 s, 948 s
Tetracalcium phosphate TTCP 983 vw, 961 vs, 956 vs, 946 s, 940 s Amorphous calcium phosphate 950 s
= + R IHA/(IHA IOP)
2 (8)
with IOP= ITTCP+ Iα−TCP+ Iβ−TCP+ IACP+ IOA. 2.3.6. Morphology
APS and rf-SPS powders and coatings were observed by SEM with a LEO 435 VP (Semtech, USA), using the back-scattering mode at 15 kV, 1.6 nA probe current and 12 mm working distance. To determine the porosity from the cross-section, the samples were cut, then mounted and vacuum impregnated with cold epoxy. They were then ground and polished in accordance with the procedure described by Geels et al. [36]. Image analysis was performed with ImageJ on 10 different pic-tures, by manual thresholding and despeckling.
3. Results and discussion 3.1. Characteristics of powders 3.1.1. Particle size and morphology
The size distributions of all powders are monomodal curves, centered around 100–150 μm for APS powders and 3–9 μm for synthesized K and Q-SPS powders. The span parameter calculated between the 10% and 90% points and normalized to the mid-value (D90 − D10)/D50 evidences the width of the size distribution (Table III). K and Q-SPS powders display a similar but twofold higher span parameter, indicating a wider size distribu-tion compared with APS powders, whose span parameters are equal to 1.
Both SPS powders have similar shapes with irregular granular faces and edges. The K particles are visibly larger than the Q particles but do not show an acicular shape, contrary to what is usually observed for apatite particles. APS powders morphologies are quite different: as expected, the Blocky-APS particles display an angular shape whereas the SD-APS ones are more spherical [30].
3.1.2. Structural analysis
The Ca/P ratio of Q-SPS synthesized powders and of both com-mercial powders is around 1.67, close to the ratio of a stoichiometric HA whereas for the K-SPS synthesized particles, it is around 1.62 as reported inTable III.
XRD patterns of all powders (Fig. 1) show the typical crystal-lographic apatitic structure of Ca10(PO4)6(OH)2(JCPDS 00–009-432),
where no secondary phase is detected. Poorly crystallized apatite is identified in the case of K-SPS, represented by a broad and barely visible peak centered around 2θ = 30.5° [37,38]. The crystallite sizes are large and similar for both APS powders (about 200 nm along the a-axis) while they are quite small in the case of the Q-SPS and even more for the K-SPS powders (75 and 20 nm along the a-axis respectively). This is probably the consequence of the high reactant feed rate im-plemented in the K-SPS synthesis compared with the Q-SPS, which fa-vored nucleation over crystal growth.
FTIR spectra of commercial and synthesized powders are presented inFig. 2and are typical of an hydroxyapatite [39,40]. As expected, APS commercial powders spectra exhibit strong peaks at 632 ± 1 and 3570 ± 2 cm−1, attributed respectively to the libration mode of the
hydroxyl group OH−and to its stretching mode ν
s, characteristic of the
hydroxyapatite phase. In contrast, these peaks are weak in the case of K-SPS and Q-K-SPS, which might indicate that the apatite is not fully hy-droxylated. Additional weak lines at 1400–1500 cm−1 in these last
samples indicate the presence of carbonate ions, confirmed by the presence of a shoulder at 872 cm−1. This last line could also point out
the existence of a few HPO42−groups in these CaP structures, typical
for calcium deficient hydroxyapatite (Ca/P < 1.667), as mentioned by Raynaud et al. [41]. The broad peak around 3430 ± 20 cm−1and
Q-SPS powders reveals a significant amount of water most probably ad-sorbed to the surface of these nanosized crystalline powders. Indeed, it is relevant to consider that during the freeze-drying step not all water
Table III
Main characteristics of rf-SPS and APS precursors.
Powder Ca/P ratio D10 (μm) D50 (μm) D90 (μm) D90 – D10
D50 Crystallinity ratio (%) Crystallite size for (002) plan (nm) Crystallite size for (300) plan (nm)
K-SPS 1.62 ± 0.02 2.8 ± 0.1 9.3 ± 0.9 24 ± 3 2.3 70 176 20
Q-SPS 1.66 ± 0.01 1.5 ± 0.02 3.0 ± 0.1 7.6 ± 0.9 2.0 72 n.d. 75
Blocky 1.667 104 ± 1.7 167 ± 3 267 ± 7 1.0 95 255 185
SD 1.667 57.2 ± 3.1 96.8 ± 1.4 154 ± 4 1.0 107 281 208
Fig. 1. XRD of powders: K-SPS, Q-SPS, Spray-dried SD and Blocky.
Fig. 2. FTIR spectra of K-SPS, Q-SPS, SD and Blocky powders.
spectra were collected in the 900–1000 shift range for the surface, and a spot size of 1.2 μm2 in the case of the cross section. As a lot of phases are
possibly present (HA, TTCP, TCP, ACP and OA, Table II), it can be hard to distinguish and dissociate all the bands included in this domain. But since hydroxyapatite is present in much higher proportion, it is easy to isolate it from the others. By calculating the ratio R2 (Eq. (8)), it is
molecules evaporate from the surface of the powder.
The powders for APS have the same crystalline structure (well-crystallized hydroxyapatite) and size (200 nm) but different powder shapes and size distributions. Q and K-SPS powders have similar poorly crystallized non-stoichiometric apatitic structure with nanosized crys-tals but different powder size distributions.
3.2. Rf-SPS and APS coatings 3.2.1. Top-surface analysis
3.2.1.1. Topography. The average area roughness Sa of APS and rf-SPS
coatings was evaluated to be around 12 μm and 6 μm respectively as reported inTable IV. As expected, APS coatings are rougher than rf-SPS coatings due to the large feedstock particles implemented, even though the substrate roughness was equivalent for both techniques. High roughness is usually related to high exposed surface which gives more sites for the proteins and molecules to anchor [23], making the present APS coatings more suitable from this point of view. The Sz and Ssk parameters are similar for both APS-coatings. Even if the particle size and shape of blocky and SD powders can possibly affect the coating topographical characteristics, it was not the case in this study because of the spraying conditions which have been developed by the company to produce very similar coatings. For rf-SPS coatings, the Sz parameter value is 40% higher with Q suspension compared with K suspension but the skewness Ssk parameter values are alike. The topography of both rf-SPS coatings is therefore very similar except for the Sz value which is sensitive to the relative size of particles vs substrate roughness. Indeed, Q-SPS particles have a diameter 3 times smaller than K-SPS particles and therefore can emphasize substrate topographic defaults and consequently exhibit higher peak-valley (Sz) value. For all coatings (APS or rf-SPS) the Ssk value is either equal to zero or very low which means that the surface topography is homogeneous without distortions like a plateau with peaks or valleys.
SEM images of APS coatings reported onFig. 3a and b show large microstructures, heterogeneous surfaces made of a mixture of fully and partially melted areas with very few cracks compared with rf-SPS coatings, implying that the spraying conditions are better controlled from a thermal point of view. Independently from the feedstock char-acteristics, SD and blocky-powder, the morphology of the APS coating surfaces is very similar. In the case of powder plasma spraying, the mean splats diameters are typically 2 to 6 times [18] larger than the diameter of the CaP droplet before impact. Since the splats are hardly visible and measurable for both coatings, such a correlation with the feedstock particle sizes is complex. OnFig. 3c and d, the surfaces of K-SPS and Q-K-SPS coatings do not show any significant difference. Mi-crocracks are visible on both surfaces, which should be avoided with better control of the preheating temperature of the substrate, to reduce the thermal expansion gradient between the coating and the substrate
[4,42]. Fully molten lamellae are clearly evidenced with sintered-porous zones in between, which contain micrometric to submicrometric particles. Splat diameters are very similar for rf-SPS coatings (averaging 8–9 μm on the upper surface), which means that particles size im-plemented in K-SPS and Q-SPS centered at 3 or 9 μm respectively does not have a significant impact on the surface morphology, as already evidenced by the roughness study. In rf-SPS, it is the CaP droplet size before impact that determines the splat diameters. Conceding that the splat flattening ratio mentioned above for conventional plasma spraying is applicable to rf-SPS, the splat diameters ranging from about 3 to 25 μm could originate from CaP droplets ranging from 0.5 to 12 μm in diameter before impact. These CaP droplets are produced from the suspension atomized drops whose size depends on the suspension (viscosity, suspension density, atomization mode) and the plasma characteristics. Assuming that both suspensions have similar viscosities and undergo an atomization comparable to that of water, drops of ap-proximately 50 μm in diameter should be formed at the output of the probe. For an atomized drop with a 13 wt% solid load (4.3 vol% for stoichiometric hydroxyapatite powder with a density of 3.15 kg/m3),
the final CaP droplets should have a diameter of about 17 μm, which is in the expected range. Fragmentation is expected to be low, as stated in the literature due to the typical slow plasma jet velocity of rf-SPS technique (< 500 m/s) [43]. But calculating the Weber number We, which is the ratio of the impact energy to surface energy (Eq.(9)), with
d1the droplet diameter, urthe gas-liquid relative velocity, ρgthe gas
density and σ1the liquid surface tension, it seems to exceed the limit
value below which fragmentation is absent (We = 14) [18]:
=
We g ru d /2 1 1. (9)
If fragmentation occurs and takes place prior to the CaP particle melting, it may be easier for Q-SPS atomized drops than for K-SPS drops, due to the smaller size of the precursor particles in the case of Q powder. Droplets coming from Q-SPS fragmentation are thus likely to be smaller than their counterpart K-SPS droplets, which confers them a lower kinetic energy and less chances of impacting the substrate. This could explain why K-SPS coating is about 80 μm thick while Q-SPS coating is about 50 μm and why both coatings have similar splat dia-meters.
3.2.1.2. Phases composition. X-ray diffraction data of the surfaces
(Fig. 4) were analysed by Rietveld refinement which allowed the identification and semi-quantification of the crystalline phases (Table IV). The crystallinity ratio is beyond 45% in all coatings and in accordance with the standards. Apatite is detected as being the major crystalline phase, but some other calcium phosphates are identified such as TCP, TTCP, ACP and CaO. Their presence indicates that hydroxyapatite underwent sufficient temperature, thermal exchanges or residence time in the plasma to decompose. The higher the proportion of those phases is, the faster the subsequent quenching was, freezing them in a non-equilibrium state.
Rf-SPS coatings seem to contain about 20 wt% of secondary phases. This value is too high according to the ISO 13779 - part 3 standard which stipulates that each crystalline phase other than hydroxyapatite should not represent > 5 wt% of the total crystalline phases. Calcium Oxide (CaO) is particularly critical since it causes serious damages to coatings when immersed into an aqueous medium because of its volume expansion to 50% resulting from its hydrolysis into Ca(OH)2[37]. All
coatings are compliant in this sense, with however a higher proportion of CaO in rf-SPS coatings. The high crystallinity ratios 93% for K-SPS and 84% for Q-SPS coating, indicate a sufficient heat flux onto the coating during plasma spraying to promote an active annealing of the various deposited CaP phases. For both rf-SPS coatings the proportion of hydroxyapatite is quite the same but K-SPS comprises more TCP (8.5 ± 0.3% for K-SPS and 2.6 ± 0.2% for Q-SPS) while Q-SPS con-tains more TTCP (8.0 ± 0.4% for K-SPS and 15.3 ± 0.3% for Q-SPS).
APS rf-SPS
Powder used Blocky SD K-SPS Q-SPS
Rietveld
refinement Similar coatings with 90% ofHA and few phases other than HA
Less HA than APS, more TTCP in Q-SPS and more TCP in K-Q-SPS coatings Porosity (%) 15.8 ± 2.4 19.4 ± 3.1 14.4 ± 3.0 19.3 ± 4.2 Thickness (μm) 137 ± 15 112 ± 20 78 ± 12 46 ± 21 Roughness Sa (μm) 11.9 ± 0.6 12.5 ± 0.4 6.3 ± 0.8 6.3 ± 0.2 Sz (μm) 122 ± 18 127 ± 15 125 ± 45 176 ± 28 Ssk ≈0.1 ≈−0.1 ≈0.8 ≈0.9 Table IV
This could be on one hand the consequence of the Ca/P ratio of the respective powders, since the diagram of the quasi-binary CaO-P2O5
-(H2O) system stipulates that for a Ca/P ratio of 1.62 in equilibrium state
at room temperature, K-SPS powder should be composed of a mixture of HA and TCP [44,45]. Nevertheless, some phosphorus is always evapo-rated during the process [9,12], which should bring the ratio of the related coating a little closer to 1.67. Q-SPS particles have a stoichio-metric Ca/P ratio, which means that the decomposition follows the Eqs.
(1a)-(5)and one could expect that the higher proportion of HA should give less secondary phases than K-SPS powder at the same spraying conditions. But on the other hand, even though they exhibit a stoi-chiometric Ca/P ratio, Q-SPS particles have smaller size than K-SPS particles, making them more sensitive to high temperatures due to their greater exchange surface. As they pass through the plasma, the de-composition of the apatite particles may thus be enhanced [46], ex-plaining the similar HA proportion for both SPS coatings. Evaporation of phosphorus is also to be remembered, as it very likely brought the total Ca/P ratio of Q-SPS coatings over 1.67, favoring the formation of CaO and TTCP at high temperatures. Rietveld refinements reveal a low proportion of amorphous phase ACP in the XRD patterns of K-SPS and Q-SPS coatings in contrast to the amount of the other secondary phases. Since the CaP particles hit the substrate in a highly decomposed/ amorphous state, this either mean that the surface temperature is suf-ficient (at least 600 °C [47]) to allow the partial or total recrystallisation of the amorphous phase into hydroxyapatite, or this could mean that the temperature is high enough (between 1350 °C and 1700 °C) to sustain or even increase the decomposition on the surface, resulting into a larger proportion of TTCP or TCP, while turning ACP into other crystalline phases. Since decomposition of HA happens between 1350 and 1570 °C [2], such a phenomenon can take place and has been al-ready mentioned in other works [48]. Besides, even though the sub-strate is constantly cooled down, the plasma jet can be so elongated that a very high amount of heat can be transferred to the substrate/coating. In contrast to the important transformation of the feedstocks in rf-SPS, APS coatings compositions are compliant with the values sum-moned in standards and were produced in such a way that their crys-talline characteristics were identical. There is few ACP but some TTCP
Fig. 3. Images of surfaces acquired by SEM: (a) Blocky-APS; (b) SD-APS; (c) K and (d) Q SPS-coatings.
Fig. 4. XRD of coatings surfaces obtained by APS and SPS with assignments of
the peaks to the phases.
Table V
Crystalline composition of APS and SPS coatings obtained with Rietveld re-finement of XRD data.
Phases (%) APS APS SPS SPS
Blocky Spray-dried K-SPS Q-SPS HA 91.4 ± 0.4 92.5 ± 0.7 81.3 ± 0.3 80.2 ± 0.3 β-TCP 1.1 ± 0.3 / 0.1 ± 0.2 0.1 ± 0.2 α-TCP 1.2 ± 0.3 1.2 ± 0.5 8.5 ± 0.3 2.6 ± 0.2 TTCP 5.9 ± 0.4 6.1 ± 0.6 8.0 ± 0.4 15.3 ± 0.3 CaO 0.3 ± 0.06 0.2 ± 0.2 1.4 ± 0.06 1.3 ± 0.04 ACP 4.10−2± 0.5 4.10−2± 0.9 0.7 ± 0.7 0.4 ± 0.5 Rw (%) 6.7 7.8 7.4 6.0 Rwnb (%) 16.6 18.8 15.8 12.8 Crystallinity ratio (%) 76 77 93 84
900 900 950 1000 Shifl R� (cm"1) 'C °'
a.
1050b.
____
_
____
___
... 1050 900 950 1000 Shift Raman ( cnt 1) 950 1000 Shift Raman (cm"1)C.
1050d.
1050 Fig. S. Raman spectra of a. blocky-APS, b. SD-APS, c. Q-SPS and d. K-SPS coatings.and TCP are present in very similar proportion, and Cao is almost completely absent. Those coatings present ail the typical characteristics of plasma sprayed coatings with a good control and limitation of the decomposition process. Crystallinity ratios are noticeably the same (76% and 77% for blocky and SD-coatings respectively), but are Jower than in rf-SPS coatings, which may have an incidence on their biolo gical properties since many works highlighted the increased cell pro liferation and adhesion with the crystallinity of the CaP coating [27], not to mention the improvement of in vivo stability.
Typical Raman spectra of ail APS and rf-SPS coatings (Fig. 5) display complementary results from those obtained by XRD. Interestingly, when comparing APS coatings (Fig. Sa and b), more ACP and oxyapatite
are detected in SD-coatings. This suggests that the thermal treatment of the SD powder inside the plasma jet was more advanced with a faster quenching than for the blocky powder, even though XRD patterns show similar crystalline patterns. TTCP phase is not detected, probably hidden by the overlapping of ACP and oxyapatite bands. Raman spectra of rf-SPS coatings (Fig. 5 c and d) show consistent results with XRD, with very distinct peaks attributed to the TTCP phase at 940 and
946 cm -1. ACP and oxyapatite are not detected, or slightly present but in Jower proportion than TTCP, which highlights the amorphous character of the APS coatings compared with SPS-coatings, accordingly to the crystallinity ratio but not to the Rietveld refinements values. XRD
is not suited to evaluate the proportion of amorphous phase compared to Raman spectroscopy, thus the latter technique is preferred.
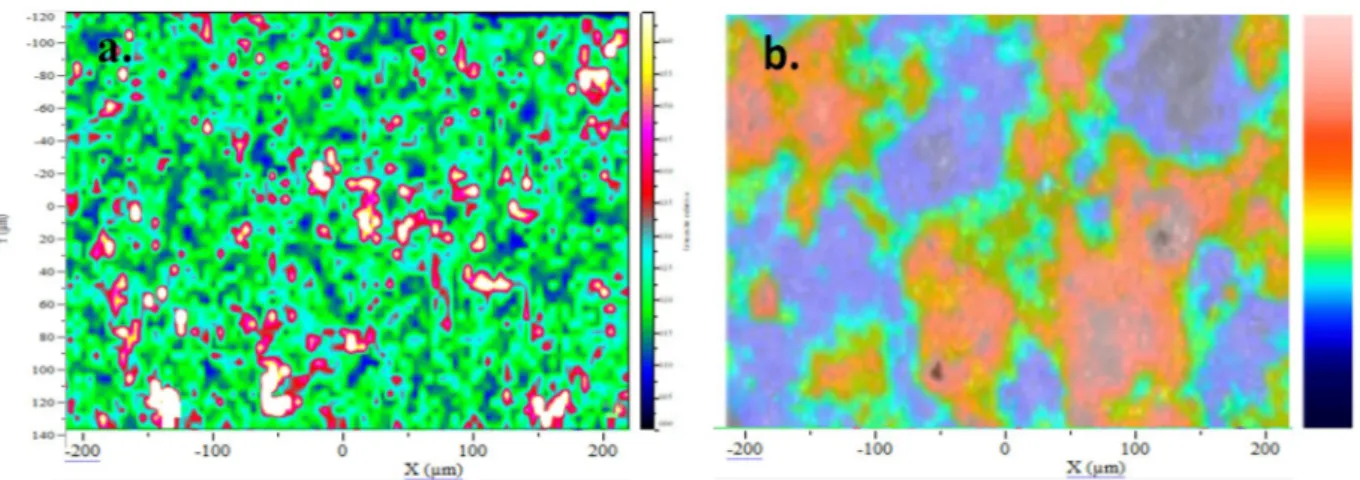
3.2.1.3. Superimposition of phases cartography and topography. Both K SPS and Q-SPS Raman cartographies were superimposed with the topography of the same area obtained by optical profilometry, to see a possible correlation between the coating topography and its composition. The yellow/white spots on the Raman mapping indicate a high proportion of hydroxyapatite while the blue ones indicate a Jower proportion. Although some areas contain more hydroxyapatite than others, no direct correlation with specific areas of the topography (either valleys, peaks or plateau) could be established by superimposing the Raman cartography of K-SPS coating with its profilometry map in Fig. 6. The areas containing a similar amount of hydroxyapatite cover from a few to about 50 µm2. They could Jikely represent a splat and
highlight the various thermal treatments undergone by the particles within the plasma. This analysis evidences the composition heterogeneity of hydroxyapatite plasma-sprayed coatings.
3.2.2. In coating morphology and microstructure
3.2.2.1. Thickness and porosit:y. Thickness was in the same range of values for both APS coatings, but blocky-coatings were slightly thicker than SD-coatings (137 µm
±
15 and 112 µrn±
20 respectively, Fig. 7c and d). This in consistent with the fact that blocky powder is denser than spray-dried powder: for the same spraying conditions, a fewer Joss of material occurs due to a higher inertia. Overall, rf-SPS coatings made with K-SPS powder are 1.7 times thicker (around 80 µm, Fig. 7 a) than those made with Q-SPS powders (-45 µm, Fig. 7 b).Ail the deposited coatings have total porosity values quite similar to those determined by image analysis. But SD-APS and Q-SPS coatings are
slightly more porous (19.4
±
3.1% and 19.3±
4.2% respectively)than Blocky-APS and K-SPS (15.8
±
2.4% and 14.4±
3.0% respectively). These results must be considered carefully since they strongly depend on the image analysis protocol including cross-sections pre paration. Nevertheless, it remains relevant to compare them, and it seems that for both plasma spray techniques, the thicker coating is also the denser.
3.2.2.2. In-thickness microstructure. Both rf-SPS coatings appear to be
homogenously structured with splats of about O. 7 µm
±
0.2 thick(Table V, Fig. 7a and b), but K-SPS coating is denser and some semi molten particles are \-isible in Q-SPS coating, conferring a granular
bimodal structure [49]. Many hydroxyapatite plasma-sprayed coatings
have already shown a granular structure [50], indicating that some
particles are not fully molten during spraying. EDS analysis showed that grey areas present in the coating are composed of calcium phosphates. But since the signal of calcium, oxygen and phosphorus is weaker in these areas than in white ones, one can conclude that the density is Jower, explaining this darker shade. The white/dense areas are made of crystalline hydroxyapatite and decomposition phases, while grey/ porous areas are unmolten hydroxyapatite particles. The presence of those unmolten zones can be related to the precursor particle size and density. As mentioned before, small particles are Jess efficiently
accelerated by the gas than large ones. Therefore their impact on the substrate is softer, and the particles tend to retrieve their granular structure due to high surface tension that takes over before the solidification occurs [21]. These granular zones have a diameter equal or below 6 μm in the case of Q-SPS coating. It represents 3 times less the volume of the initial atomized drop being around 17 μm, which not only confirms the fragmentation phenomenon but also shows that the use of Q-SPS suspension enables the formation of smaller CaP droplets than K-SPS suspension. The granular structure may also be due to the high reactivity of small particles to the thermophoresis force caused by the thermal gradient inside the plasma. They are ejected to the coldest temperatures and solidified before the impact on the surface. In contrast APS coatings (Fig. 7c and d) display much larger microstructure features than rf-SPS coatings as expected. Both coatings contain fully and partially melted zone as well, which reflect the non-uniformity of the plasma thermal treatment of powders. Splats are from
2.2 to 19 μm and from 1.8 to 17 μm thick in the case of blocky and SD-APS coatings respectively. The Blocky-coating exhibits a few more unmolten parts, which could be attributed to the larger particle mean diameter and density.
The cross-section Raman cartography of the K-SPS coating (Fig. 8) displays a more distinct presence of HA nearby the top surface, de-creasing as it gets closer to the substrate. This is in agreement with what is usually noticed in HA plasma sprayed coatings [2,12]. Indeed, as the molten material impacts the cooled substrate, it quenches and main-tains the high temperature phases due to HA decomposition. As the calcium phosphate is deposited, the previously deposited layers form an insulating layer due to their characteristic low thermal conductivity. The calcium phosphate lamellae retain more thermal energy by being gradually more isolated from the cooled substrate and can thus recover their most stable structure that is hydroxyapatite. This could explain why K are better crystallized than Q-SPS coatings: their larger thickness
Fig. 6. a. Raman cartography of the R2ratio and b. topography of the same area of 440 × 265 μm2, for K-SPS coating (valleys in blue, peaks in red).
constitutes a more efficient thermal barrier against the cooled substrate. Zhang et al. [48] showed that depending on the spraying distance, TCP and TTCP could appear on the substrate during the process. The sub-strate temperature thus needs to be adjusted and controlled in such a way that the particles are neither drastically quenched nor led to fur-ther decomposition. The presence of fractures on the surface and at the substrate-coating interface supports the 2nd hypothesis because it re-quires a very high thermal dilatation to reach this level of mechanical stress. The same trend has been commonly observed with Q-SPS coating, both APS coatings in this study and more generally in other works [4].
4. Conclusions
In the present study, two different precursors noted K-SPS and Q-SPS were synthesized to formulate suspensions to be implemented in rf-SPS. Although these particles have a similar crystallinity ratio around 70%, the former is deficient in calcium with a crystallite size of about 20 nm and a grain size centered at 9 μm while the latter is stoichio-metric with a crystallite size of about 70 nm and a grain size centered at 3 μm. The results showed that the crystallinity ratios of rf-SPS coatings are as high as 93% in contrast to the 75% currently achieved for APS coatings. The Ca/P ratio of the precursors influenced the proportion of TTCP (from 8 to 15%) and TCP (from 2.6 to 8.5%) crystalline secondary phases which are in both rf-SPS coatings around 20% in total. In comparison, the amount of hydroxyapatite in APS coatings is around 90%. Therefore rf-SPS allows producing highly crystallized nanos-tructured coatings, disclosing the possible control of their biological behavior. The precursor size distribution was shown to be a decisive parameter for APS but not for rf-SPS coatings, whose microstructures were more influenced by the size of the atomized suspension drops. Finally, the heterogeneous distribution of the phases on the surface of rf-SPS coatings was demonstrated by Raman cartography, which could be of major interest for understanding the anchoring of proteins and cells onto the implant surface.
Acknowledgements
This work is supported by the Agence Nationale de la Recherche of France under project named ARCHICAP (ANR-15-CE19-0021) and the Région Occitanie in France under project named REVAMITIC (CLE).
References
[1] Registre canadien des remplacements articulaires (RCRA), Arthroplasties de la hanche et du genou au Canada, Rapport annuel de 2014–2015, 2015http://ovidsp. ovid.com/ovidweb.cgi?T=JS&PAGE=reference&D=emed9&NEWS=N&AN= 38724890.
[2] I. Demnati, D. Grossin, C. Combes, C. Rey, Plasma-sprayed apatite coatings: review of physical-chemical characteristics and their biological consequences, J. Med. Biol. Eng. 34 (2014) 1–7,https://doi.org/10.5405/jmbe.1459.
[3] R.A. Surmenev, A review of plasma-assisted methods for calcium phosphate-based coatings fabrication, Surf. Coat. Technol. 206 (2012) 2035–2056,https://doi.org/ 10.1016/j.surfcoat.2011.11.002.
[4] R.B. Heimann, Plasma-sprayed hydroxylapatite-based coatings: chemical, me-chanical, microstructural, and biomedical properties, J. Therm. Spray Technol. 25 (2016) 827–850,https://doi.org/10.1007/s11666-016-0421-9.
[5] R.B. Heimann, Osseoconductive and corrosion-inhibiting plasma-sprayed calcium phosphate coatings for metallic medical implants, Metals (Basel, Switz.) 7 (2017) 1–19,https://doi.org/10.3390/met7110468.
[6] FDA, Guidance for Industry and FDA Staff Non-clinical Information for Femoral Stem Prostheses, 16 (2007)http://www.fda.gov/medicaldevices/
deviceregulationandguidance/guidancedocuments/ucm071275.htm.
[7] M.R. Mucalo, Hydroxyapatite (HAp) for Biomedical Applications, (2015),https:// doi.org/10.1016/C2013-0-16440-9.
[8] Y.C. Tsui, C. Doyle, T.W. Clyne, Plasma sprayed hydroxyapatite coatings on tita-nium substrates. Part 2: optimisation of coating properties, Biomaterials 19 (1998) 2031–2043,https://doi.org/10.1016/S0142-9612(98)00104-5.
[9] K.A. Gross, C.C. Berndt, Thermal processing of hydroxyapatite for coating pro-duction, J. Biomed. Mater. Res. 39 (1998) 580–587.
[10] S. Overgaard, Calcium phosphate coatings for fixation of bone implants: evaluated mechanically and histologically by stereological methods, Acta Orthop. Scand. 71 (2000) 1–74,https://doi.org/10.1080/000164700753759574.
[11] D.E. Macdonald, F. Betts, M. Stranick, S. Doty, A.L. Boskey, Physicochemical study of plasma-sprayed hydroxyapatite-coated implants in humans, J. Biomed. Mater. Res. 54 (2001) 480–490.
[12] R.B. Heimann, Tracking the thermal decomposition of plasma-sprayed hydro-xylapatite, Am. Mineral. 100 (2015) 2419–2425.
[13] S.R. Radin, P. Ducheyne, The effect of calcium phosphate ceramic composition and structure on in vitro behavior. I. Dissolution, J. Biomed. Mater. Res. 27 (1993) 25–34,https://doi.org/10.1002/jbm.820270106.
[14] S.R. Radin, P. Ducheyne, Plasma spraying induced changes of calcium phosphate ceramic characteristics and the effect on in vitro stability, J. Mater. Sci. Mater. Med. 3 (1992) 33–42,https://doi.org/10.1007/BF00702942.
[15] T.J. Webster, C. Ergun, R.H. Doremus, R.W. Siegel, R. Bizios, Enhanced functions of osteoblasts on nanophase ceramics, Biomaterials 21 (2000) 1803–1810. [16] M. Roy, A. Bandyopadhyay, S. Bose, Induction plasma sprayed nano hydroxyapatite
coatings on titanium for orthopaedic and dental implants, Surf. Coat. Technol. 205 (2011) 2785–2792,https://doi.org/10.1016/j.surfcoat.2010.10.042.
[17] E. Bouyer, F. Gitzhofer, M.I. Boulos, Suspension plasma spraying for hydroxyapatite powder preparation by RF plasma, IEEE Trans. Plasma Sci. 25 (1997) 1066–1072, https://doi.org/10.1109/27.649627.
[18] P.L. Fauchais, J.V.R. Heberlein, M.I. Boulos, Thermal Spray Fundamentals, Springer, Kindle, 2014,https://doi.org/10.1007/978-0-387-68991-3.
[19] L. Pawlowski, Suspension and solution thermal spray coatings, Surf. Coat. Technol. 203 (2009) 2807–2829,https://doi.org/10.1016/j.surfcoat.2009.03.005. [20] H. Li, K.A. Khor, P. Cheang, Effect of steam treatment during plasma spraying on the
microstructure of hydroxyapatite splats and coatings, Proc. Int. Therm. Spray Conf. 15 (2006) 610–616,https://doi.org/10.1361/105996306X146938.
[21] P. Fauchais, Suspension and solution plasma spraying, J. Phys. D. Appl. Phys. 46 (2013),https://doi.org/10.1088/0022-3727/46/22/22401514 pp..
[22] N. Atsuchi, T. Watanabe, Numerical Modeling of Non-equilibrium Argon-Oxygen Induction Plasmas under Atmospheric Pressure, Asian Pacific Confed. Chem. Eng., 2004, pp. 1–10.
[23] K. Wang, C. Zhou, Y. Hong, X. Zhang, A Review of Protein Adsorption on Bioceramics, 2 Interface Focus, 2012, pp. 259–277,https://doi.org/10.1098/rsfs. 2012.0012.
[24] R.B. Heimann, Structure, properties, and biomedical performance of osteoconduc-tive bioceramic coatings, Surf. Coat. Technol. 233 (2013) 27–38,https://doi.org/ 10.1016/j.surfcoat.2012.11.013.
[25] N. Aebli, J. Krebs, H. Stich, P. Schawalder, M. Walton, D. Schwenke, H. Gruner, B. Gasser, J.C. Theis, In vivo comparison of the osseointegration of vacuum plasma sprayed titanium- and hydroxyapatite-coated implants, J. Biomed. Mater. Res., Part A 66 (2003) 356–363,https://doi.org/10.1002/jbm.a.10508.
[26] D. Buser, R.K. Schenk, S. Steinemann, J.P. Fiorellini, C.H. Fox, Influence of surface characteristics on bone integration of titanium implants: a histomorphometric study in miniature pigs, J. Biomed. Mater. Res. 25 (1991) 889–902.
[27] R.A. Surmenev, M.A. Surmeneva, A.A. Ivanova, Significance of calcium phosphate coatings for the enhancement of new bone osteogenesis - a review, Acta Biomater. 10 (2014) 557–579,https://doi.org/10.1016/j.actbio.2013.10.036.
[28] P. Ducheyne, Comprehensive Materials, Elsevier Science, 2011.
[29] S. Kannan, J.M.F. Ferreira, Synthesis and thermal stability of hydroxyapatite-β-tricalcium phosphate composites with cosubstituted sodium, magnesium, and fluorine, Chem. Mater. 18 (2006) 198–203,https://doi.org/10.1021/cm051966i. [30] N.S. Al-Qasas, S. Rohani, Synthesis of pure hydroxyapatite and the effect of
synthesis conditions on its yield, crystallinity, morphology and mean particle size, Sep. Sci. Technol. 40 (2005) 3187–3224,https://doi.org/10.1080/
01496390500385400.
[31] International standard ISO_13779, Implants for Surgery – Hydroxyapatite – Part 3: Chemical Analysis and Characterization of Crystallinity and Phase Purity, (2008). [32] Internation standard ISO_13779, Implants for Surgery – Hydroxyapatite – Part 2:
Coatings of Hydroxyapatite, (2008).
[33] J. Zhao, J. Zhao, J. Chen, X. Wang, Z. Han, Y. Li, Rietveld refinement of hydro-xyapatite, tricalcium phosphate and biphasic materials prepared by solution com-bustion method, Ceram. Int. 40 (2014) 3379–3388,https://doi.org/10.1016/j. ceramint.2013.09.094.
[34] L. Keller, W.A. Dollase, X-ray determination of crystalline hydroxyapatite to amorphous calcium- phosphate ratio in plasma sprayed coatings, J. Biomed. Mater. Res. 49 (2000) 244–249,https://doi.org/10.1002/(SICI)1097-4636(200002) 49:2<244::AID-JBM13>3.0.CO;2-H.
[35] C. Rey, O. Marsan, C. Combes, C. Drouet, D. Grossin, S. Sarda, Characterization of calcium phosphates using vibrational spectroscopies, Adv. Calcium Phosphate Biomater. (2014),https://doi.org/10.1007/978-3-319-02904-7.
[36] K. Geels, D.B. Fowler, W.-U. Kopp, M. Rückert, Material/Preparation
Tables—Methods C-01/T-01 to C-68/T-68, Metallogr. Mater. Specim. Prep. Light Microsc. Image Anal. Hardness Test., 2006, pp. 223–226https://books.google.cl/ books?id=oaehZy3Vo1kC.
[37] I. Demnati, M. Parco, D. Grossin, I. Fagoaga, C. Drouet, G. Barykin, C. Combes, I. Braceras, S. Goncalves, C. Rey, Hydroxyapatite coating on titanium by a low energy plasma spraying mini-gun, Surf. Coat. Technol. 206 (2012) 2346–2353, https://doi.org/10.1016/j.surfcoat.2011.10.025.
[38] P.S. Prevéy, X-ray diffraction characterization of crystallinity and phase composi-tion in plasma-sprayed hydroxyapatite coatings, J. Therm. Spray Technol. 9 (2000) 369–376,https://doi.org/10.1361/105996300770349827.
[39] L. Berzina-Cimdina, N. Borodajenko, Research of Calcium Phosphates Using Fourier Transform Infrared Spectroscopy, Infrared Spectrosc. – Mater. Sci. Eng. Technol., 2012, pp. 123–148,https://doi.org/10.5772/36942.
[40] S. Koutsopoulos, Synthesis and Characterization of Hydroxyapatite Crystals: a Review Study on the Analytical Methods, Wiley Period. Inc., 2002, pp. 31–34, https://doi.org/10.1002/jbm.10280.
[41] S. Raynaud, E. Champion, D. Bernache-Assollant, P. Thomas, Calcium phosphate
[42] Y.C. Tsui, C. Doyle, T.W. Clyne, Plasma sprayed hydroxyapatite coatings on tita-nium substrates. Part 1: mechanical properties and residual stress levels, Biomaterials 19 (1998) 2015–2029,https://doi.org/10.1016/S0142-9612(98) 00103-3.
[43] P. Fauchais, M. Vardelle, J.F. Coudert, A. Vardelle, C. Delbos, J. Fazilleau, Thermal plasma deposition from thick to thin coatings and from micro- to nanostructure, Pure Appl. Chem. 77 (2005) 475–485,https://doi.org/10.1351/pac200577020475. [44] S. Ramesh, C. Tan, M. Hamdi, I. Sopyan, W. Teng, The Influence of Ca/P Ratio on the Properties of Hydroxyapatite Bioceramics, 6423 Proc. SPIE - Int. Soc. Opt. Eng., 2007,https://doi.org/10.1117/12.779890.
[45] M.T. Carayon, J.L. Lacout, Study of the Ca/P atomic ratio of the amorphous phase in plasma-sprayed hydroxyapatite coatings, J. Solid State Chem. 172 (2003) 339–350,https://doi.org/10.1016/S0022-4596(02)00085-3.
[46] R. Kumar, P. Cheang, K.A. Khor, RF plasma processing of ultra-fine hydroxyaptite powders, J. Mater. Process. Technol. 113 (2001) 456–462,https://doi.org/10. 1016/S0924-0136(01)00611-2.
[47] R. Kumar, P. Cheang, K.A. Khor, Phase composition and heat of crystallisation of amorphous calcium phosphate in ultra-fine radio frequency suspension plasma sprayed hydroxyapatite powders, Acta Mater. 52 (2004) 1171–1181,https://doi. org/10.1016/j.actamat.2003.11.016.
[48] C. Zhang, H. Xu, X. Geng, J. Wang, J. Xiao, P. Zhu, Effect of spray distance on microstructure and Tribological performance of suspension plasma-sprayed hy-droxyapatite – titania composite coatings, J. Therm. Spray Technol. 25 (2016) 1255–1263,https://doi.org/10.1007/s11666-016-0453-1.
[49] P. Fauchais, G. Montavon, G. Bertrand, From powders to thermally sprayed coat-ings, J. Therm. Spray Technol. 19 (2010) 56–80, https://doi.org/10.1007/s11666-009-9435-x.
[50] R.T. Candidato, P. Sokołowski, L. Łatka, S. Kozerski, L. Palowski, A. Denoirjean, Plasma spraying of hydroxyapatite coatings using powder, suspension and solution feedstocks, Weld. Technol. Rev. 87 (2015) 64–71.
apatites with variable Ca/P atomic ratio I. Synthesis, characterisation and thermal stability of powders, Biomaterials 23 (2002) 1065–1072, https://doi.org/10.1016/ S0142-9612(01)00218-6.