COLLABORATIVE GRAPHICAL USER
INTERFACE DESIGN
By
MAS
Hermawan Kamili
B.S. Civil & Environmental Engineering University of Washington, 1999
;SACHUSETTS INSTITUTESACHUISETTS INSTITUTE OF TECHNOLOGY
MAY 3 0 2000
LIBRARIES
Submitted to the Department of Civil & Environmental Engineering In Partial Fulfillment of the Requirement for the Degree of
Master of Engineering
In Civil & Environmental Engineering at the Massachusetts Institute of Technology
June 2000
@ 2000 Hermawan Kamili All Rights Reserved.
The author hereby grants to MIT permission to reproduce and to distribute publicly paper and electronic copies of this thesis for the purpose of other works
Signature of Author
Department of Civil & Environmental Engineering May 5, 2000
Certified by , , - -,
-Professor Feniosy Pena-Mora Associate Professor, Civil and Environmental Engineering Thesis Supervisor
Accepted by
Professor Daniele Veneziano Chairman, Department Committee on Graduate Studies
COLLABORATIVE GRAPHICAL USER
INTERFACE DESIGN
By
Hermawan Kamili
Submitted to the Department of Civil & Environmental Engineering In Partial Fulfillment of the Requirement for the Degree of
Master of Engineering
In Civil & Environmental Engineering Massachusetts Institute of Technology
Abstract
Graphical user interfaces are means of interaction between the user and system. It is important to create a graphical user interface that serves increase user productivity.
the computer to effectively
Collaborative Graphical User Interface Design (CGUID) is a method that combines the incremental software development model and team collaboration process. During the incremental software development process, each phase generates products that serve as inputs for subsequent phases. Teams in each phase can collaborate to exchange information, to eliminate problems, and to enhance the products' quality.
CGUID method introduces team collaboration in a that value is constantly added until the final goal, a that increase productivity, is created.
continuously development phase so high usable graphical user interfaces
Thesis Supervisor: Feniosky Penia-Mora
Acknowledgement
I would like to thank the following individuals for their contributions to my learning at Massachusetts Institute of Technology.
To my parents for their support throughout my educational career.
To Professor Feniosky Pena-Mora for his time and effort in reviewing and commenting this thesis.
To Alan Ng, Steve Kyauk, Teresa Liu, Nhi Tan, Erik Abbot, Wassim El-Solh, Paul Wong, Saeyoon Kim, Kenward Ma, Ivan Limansky, and Kaissar Gemayel for making the Information Technology track was a success.
Finally to all Masters of Engineering students, the Class of 2000, for making me believe that I can achieved all my goals at MIT and beyond.
Table of Content
CHAPTER 1...8 1.1 DESCRIPTION... 8 1.2 METHODOLOGY ... 9 1.3 O UTLINE... 10 CHAPTER 2...11 2.1 INTRODUCTION... 112.2 BUSINESS ADVANTAGES OF GUI... 12
2.3 GRAPHICAL USER INTERFACE... 15
2.4 SUMMARY ... 21
CHAPTER 3...22
3.1 INTRODUCTION ... 22
3.2 SOFTWARE DEVELOPMENT MODEL... 27
3.3 USER CENTERED DESIGN... 30
3.4 SUMMARY ... 31
CHAPTER 4...33
4.1 INTRODUCTION ... 33
4.2 COLLABORATION IN THE ANALYSIS PHASE ... 34
4.3 REQUIREMENT ANALYSIS ... 37
4.4 TASK MODELING... 40
4.5 SUMMARY ... 44
CHAPTER 5...46
5.1 INTRODUCTION ... 46
5.2 COLLABORATION IN THE DESIGN PHASE ... 47
5.3 USER OBJECT MODELING... 49
5.4 STYLE MODELING... 52
5.5 GUI DESIGN ... 55
5.6 SUM MARY ... 58
CHAPTER 6 ... 60
6.1 INTRODUCTION ... 60
6.2 COLLABORATION IN THE CONSTRUCTION PHASE... 61
6.3 GUI PROTOTYPING... 62
6.4 GUI TESTING... 63
CHAPTER 7...67
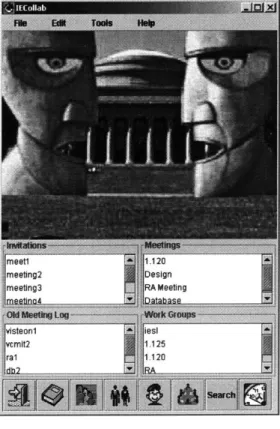
7.1 INTRODUCTION: MEETING MANAGEMENT TOOL ... 67
7.2 IECOLLAB REQUIREMENT ANALYSIS - STUDY CASE... 68
7.3 IECOLLAB GUI DESIGN... 74
7.4 IECOLLAB GUI DEVELOPMENT... 80
7.5 SUMMARY ... 85
CHAPTER 8 ... 86
8.1 INTRODUCTION: COLLABORATIVE GUI ... 86
8.2 PROBLEMS DATA COLLABORATION ... 87
8.3 TECHNOLOGY FOR COLLABORATIVE GUI ... 89
8.4 SUMMARY ... 92
Ch 9 / pgs.94 - 95 have bben ommitted. CHAPTER 9... 94
List of Figures
Figure 2-1 GUI vs CUI in Proficiency... 13
Figure 2-2 Return of investment on GUI ... 14
Figure 2-3 GUI's Elements ... 16
Figure 2-4 GUI as an Application ... 17
Figure 2-5 W ebpage... 18
Figure 2-6 GUI with Java ... 20
Figure 2-7 GUI with JavaScript... 21
Figure 3-1 Collaboration Graphical User Interface Design Concept... 22
Figure 3-2 Collaboration Graphical User Interface Design... 22
Figure 4-1 Requirement Analysis ... 33
Figure 4-2 Task Modeling... 34
Figure 4-3 Arousal Performance Relationship ... 40
Figure 4-4 Task Model... 42
Figure 4-5 Task Table... 43
Figure 4-6 Task Scenario ... 44
Figure 5-1 Object Modeling ... 46
Figure 5-2 Style Modeling ... 47
Figure 5-3 GUI Design ... 47
Figure 5-4 Example of object, attributes, and action ... 51
Figure 5-5 Relationship Table... 52
Figure 5-6 W indow Hierarchy ... 55
Figure 6-1 GUI Prototyping ... 60
Figure 6-2 GUI Testing ... 61
Figure 7-1 Requirement Analysis Recommendation for the Main W indow... 75
Figure 7-2 New Designed Main W indow... 76
Figure 7-3 Schedule Meeting W indow Design... 77
Figure 7-4 ieCollab Main W indow ... 83
Figure 7-5 ieCollab Create Meeting W indow ... 84
Figure 7-6 ieCollab Edit Meeting W indow ... 84
Figure 8-1 W eb W rapper Technology... 90
Figure 8-2 Context Mediation Engine ... 91
List of Tables
Table 3-1 CGUID Components ... 23
Table 3-2 Products of Collaborative Graphical User Interface Design ... 24
Table 3-3 Collaborating Teams... 28
Table 4-1 Analysis Team ... 35
Table 5-1 Design Team ... 48
Table 5-2 Dynamic Modeling ... 52
Table 5-3 8 Golden Rules in Design Principles by Shneiderman ... 52
Table 6-1 Construction Team ... 61
Table 7-1 ieCollab User Profile ... 69
Table 7-2 User Case for Schedule Meeting ... 73
Chapter 1 - Introduction
Chapter 1
Introduction
1.1
Description
User Interfaces (UI) allow human users to interact with computer systems. They are the media to communicate with and perform tasks on the computer systems. Without user interfaces, users have no access to the interior of the computer systems.
Typical user interfaces in the routine information systems include the computer hardware such as keyboards, mouses, computer monitors, and on/off switch. Another type of for user interface is the image display on computer monitors such as windows, menus, and message dialogs. This image display, then, is known as Graphical User Interface (GUI).
Research in Xerox Palo Alto evaluated GUIs which replaced the character display and command line of the 1980's, with large bit-mapped display, icon, multiple windows, and pointing devices called a mouse [Peddie, 1992]. The result of research showed that people could learn to use application with a graphical interface more quickly than with command lines. The graphical interfaces were also easier to remember, and helped users become more productive.
As times continued, graphical user interfaces did not just appear in the form of software application. In the beginning of 1990's, a new technology, called the Internet, enabled new forms of graphical user interfaces through Web pages.
Chapter 1- Introduction
Utilized through as applications and Web pages, the graphical user interfaces play an important role in adding value to businesses, while increasing productivity.
This thesis shows how to design graphical user interfaces, which serve as tools whose purpose to effectively increase productivity.
1.2
Methodology
Collaborative Graphical User Interface Design (CGUID) arises form the author's experience in the ieCollab project. The author also uses fundamentals of Graphical User Interfaces Design and
Evaluation (GUIDE) process invented by David Redmond-Pyle and Alan Moore.
In the ieCollab project, a project held by the Information Technology program in the Department of Civil & Environmental Engineering at MIT, the author learned about the collaboration process with distributed teams in software development.
The GUIDE process, on the other hand, introduces the connectivity of several lower level design stages and the interaction of each stage with other stages. The lower level design stages consist of Analysis, Task Modeling, Style Modeling, Object Modeling, GUI Designing, GUI Prototyping, and GUI Testing. The notion of connectivity arises when each design stages create outputs that will be used as inputs for other design stages. For example the analysis stages will create user task that will become an input for Object Modeling, other lower level design stages.
Each lower-level design stage is associated with high-level design stages. Requirement Analysis and Task Modeling are associated with Analysis Phase. Object Modeling, Style Modeling, and GUI Design are associated with Design Phase. Finally, GUI Prototyping and GUI Testing are associated with Construction Phase.
CGUID combines the learning of collaboration process in ieCollab project and graphical user interfaces development using GUIDE process. It explains how collaboration between teams can be implemented in the GUIDE to create a graphical user interface for increasing productivity.
Chapter 1 - Introduction
1.3
Outline
Chapter 2 is an overview about the types of graphical user interface. Chapter 3 is the guideline for graphical user interface design. In Chapter 4 through 6 describes the higher level design methods of analysis, design and construction.
The following two chapters (Chapter 7 & 8) are about the case study of ieCollab GUI development process and future development in graphical user interface.
Chapter 2 - Overview of Graphical User Interface
Chapter 2
Overview of Graphical User Interface
2.1
Introduction
Graphical User Interface was envisioned by Van-nevar Bush in 1945 [Peddie, 1992]. The development of GUI continued when Ivan Sutherland designed Sketchpad in the early 1960s for his graduate thesis [Peddie, 1992].
From the 1950s to the 1970s, scientists at the Stanford Research Institute (SRI) and Xerox Palo Alto Research Center (PARC) investigated the interactive user interface [Peddie, 1992]. The results showed that people learned to use applications with a GUI more quickly than learning command lines. GUI increase productivity, plain, and simple. GUI reduce the time a user spent
resolving interface issue, which allows the user to perform tasks more efficiently.
It was not until 1984, when Apple introduced the Macintosh, that the window environment reached the average consumer. The Macintosh GUI has changed the users' expectations of a computer interface from being complicated to more friendly tools [Mayhew, 1984].
Chapter 2 - Overview of Graphical User Interface
2.2
Business Advantages of GUI
The main purpose of a graphical user interface is to make the computer more functional for the user. A common graphical user interface is another way of reaching the same goal with several additional benefits. A GUI environment offers familiar symbols or icons that resemble commonly known functions or items such as files and trash cans so that complicated, arcane command line sequence do not have to be memorized [Redmond-Pyle, 1995].
For some pedantic groups, the benefit of using GUI is a debatable issue. However the argument is more like to be preferred issue. For those power users who need the "feel of the machine" and do not mind wasting time trying to figure out the subdirectory structure path, configuration system, having the arcane command line sequences is not a big issue. GUI or nonGUI let the -"may the operating system be with you". However for the rest of novice mere mortals who just want to get to an application, do a little work and go home, GUI is a godsend [Peddie, 1992].
The business climate of 1990s is extremely competitive, and most organizations are seeking to improve their business performance, by implementing strategic programs of Total Quality Management of Business Process Re-engineering. For many organizations, improving the quality of customer service and increasing the productivity of office staff are among the critical business objectives. Software with high usability can make an important contribution to meeting these business needs.
In addition to the quantity of work, there is the quality of work of the user. A well designed GUI can reduce the scope for user errors. Fewer errors provide higher quality of service, and may lead to an increase in productivity, as less time is spent on reconciliation or sorting our consequences.
2.2.1 Learning Curve
High learnability reduces training time and cost, which is often a significant proportion of the installation costs of a new system. In addition to this immediate benefit, it can have a wider commercial significance. Having a system which is easy to learn and easy to use can enable
Chapter 2 - Overview of Graphical User Interface
more flexible staffing practices, as staff moved from one system to another become effective more quickly. More radically, it may be possible for a single member of staff to use several systems, moving between them as required to perform all aspects of a complex task, where previously the work was fragmented between several people using different system. In this way the learnability of a GUI can be critical to the success of a business process re-engineering initiative [Peddie, 1992].
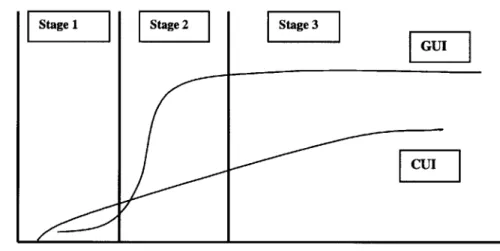
According to survey, a common quote from users and managers on GUIs versus text based system is that a typical GUI-based user works with six applications, while a character-based user (with a Character User Interface or CUI) work with no more than three or four application. This is because the more complex learning curve associated with the CUI. Users gain greater proficiency more quickly with a GUI [Peddie, 1992]. Figure 2-1 describes the difference in proficiency between GUI and CUI users.
Sage 1 Sage 2
Sage 3 E
Proficiency
Stage 1: The user will spend the time to learn about GUI Stage 2: The user will explore and keep train to use GUI Stage 3: The user shows their proficiency to use GUI
Figure 2-1 GUI vs CUI in Proficiency
Source: Peddie, Graphical User Interface and Graphics Standards, 1992
The flexibility of a user interface is also important for business. Most organizations have an on going change in their structure, products and operating procedures, and need software systems
Chapter 2 - Overview of Graphical User Interface
to be flexible to support users changing their business practice. Lack of flexibility either means a barrier to changes, or expenditure on regular amendments to the user interface to maintain competition.
2.2.2 Return on Investment of GUI
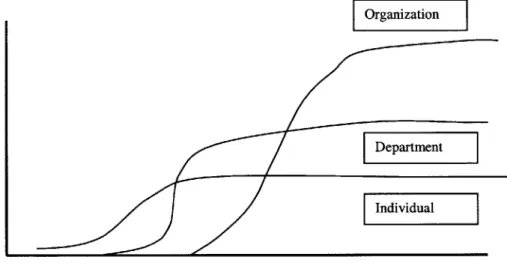
A GUI will enhance the productivity of the individual. Equipping a user with a system that has a GUI is inexpensive relative to an organization's overall cost. As the user gets familiar with the GUI, the productivity will increase rapidly and but eventually taper off. This is knows as the asymptote of productivity. However the organization can see a rapid but limited gain in productivity or return on investment (ROI). Figure 2-2 describes the return of investment of categories in a corporation related to GUI.
Organization
Return on Investment
Time
Figure 2-2 Return of investment on GUI
Source: Peddie, Graphical User Interface and Graphics Standards, 1992
If an entire department is equipped with GUI and true workgroup activities are employed, there will be a greater gain in productivity or ROI. However, the gain does not come as quickly. It takes longer to get the department working smoothly together. Hardware and software costs are obviously greater for a department than for an individual. However, the ROI per employees
Chapter 2 - Overview of Graphical User Interface
is greater than for just the single employee. Also, the ROI curve continues to go up over a longer period of time and it has an asymptote.
When an organization invest in an enterprise-wide implementation of GUIs, it takes even more time and money to see any return. However, the return is almost twice as much per employee, and it continues to increase for a much longer time [Peddie, 1992].
So far, the author has described the advantages of using GUI as easily to use tools. In the next section, the author will describes what types of GUI that are currently available in the context of human interaction tools with computer system, as software applications and web pages.
2.3
Graphical User Interface
Most graphical user interfaces come in the form of software application at its earlier time in 1984 [Peddie, 1992]. Furthermore in the early 90's, the Internet technology was opening a new way of communication [Stein, 1997]. The presentation of graphical user interfaces are not only related to the personal computer applications but also a new type of graphical user interface form that allows a user to communicate to computer system (servers) through Internet. They are called web pages.
In the next section, the author will describes the graphical user interfaces as applications and web pages.
2.3.1 GUI as software application
As a software application, the graphical user interfaces mainly consist of the following elements:
- Windows, which graphically display what the computer is doing.
- On screen menus, that can appear or disappear under pointing-device control.
- Icons, which represent files, directories, application, and utilities.
- Dialog boxes, button, slider, checkboxes, and several other graphical widgets that let the user instructs the computer about what should be done.
Chapter 2 - Overview of Graphical User Interface
Object action paradigm. This is also known as the modeless interactivity where the user indicates the object first and then gives the command.
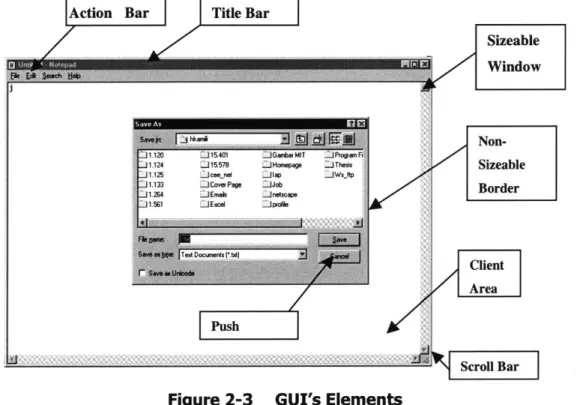
The user can perform their tasks directly on the screen and use the metaphors as help tools. The metaphor is a figure of speech that says the object is created by implicit comparison or analogy. Using metaphors, GUI can be described as an analogy of a person's work. For example analogy of a desk, GUI can use metaphors to represent the idea of desk. The result is called desktop metaphors like described in Figure 2-3.
Figure 2-3 GUI's Elements
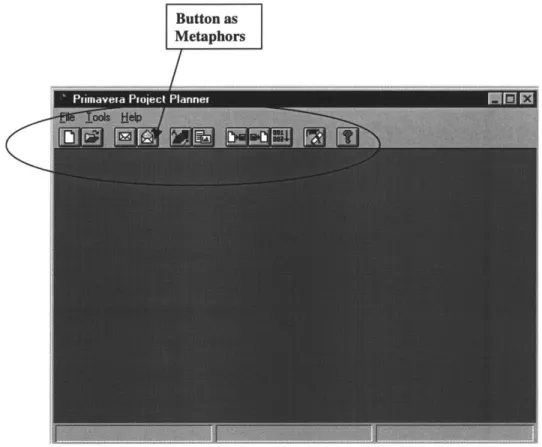
The icons or buttons, as part of the metaphors, briefly describe function or object that can be executed in the applications. The icons and buttons reduce screen space compared to the corresponding textual description of the functions. Also, they can be understood more quickly if it is well designed. Figure 2-4 describes the use of icons as metaphors in GUI as an application.
Overall, the GUI application replicates objects and functions to complete task and portrays them as on different medium, a screen. The user is able to manipulate these objects and functions by accessing and modifying them. Unlike the command line, the graphical user interface allows the
Chapter 2 - Overview of Graphical User Interface
user to concentrate more on the data instead of the application and tools. The physical organization of the application is hidden and not a distraction [Galitz, 1994].
Button as Metaphors
Figure 2-4 GUI as an Application
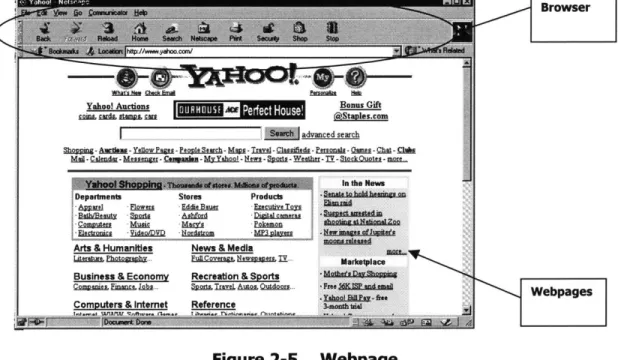
2.3.2 Webpages
The web is represented as numbers of pages (webpages) which can be view with a browser, an application to retrieve information via the various Internet protocols.
As mentioned earlier, a graphical user interface is the means of communication between a human and a computer, the pages communicate a user to a server that support the pages he/she sees. The servers can be in the user's computers, or anywhere else. Therefore technically, a webpage is a graphical user interface. The figure 2-5 shows examples of pages that allow user to communicate the servers through the Internet.
Chapter 2 - Overview of Graphical User Interface
The pages are written in code called High MarkUp Language (HTML). HTML specifies the structure of a document using logical terms such as " level 1 header," "ordered list," and "emphasized text". It does not dictate the appearance of the document such as what typefaces to use or how the line breaks on the page. It is the Web browser's function to handle the actual page layout based on the hardware platform capabilities. The user sees the page after the HTTP is translated into pages by the user's browser. The web page in Figure 2-3 is not the same as an application in the Figures 2-3 and 2-4. The pages only connect the user to other page according to the user request. While the application can perform other tasks, in addition to connecting web pages to web pages.
Browser
Whalfs N Check BEif PesombeN thk
ahoo Aucin nan Gf
LZZMi
OW
am" stay1es corn
. .advanced search
1m -a MYswlages -Pe YhSe oc - Wiaomfiee - uito u ato
Mj1- Calendar- MyssMV gee ~amh- My Yahool- Nes -gy-gfa - We ahe - tock~uotes- more E
In the Ntews
Departments Stores Products
Anweaul Floers Edhes a Eoerdten
beak
Co Qtr Aa cd Q- P aome
COMMI~e" Mssc9 Mara Poke=z IEeca Videa/D!D tixdsoam UIteuia
Arts & Humanities News & Media
Literature.Photogaph.. FulCoverge.Newspers. .. Marketplace
Business & Econom Recreation & Sports n ne 4 s n nn
comanies. Fiane lRhE- 5imQagInd Aut, Outdoors FrtM P and Webpages
Figure 2-5 Webpage
The next section the author will describe the tools to technology current technology that mostly used for creating application and web pages. The prototyping tools for developing an application or composing a webpages are large in number. They vary from their capability and characteristics in developing the graphical user interfaces.
Chapter 2 - Overview of Graphical User Interface
2.3.3 Java and JavaScript
To have an application being accessed through the Internet, a programming language called Java was invented by Sun MicroSystem. Java is a full-featured programming language that is intended for general use as well as for Web programming. Because its coincidence of being invented in the time where Internet is highly used, Java become the language of choice for implementing cross-platform applications for distribution on the Internet [Stein, 1997].
The widely used browser, Netscape and Microsoft Explorer, have the ability to download and execute small Java programs called Java applets. These applet are imbedded inside the HTML. As an application prototyping tool, Java programs create graphical user interface displays and functions such as open their own windows, create menu bars, create animations and pictures on the fly, and even opening connection to its own home server. Although Java is relatively new when compared to other programming language such as C++ and C, it has been used to create useful functions such as image map with animation and sound, interactive buttons, wire-frame model viewer, and online mortgage payment calculator [Stein, 1997]. An example of Java programming application is shown in Figure 2-6.
Chapter 2 - Overview of Graphical User Interface
Beside Java programming, there is another language called JavaScripts. JavaScript is a scripting language that was designed specifically for Netscape browsers. JavaScript is embedded directly in HTML pages using several new and extended HTML tags. When a Netscape browser downloads an HTML page can contains JavaScript codes, it begins to execute the script.
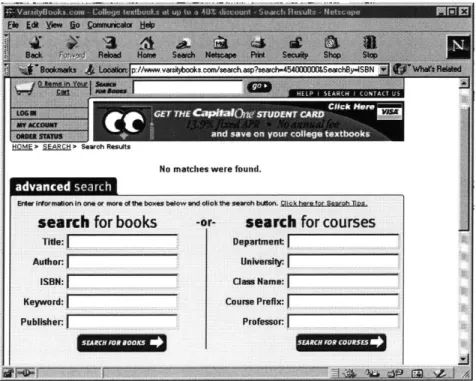
JavaScript is the most useful for creating HTML pages with intelligence. For example, one task at which JavaScript really shines validating fill-out forms: a JavaScript program can quickly scan through the content of a fill-out form to make sure that all required fields are presented and have the right format. If something is wrong with the form, the script can either alert the user if he/she did not fill some field in the form incorrectly [Stein, 1997]. Figure 2-7 shows the pages built with JavaScript.
But Java and JavaScript are not the same. Java is a full programming language and made by Sun Microsystems. JavaScript, on the other hand, is a scripting language that was designed specifically for Netscape browser (version 2.0 and up).
Etr rformation in one or more of te boxes blow and lick te searchbtufn. lok herefor Searoh Tips, search for books -or- search for courses
Title: Department
Author: University:
ISBN: Clans Name:
Keyword: Course Prefix:
Publisher: Professor:
SCH= = 0K ERC O ORE
Figure 2-7 GUI with JavaScript
Chapter 2 - Overview of Graphical User Interface
These are two prototyping tools that are mostly used by the developer and web composer to create graphical user interfaces as applications and web pages.
2.4
Summary
Graphical User Interfaces came from the idea of simplifying human-computer communication. It has the metaphors to do these and the benefit of having the simpler presentation creates higher outcome in learning curve, return of investment, and profitability.
In previous times when the GUI began to be implemented due to its simplicity, the GUI is competing with the command line user interface. However today, most of the applications are rated due to its value to increase the productivity.
Today with the Internet technology, the graphical user interface does not only used to increase productivity, but profitability from the business point of view. For example, a web site with a good presentation invites the buyer to buy products or services from the web site. The better the presentation, easy interaction, of the graphical user interface, the more web surfer feels like spending the money on the web site. Moreover, if the web site has the non-profit purpose to give information to the user, then it has to be equipped with the good graphical presentation so that the user can find the information easily.
The next chapter introduces the idea of GUI design method, CGUID that implements collaboration in low level design steps.
Chapter 3 - Fundamentals of Collaborative Graphical User Interface
Chapter 3
Fundamentals of Collaborative Graphical
User Interface
3.1
Introduction
Collaborative Graphical User Interface Design (CGUID) is the method of combining the software development process and team collaboration model (Figure 3-1).
Collaboration
Model
LII~
Software Development
Process
Figure 3-1 Collaboration Graphical User Interface Design Concept
The software development process introduces the idea of gradual phases - analysis, design, and construction - and how each phase adds value to the software development process. In CGUID, each phase adds value by generating products that will be used by the subsequent phases. With the style of transferring products, each phase interconnects with other phases in order to create the final graphical user interface prototype.
Chapter 3 - Fundamentals of Collaborative Graphical User Interface
Collaboration between teams is the second fundamental in Collaborative Graphical User Interface Design. Collaboration adds value by having each team to contribute their expertises and skills during each of the three phases.
3.1.1 Software Development Process
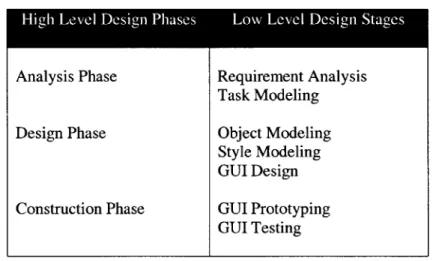
The development process consists of high-level and low-level design elements, which are expressed in Table 3-1.
Table 3-1 CGUID Components
Analysis Phase Design Phase Construction Phase Requirement Analysis Task Modeling Object Modeling Style Modeling GUI Design GUI Prototyping GUI Testing
Requirement Analysis and Task Modeling are associated with the analysis phase (Chapter 4). Object Modeling, Style Modeling, and GUI Design are associated with the design phase (Chapter 5). Finally, GUI Prototyping and GUI Testing are associated with the construction phase (Chapter 6).
The GUI development method that involve the interconnectivity of several low-level elements was first introduced by David Redmond-Pyle and Alan Moore in their GUIDE (Graphical User Interface Design & Evaluation) model in 1997. This model creates the foundation for the Collaborative Graphical User Interface Design method.
The author chose the GUIDE method as the fundamental of CGUID because of the connectivity between the low-level design elements. The output of each low-level design element becomes
Chapter 3 - Fundamentals of Collaborative Graphical User Interface
the input for other low-level design elements. For example, the user profile, a product from the Requirement Analysis, is used as input for Object Modeling and Task Modeling. Thus, each low-level element continuously adds values to other low-low-level elements until they produce the desired graphical user interfaces.
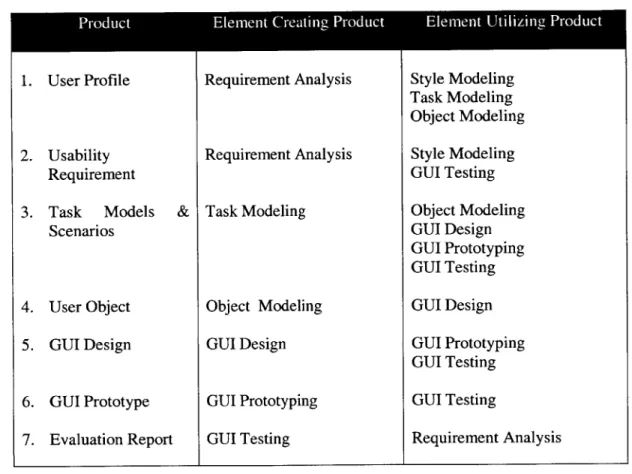
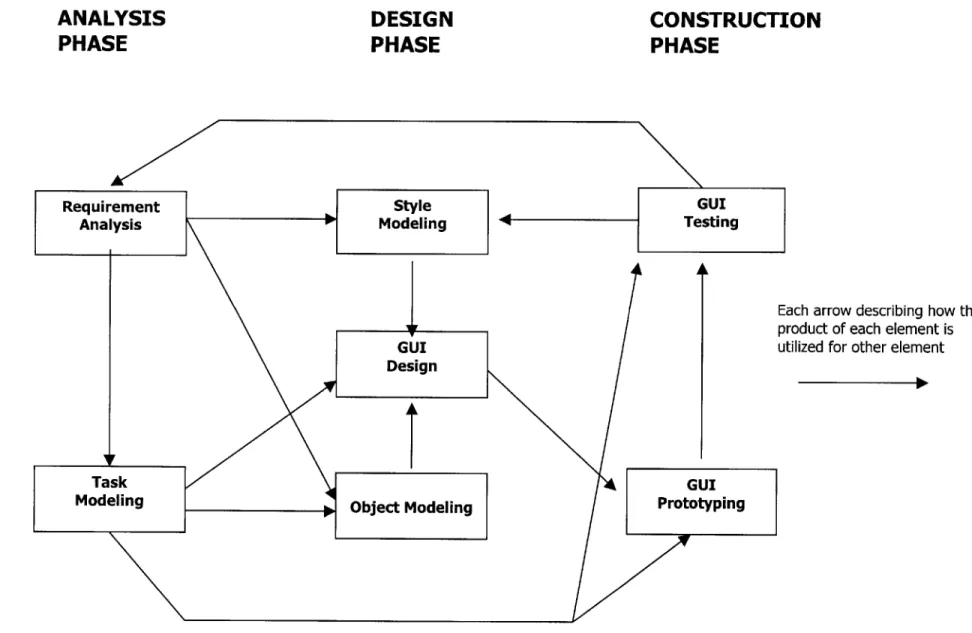
Table 3-2 and Figure 3-2 describe how the interconnectivity works between elements. Table 3-2 Products of Collaborative Graphical User Interface Design
Product Element Creating Product Element Utilizing Product
1. User Profile 2. Usability Requirement 3. Task Models Scenarios & 4. User Object 5. GUI Design 6. GUI Prototype 7. Evaluation Report Requirement Analysis Requirement Analysis Task Modeling Object Modeling GUI Design GUI Prototyping GUI Testing Style Modeling Task Modeling Object Modeling Style Modeling GUI Testing Object Modeling GUI Design GUI Prototyping GUI Testing GUI Design GUI Prototyping GUI Testing GUI Testing Requirement Analysis
In addition to interconnectivity of products from each level design element to other low-level design elements, the CGUID implements the idea of collaboration of teams that involves in each high-level design phase.
The teams, represented as analysis, design, and construction teams, collaborate to exchange knowledge and skills for achieving the high-quality products for each phase. The following section explains the idea of collaboration in more details.
ANALYSIS
PHASE
DESIGN
PHASE
CONSTRUCTION
PHASE
Each arrow describing how the
product of each element is utilized for other element
Chapter 3 - Fundamentals of Collaborative Graphical User Interface
3.1.2 Collaboration Model
Collaboration is the process of shared creation: two or more individuals with complementary skills interacting to create a shared understanding that none had previously possessed or could have come to on their own [Schrage, 1995].
Collaboration includes all of the following elements: jointly developing and agreeing to a set of common goals and directions; sharing responsibility for obtaining those goals; and working together to achieve those goals, using the expertise of each collaborator.
The author describes the collaboration as the process of creating value by integrating all the knowledge and skills of collaborators into goals that would not be possible to achieve if the collaborator were acting alone.
Knowledge of team collaboration came from the author's first-hand experiences in the ieCollab project. In this project, the author had the experience to understand the idea of collaboration with its strengths and difficulties. The author tries to understand these strengths and difficulties, implementing the strengths and eliminating the difficulties for constructing CGUID.
In the CGUID, the author proposes collaboration of team member during each high-level design phase. Each team should address and develop the solution by communicating and filling the gaps from each team. In every phase, the team should work on each low-level design elements in creating desirable products that support the following low-level design element. The author predicts that by working together and by integrating knowledge between each collaborator, each of the problems with low-level design elements can be eliminated.
Chapter 3 - Fundamentals of Collaborative Graphical User Interface
Collaborating Teams
Analysis Team Design Team Construction Team
Project Manager (Leader) Interface Designer Developer
User
Interface Designer (Leader) Graphics Designer Developer User Developer (Leader) Interface Designer Document Specialist Tester User II
Besides the software development process and team collaboration, the author uses other considerations for developing the idea of CGUID. The author uses incremental software development model and the user-centered design model will be discussed in the following sections.
Software Development Model
This thesis introduces two commonly used software development models: waterfall and incremental.
CGUID is included as the incremental development process instead of waterfall. This is due to the fact that the CGUID reiterates until the software meets the business and user's requirements. The following is an overview of both methods.
3.2.1 Waterfall Model
The waterfall model is the oldest model of all lifecycle models. Although it has many problems, it serves as the basis for other development models. This is due to the fact that it has the fundamental steps of software development: analysis, design, construction, and testing.
Table 3-3
Chapter 3 - Fundamentals of Collaborative Graphical User Interface
The waterfall model is the process of incrementing from smaller design phases into another smaller design phases, from the analysis phase until the installation phase.
Analysis -4 Design Construction Testing rInstallation
Figure 3-3 Waterfall Model
Source: Redmond-Pyle, Graphical User Interface Design & Evaluation, 1992
However this method has some weakness. They are:
- The user does not obtain anything until the software is ready to deliver. This method might result in the software being built but is not highly usable to its user due to lack of interaction between the user and the development team.
- There is little opportunity for problems encountered or experience gained during construction, testing or use to influence requirements or design. There is only one increment from the design phase to testing phase. Therefore, software developer might not be able to fix the problems because once they are realized, the software development is almost over.
Since it is done in one increment, the waterfall model works well with projects that are well understood but complex. The development team can benefit from tackling complexcity in an orderly way. In addition, it works well when quality requirements dominate cost and schedule requirements. Elimination of midstream changes eliminates a huge and common source of potential errors [ McCowell, 1996].
Chapter 3 - Fundamentals of Collaborative Graphical User Interface
3.2.2 Incremental Model
The incremental model is an improved version of the waterfall model. The difference between the two models is that the incremental model supplies several increments for each stage in the waterfall model. Each method consists of a relatively self-contained unit of functionality which would provide the user with several benefits. The number of increments can be anywhere from three to fifty. The increments are prioritized, either: [Redmond-Pyle, 1995].
- To give the priority to the greatest business benefit and the least cost.
- To give the priority to the high technical risk on which other increments are dependent.
The analysis phase is performed across the scope of the whole system so there is an appropriate high-level direction and frameworks. The increments are then developed in priority order with each increment progressing through analysis, design, construction, testing and installation.
50 GUI design In project context
Future increments identified/prioritized
Increment 2 in progress
Fig. 4.3 Incremental development
Figure 3-4 Incremental Method
Chapter 3 - Fundamentals of Collaborative Graphical User Interface
With the incremental model, the value added to the software development process includes the following:
- Because of the repetition, the elapse time between analysis and installation is shorter. Therefore the requirements specified in the analysis stage are less likely to change.
- There is feedback from the earlier incremental phases that can be used to improve the latter version.
CGUID uses waterfall model, with analysis, design, and construction phases. However, the three phases in the CGUID can be reiterated to achieve the desired output, satisfying the business and usability requirements. Therefore, beside being a waterfall model, the CGUID can be described as the incremental model.
3.3
User Centered Design
Pursuing usability means designing the system so that it is intuitive and convenient for the user to use, rather than developing what is convenient for the developer and the system, and then asking the user to adapt to the system.
Trying to achieve high usability for the end user has three important implications for the design process [Redmond- Pyle, 1992]:
- The designer needs to understand in detail who the end user will be, what task they will perform and what their specific usability requirements will be. Without this information the GUI design cannot be organized around the users.
- End-users play an active role in design team throughout the analysis and design process. It is not sufficient to interview some users at the beginning for their requirements and to ask them to review the design once its is complete.
- The designer and end users jointly evaluate the usability of a proposed design as easly as possible and modify the design in the light of this feedback.
Chapter 3 - Fundamentals of Collaborative Graphical User Interface
All of these, the emphasis on users' tasks, user participation and user evaluation are referred to as a user centered design.
3.3.1 Contrast with system centered design
System Centered design works out from the heart of the system, and come to the end user last. The typical design sequence is as follows [Redmond, Pyle, 1992]:
- Specify user requirements which are normally actually business requirements concerned with functionality, with little mention of human being who will be the end users.
- Specify the heart if the system.
- Specify system function.
- Design a user interface to put on top of the system functions, to allow the user to invoke them, and to provide the input the system needs and to format system output.
In CGUID, the author values the involvement of the user in every phase of the software development model. Therefore, the user involvement is included in each stage of development process and the graphical user interface will reflect the user's proficiency.
3.4
Summary
Collaboration Graphical User Interface Design (CGUID) is a method for utilizing different parts of software development phase, interacting, and reiterating them to create a product that satisfies the usability requirements.
CGUID is a team collaboration solution. Collaboration allows the team member to exchange information and to achieve output that is hard to achieve with the collaborators working individually.
Chapter 3 - Fundamentals of Collaborative Graphical User Interface
CGUID is the combination of the software development phase in a collaboration model that allows team member to create an effective graphical user interface design.
Besides these two concepts, the author implements the increment model and user-centered design in CGUID. The increment model allows iteration until the graphical user interface has fulfilled the business requirement. The user-centered design, on the other hand, emphasizes user involvement in the GUI development process.
The following three chapters discuss the high-level design components - Analysis, Design, and Construction Phase. Each of these phases has team collaboration and software development
Chapter 4 - Analysis Phase
Chapter 4
Analysis Phase
4.1
Introduction
The analysis phase has two low-level design elements: Modeling. The Requirement Analysis process generates requirement (Figure 4-1), while the Task Modeling process models (Figure 4-2).
Business Requirement
Requirement Analysis
Requirement Analysis and Task the user profile and usability produces task scenarios and task
User Profile
Usability Requirement
Figure 4-1 Requirement Analysis
Business Requirement
Task Model
Task Scenario
Chapter 4 - Analysis Phase
The business requirements from the business idea specify the requirements for the GUI application developed. Examples of business application include a design of an automated system for company's inventory tracking or an application that handles hotel's room reservation. The user profile is a subset of the user population which share similarities in terms of their system usage and relevant personal characteristics. The usability requirement answers what the user expects from this new system. Should it be easy to use or easy to learn?
Besides the user profiles and the usability requirements of the Requirement Analysis, the analysis team should also identify the task scenario and develop task model. A task scenario is a task to be perform. A task model is an abstract structure showing many possible variants and subtasks. The difference between the two is that a task scenario is a single concrete instance of a task, with specific initial circumstances, input and subtask performed [Redmond-Pyle, 1995].
Section 4.2 describes collaboration occurs within the design team. It describes who the major stakeholders are and what their contributions in the collaboration process are. The following two sections (Section 4.3 and Section 4.4) describe how the process of developing the analysis phase products: user profiles, usability requirements, task models, and task scenario.
4.2
Collaboration in the Analysis Phase
The interface designer, developers, project/business managers, and potential users are the stakeholders in the analysis collaboration. The interface designer interacts with users to get information for the user profiles, usability requirements, and task models. Developers ensures to the usability engineer and project manager that building the software is possible. The project/business manager supervises the analysis meeting with users. This manager behaves as moderator if the users are not technically compatible with both interface designers and developers. The users are ultimately the sources of information for user profiles, usability
requirements, task models, and task scenarios.
Chapter 4 - Analysis Phase
Table 4-1 Analysis Team
Interface Designer Designs the graphical user interface using the analysis result. Gathers preliminary data about the user, task, and the work environment populations.
Developer Writes code that provides the functionality specified in the GUI and system requirement.
Project/Business Manager Supervises the meeting with the client and behaves as a moderator if the end user is not technically compatible with the usability engineer or developer.
The collaboration process can be done in a meeting room or in the virtual meeting room using meeting management tools. However at this thesis, the author describes the meeting at the client's work place which is known as "field study."
Field studies are powerful ways to get useful data quickly. Field studies also allow the analysis team to see the context of people's work, for example, as in the physical environment, the stress level, number of people, computer equipment, and existing system.
There are always surprises when the analysis team goes out and watches users in the field, and therefore, it is almost always worth the extra time and expense that field studies might entail. Many interface designers say that they cannot design a usable system if they cannot conduct at least one field study [Weinschenk, Jaman, Yeo, 1997].
In the field study, the analysis team with the users should collaborate in a meeting medium. Usually this meeting medium is a table with the analysis team and users sitting around it. This medium allows the analysis team and users to collaborate in every activity. These activities will be described in Section 4.3 and 4.4.
First of all, the collaborators should understand the business idea behind the application development. It is fortunate if the analysis teams are associated in some areas that the system might be involved in. The GUI application can be developed for the manufacturing, distribution,
Chapter 4 - Analysis Phase
finance and banking, and public sector. If the analysis team is customized with the necessary knowledge, then it is faster and easier for the analysis team to absorb and understand what kind of application that the users need. If the analysis team does not become familiar with the users job or main activities, it is the users' responsibility to compensate for the analysis team's lack of knowledge in designing the task model.
These are the guidelines for the interview that the analysis team should consider while they are taking the information from the users.
- Simplification. The end user should not simplify the description of his task. This might be caused because the end users might think that the analysis team does not understand about the tasks that the end user does. The end user should mention all the detail tasks
step by step. Having the user simplify their task might lead to important tasks not being captured in enough details, thus changing them in design phase will be more difficult and time consuming.
- Not Just Watch. Sometimes it is tempting to start designing the new interface while the analysis team is watching the user use the old system. However, this is not the purpose of the interview and field studies. The analysis team needs to observe and collect data, not analyze an design. Because design can be done later on, which is also covered at the later part of this chapter.
- Make the User Comfortable. People are often nervous about being watched and interviewed. The analysis team shall introduced the team and explain what the team doing and why.
The manager shall supervise the whole meeting process. The users might not have the technical knowledge like the developer and interface designer. On the other hand, the developer or interface designer assumes that the end users are like themselves. During the process, the business/project manager becomes a moderator preventing miscommunication between technical and non-technical collaborators.
Finally, the users shall revise and comment on the work performed by the analysis team. The analysis team shall conclude the analysis process after all the results are available and the users agree with the user profiles, user tasks, task scenario, and usability requirements.
Chapter 4 - Analysis Phase
4.3
Requirement Analysis
4.3.1 Identifying User Profile
Human psychological characteristics such as attitude can not be changed. They just come in a package and the analysis team should be able to recognize these. The designer team cannot control the attitudes or level of motivation. The designer only can minimize the negative emotions of fear, anxiety, threat, boredom, apathy and to maximize job satisfaction. The attitude types can be positive, neutral, or negative.
The motivation types are divided into discretionary and mandatory. A discretionary user has an option to use the system. Therefore they need to feel immediately that the system will not take too long to learn. A discretionary user usually has low motivation. A mandatory user must use a computer as part of their job. The system must provide benefits from the immediate experience using the computer. A mandatory user who is highly motivated out of fear (losing their job, doing homework) need the reassurance that the system is not overly complex and will not be difficult to learn.
The education level of the user has to be explored. Has the user completed high school? Does the user have a college degree? Does the user have advanced degree in specialized areas related to system use? Education level is generally correlated with reading level. If much of interface is verbal, then it is important that the vocabulary and grammatical structure be at the level that can be easily understood by users. Users' reading levels can be objectively measured, but if this is not possible, reading level can be inferred from educational level.
Computer literacy is the next level after educational level. The analysis team can measure user's ability relating to the existing computer experiences and skills in the hardware and software environments. How familiar the users use the hardware (keyboard, mouse)? What kind of software application they use such as (meeting management, financial, or accounting package software)? Have the user use GUI before and if they have used the GUI similar to the GUI that will be designed.
Chapter 4 - Analysis Phase
Analysis team should know whether the user has the basic task knowledge of the business that the GUI would serve. For example if a user is a person who work for airline reservation system, he or she should know which airport an airline would operate, what is the pricing policies, and the common connecting cities between departure and destination points. This task experience is called semantic knowledge [Shneiderman, 1992].
System experience refers to knowledge of the particular language or mode of interaction of a given system. User may have been performing their job for years effectively by hand, but will
be unable to perform the job when it is automated until they have learned the idiosyncratic language of the new system. For the example of the airline reservation system, system experience pertains to knowledge of special function keys on the keyboard, codes for airlines and airport, the syntax for entering a reservation, etc. This system experience is called syntactic knowledge [Shneiderman, 1992].
How does often the user use the system? The user might use a system 8 hours a day, 5 days a week. On the other hand, they might use a system once in a lifetime. These represent the extremes on the range of frequency of use. User may fall anywhere between the extremes, with some interesting variation, such as everyday but only 5 minutes a day. Frequency of use has profound implications for interface design because it affects learning and memory. Frequency of use affects system design in two ways. First, user who spend a lot of time on the system are usually willing to invest more time in learning, and therefore efficiency of operation often takes precedence over ease of learning. Next, frequent users have less difficulty remembering system commands between uses and efficiency of information often takes precedence over memorability. On the other hand, low-frequency users will be less able to remember interactive techniques between uses.
Turnover rate is an important job factor. A system that requires a great deal of training and is difficult to learn would not be appropriate for a job with a high turnover rate. The expense of training may outweigh the advantages of the automated system. When the turnover is low, a greater learning burden can be justified and will be perceived as a reasonable investment.
Chapter 4 - Analysis Phase
The task importance automated by a new system will influence how much of an investment in learning users are willing to make. For example, an electronic calendar might be perceived as very important to a secretary, a decision support system might be very important to an executive, and electronic mail might be very important to a manager. On the contrary, a word
processor might be relatively unimportant to a manager, and a graphic package would not be important for to an executive. In the earlier example the user is willing to invest a considerable amount of time in training and learning, whereas in the latter example they probably would not.
Task importance and frequency of use are not the same. The task may have a high performance but be executed with a low frequency. For example, a sales executive might implement the market modeling and forecast system as the basic for strategic planning. The system might be used only once or twice a year, but it is extremely important tool to this user. Then, in spite of low frequency of use, this user is willing to expend a considerably amount of time to learn to use the software.
4.3.2 Identifying Usability Requirement
There are three main categories that the author wants to emphasize for the usability requirement; ease of learning, ease of use, and rate or errors by user.
It is important to note that there are frequently trade offs between the usability requirements. For example, errors can be reduced by having low information density and using confirmation dialogs, however, this will reduce speed of performance. If longer learning is permitted, then the speed of task performance may be increased by asking users to learn special shortcuts or abbreviations. The relative priority of different usability requirements needs to be established early in the project
- Ease of Learning. If a system deals with a traveler to book a hotel or car rental at the airport, the system should offer ease of learning. The user can be in a variety of computer skill levels. Even, the user might be in pressure in time. Being easy to learn, the GUI shall behave as a tutor for the user instead of behaving as a tool.
- Ease of Use/ Speed of Performance. Contrary to the ease of learn, the GUI which server individuals with higher knowledge and computer skills should offer faster
Chapter 4 - Analysis Phase
performance. The purpose of these type of GUI is to maximize the amount of task done given the specified amount of time. Therefore the GUI should behave like a tool, in fact an
intelligent tool that enable to increase the productivity of a user.
Rate or Errors by User. Emotional arousal is the feeling the user have while he or she intreact with the system. Emotional arousal affects performance in a U-shaped function. Little arousal impedes performances, a moderate degree of arousal improves performances, and a high level of arousal also impedes performances. For example, the users who feels anxious about their ability to understand computers and fear that computers are going to change or eliminate their jobs or to whom the computer appear to be dominating and inconsistent will learn less quickly and perform with more errors [Mayhew, 1992].
High
Rate of Errors
Low
Low Medium High
Level of arousal
Figure 4-3 Arousal Performance Relationship
Source: Mayhew, D. Principles and Guidelines in Software User Interface Design, 1992
4.4
Task Modeling
Documenting the current task involves looking at how users do their work now in enough detail to provide the data the analysis team needs to design a new interface. Task analysis provides important clues to what the interface organization and conceptual design should be. Two important subjects in modeling task; user task and task scenario.
Chapter 4 - Analysis Phase
User task help the analyst to understand the world view of the user, in terms of identifying the objects in the system and the actions that people perform on these objects. Therefore, task analysis feeds the user object model, which in turn assists in the design phase.
Task analysis is the about learning what users do, not asking users to design interface. Task analysis only asks users for what they know best; their expertise on performing their work. The interface designer does not ask whether a user need windows. Through task analysis translates a requirement about a user who does not want to see three information at the same window into an interface design requirement for multi-windowed display.
4.4.1 Developing Task Model
Task analysis describes user task from the user's prospective, not the system functional or architecture prospective, and independently of any interface screen design concepts.
Task are shown as boxes, with lines showing how the task above is broken down to a set of subtasks. Thus, task X consists of subtask 1, 2, 3, and subtask 1 consists of two lower level subtask 1.1, 1.2 and 1.3. The diagram needs to be split into segments to make it easier to read. The diagram also needs to show sequence in which the subtasks are performed, or the logic of
how the subtasks are combined to perform the task.
There is an issue about how far to continue subdividing the subtasks. Continuing to far greatly increase the size and complexity of the task hierarchy, and is not an effective use of time. Stopping too soon can mean that the important task requirements may not be identified [Redmond - Pyle, 1995].
The diagram shows the structure of task, but it is often not convenient for the diagram to contain all the detailed textual description of how the task is performed. Sometimes the diagram structure is all that is required, but where detailed text is appropriate this may be
Chapter 4 - Analysis Phase
Figure 4-4 Task Model
Task table allows the analyst to capture and document all the data about each specific subtasks. The columns in the task detail table allow you to note how often user perform the subtask, what the user need to see to complete the subtask, what the user input, and a comments column where you can annotate problems with the current task flow an ideas for chages as the new interface is designed.
Task # Task Frequency Display Input Comments
Requirement Requirement
High Product ID,
Finding a product through
warehouse in a
Chapter 4 - Analysis Phase
The analysis team also can enrich the task model by considering the contigencies which may arise while the user is performing task. What happens if some input information is missing or incorrect? What happens if the task ever interrupted to perform some other more urgent task? What happens if the user makes an error? For each contingency consider whether additional subtask
4.4.2 Developing and Modeling Task Scenario
Task scenario help to ground the development in reality. The scenario provides concrete examples of how the tasks will be performed, in a format that is easily usable by those involved in the GUI design and prototyping [Redmond-Pyle, 1995].
A task scenario is an outline of tasks and subtasks that describes how users will do their work. The purpose of the use case scenario is to aid in conceptual design. It must be describe how users will do their work with the new software so that the correct flow of screen can be developed.
A task scenario does not describe the user's task now, but the task they will perform when the new system is in place. It is easy when creating a scenario to fall into describing the current situation, but avoid doing that unless the new is exactly the same as the current.
The analysis team should build the task scenario from the user's point of view not the system's point of view. In order to match the way the users should be doing their work, the scenario must be a list of user tasks. If the analyst team want a system description in the task scenario, create a parallel scenario for the system.
The description of software actions is critical for software development, but it is a best a distraction for interface designer. This even can make the interface designer to digress from the real interface designer and move into designing the underlying software.
It is recommended that the interface designer and the software development group to work from the same task scenario. However both group should create two separate, but matching scenarios; one for the interface design and one for the software development design. This way,
Chapter 4 - Analysis Phase
the both interface designer and the developers are getting the same scenario, but each group can get the information it needs.
Figure 4-6 Task Scenario
Source: Weinschenk, Jamar, Yeo, GUI design Essential, 1997
4.5
Summary
Collaboration in the analysis phase employs the skills of analysis team (interface designer, developer, and project manager) and users to work together in creating the analysis products:
user profile, usability requirements, task model, and task scenarios.
User profile is the list of characteristics of the individuals who will use the new application. Usability requirements are the requirements the user wants to see and feel while they are using the application. Task model and scenarios are the list of actions to complete a task.
The interface designer and users are the major stakeholders in the collaboration process. The interface designer and users collaborate in creating all the products of analysis phase. The user profile interview can easily be done by having the users filling in a profile form or by having them interviewed by the interface designer. The usability requirements and task analysis usually implicitly extracted from the result of interview.
Having the interview result ready, the developers ensure whether the result can be developed into an application. They also contribute some part of the user profile by examining the