Publisher’s version / Version de l'éditeur:
Applied Optics, 28, 15, pp. 3233-3241, 1989
READ THESE TERMS AND CONDITIONS CAREFULLY BEFORE USING THIS WEBSITE. https://nrc-publications.canada.ca/eng/copyright
Vous avez des questions? Nous pouvons vous aider. Pour communiquer directement avec un auteur, consultez la
première page de la revue dans laquelle son article a été publié afin de trouver ses coordonnées. Si vous n’arrivez pas à les repérer, communiquez avec nous à PublicationsArchive-ArchivesPublications@nrc-cnrc.gc.ca.
Questions? Contact the NRC Publications Archive team at
PublicationsArchive-ArchivesPublications@nrc-cnrc.gc.ca. If you wish to email the authors directly, please see the first page of the publication for their contact information.
NRC Publications Archive
Archives des publications du CNRC
This publication could be one of several versions: author’s original, accepted manuscript or the publisher’s version. / La version de cette publication peut être l’une des suivantes : la version prépublication de l’auteur, la version acceptée du manuscrit ou la version de l’éditeur.
Access and use of this website and the material on it are subject to the Terms and Conditions set forth at
Effect of detector nonlinearity and image persistence on CARS derived
temperatures
Snelling, D. R.; Smallwood, G. J.; Parameswaran, T.
https://publications-cnrc.canada.ca/fra/droits
L’accès à ce site Web et l’utilisation de son contenu sont assujettis aux conditions présentées dans le site LISEZ CES CONDITIONS ATTENTIVEMENT AVANT D’UTILISER CE SITE WEB.
NRC Publications Record / Notice d'Archives des publications de CNRC:
https://nrc-publications.canada.ca/eng/view/object/?id=bf569d3f-ab5e-4105-afcb-019dac7e5872 https://publications-cnrc.canada.ca/fra/voir/objet/?id=bf569d3f-ab5e-4105-afcb-019dac7e5872
Effect of detector nonlinearity and image persistence on
CARS derived temperatures
D. R. Snelling, G. J. Smallwood, and T. Parameswaran
The image persistence of self-scanning photodiode arrays (IPDA) incorporating P-20 phosphor-based inten-sifiers is shown to make them unsuitable for single-pulse CARS temperature measurements in turbulent combustion. Correcting CARS flame spectra for the nonlinear response of the IPDA detectors increases CARS derived temperatures -3-6%. This error is partially offset by correcting for the perturbations in the N2vibrational population resulting from stimulated Raman pumping. The effect of these population
perturbations on CARS-derived temperatures is determined. CARS flame spectra obtained with uncorrelat-ed pump beams that are correctuncorrelat-ed for IPDA nonlinearity and stimulatuncorrelat-ed Raman pumping are shown to give temperatures in good agreement with combined thermocouple/sodium line-reversal measurements.
1. Introduction
Single-pulse, broadband CARS (coherent anti-Stokes Raman spectroscopy) is an important diagnos-tic technique for combustion measurements of tem-perature and species concentration. The single-pulse capability requires the use of optical multichannel de-tectors (OMD) such as the intensified silicon intensi-fied target (ISIT) vidicon or, more commonly, the in-tensified self-scanning photodiode array (IPDA).
Several IPDA detectors incorporating a P-20
phos-phor in the image intensifier have been shown to have a
nonlinear response and to exhibit an image persistance
(lag) that is more pronounced than was commonly
realised.1 This problem appears to be generic to the P-20-based IPDA detectors.1 2 Although the nonlin-earity of the ISIT vidicons was not examined they are likely to behave in a similar way to the IPDA detectors since both incorporate P-20-based image intensifiers that were implicated1 in the nonlinearity of the IPDA detectors.
Detector image persistence presents a particular problem for single-pulse CARS measurements in tur-bulent combustion environments. The CARS signal
increases markedly with decreasing temperature and this has necessitated the use of multiple-beam tech-niques3 4 to extend the dynamic range of the OMDs.
With a large dynamic range even weak image persis-tence can lead to CARS spectral distortion.
For a 10-Hz CARS system the typical image
persis-tence for a P-20-based IPDA is' -0.5-2.0% with the
majority of the persistence resulting from CARS expo-sures prior to the preceding one. Because of the
de-The authors are with National Research Council of Canada, Divi-sion of Mechanical Engineering, Ottawa, Ontario KlA OR6, Canada.
Received 1 March 1989. 0003-6935/89/153233-09$02.00/0.
pendence of CARS signal on temperature, the image
persistence will result in a residual image that is biased to lower temperatures. In this report we attempt to
evaluate the effect of image persistence on
CARS-derived temperatures by synthesising purely theoreti-cal spectra that are mixtures of two temperatures. These synthetic spectra are then analyzed to obtain best-fit temperatures to assess the resulting error.
The IPDA nonlinearity that involves a logarithmic fall-off in relative sensitivity with output signall'2 ap-pears not to have been considered previously in CARS spectroscopy. Correcting the data for this effect in-creases the best-fit temperatures by 45-100 K at 1600
K (3-6%).
There have been many comparisons of CARS-de-rived temperatures with those obtained by other tech-niques such as thermocouple and sodium line-reversal
(see, for example, Ref. 5 and 6 which summarize the
earlier work). Some recent comparisons,7-9 including
our own,10have claimed 1.0-1.5% accuracy. Thus we
were disconcerted to find a nonlinearity whose inclu-sion resulted in a substantial increase in best-fit tem-peratures.
In this paper we assess the effect of this IPDA
non-linearity on best-fit CARS temperatures. We also
examine the effect of various assumptions in the CARS theory and the fitting procedures on the best-fit tem-peratures. In particular it appears that stimulated Raman-induced changes in the vibrational state popu-lations are perturbing the CARS spectra which then appear anomalously hot.
There have been relatively few studies of population perturbations in broadband CARS as compared to
scanning CARS in which two narrowband lasers are
used. Regnier et al.,11presented a formula for popula-tion transfer times for monochromatic lasers and Gier-ulski et al.,12 have reported measurements of
pump-induced population changes in room temperature N2
using a broadband CARS system. This latter study employed a short focal length focusing lens and the 1 August 1989 / Vol. 28, No. 15 / APPLIED OPTICS 3233
resultant high peak laser intensities resulted in an
apparent vibrational temperature of 2550 K in room
temperature N2
-Detector nonlinearity and stimulated Raman
pump-ing have offsettpump-ing effects on CARS-derived
tempera-tures so that neglecting both may produce results that appear reasonable. In this paper we assess the effect of stimulated Raman pumping on CARS-derived tem-peratures.
II. Experimental Apparatus and Data Reduction A. CARS Spectrometer
Most of the data presented in this report was collect-ed with the CARS instrument describcollect-ed previously.10
-14 We have recently replaced the USED CARS
phase-matching technique employed previouslyl0-14 with folded BOXCARS'5 phase matching. The CARS spectra were recorded in a premixed flat-flame burn-er'0 operating on hydrogen/air at an equivalence ratio of 0.574. The measured sodium line-reversal tem-perature 10 mm above the burner center line was'0
1593 18 K. We have subsequently verified this
measurement by using three different-sized thermo-couples to measure the flame temperature.'6 The thermocoupled readings were corrected for radiation and conduction losses although the extrapolation of the data to zero thermocouple diameter greatly re-duced the need to know the correction accurately. The final temperature obtained from the
thermocou-ple measurements was 1560 + 22 K which is in
satisfac-tory agreement with the Na line-reversal
measure-ments. We adopted an average value of 1577 + 20 K as
our best estimate of the temperature 10 mm above the burner centerline.
The data in Refs. 10-14 and the data reported here employing USED CARS phase matching were gener-ated using a Spectra Physics DCR 1A Nd:YAG laser that had a spectra bandwidth of 0.10 ± 0.03 cm-' with the intracavity etalon and 0.69 0.05 cm-' with the etalon removed. The laser was subsequently rebuilt (the remeasured bandwidths are 0.22 ± 0.04 cm-'
(eta-lon in) and 0.67 0.10 cm (no etalon)) and used for the
folded BOXCARS phase-matching experiments.
For the USED CARS experiments in Ref. 10, a
200-mm focal length CARS focusing lens was used and the laser energies were 30 mJ (pump) and 5 mJ (Stokes). The laser focal spot sizes (aperture diam. to pass 50% of
the beam) were 45 m (pump) and 75 gm (Stokes).
For the USED CARS experiments discussed in Sec.
IIIC and shown in Fig. 5 the lens focal length was 300
mm, the pump laser energy 70 mJ, the Stokes laser energy 13-22 mJ, and the laser focal spot sizes 75 gm (pump) and 70 m (Stokes).
For the folded BOXCARS experiments the lens focal length was 300 mm, the total pump laser energy 50 mJ, the Stokes laser energy 10 mJ, and the laser
focal spot sizes 75 (pump) and 60 Azm (Stokes).
B. CARS Theory and Data Reduction
The accuracy of CARS-derived temperatures is largely determined by the synthetic theoretical spectra generated for analysis of the data. The theoretical models and the computer program used to calculate the synthetic CARS spectra have been described in some detail'0"7and they will only be summarized here. The effect of collisional narrowing of Raman lines'8 and cross-coherence terms that arise'9 2 0 in the laser convolution of CARS intensity are included as options in the calculation of CARS spectra. The theoretical model used previously0 has been modified to include the 0 and S branches of N2. The effect of these and other small changes'7 to the computer model was eval-uated by fitting a theoretical 1550-K spectrum gener-ated by the earlier program'0 with a library calculated with the modified program. The best-fit temperature obtained was 1558.8 K showing that the refinements to the program had resulted in a change of 8.8 K.
In conventional flame CARS spectroscopy Doppler broadening is neglected and the Raman lines are as-sumed to have Lorentzian shapes. When Doppler broadening is significant a Voigt profile describes the line shape more accurately. Henesian and Byer2l have provided a generalized expression for the CARS sus-ceptibility using Voigt profiles expressed in terms of complex probability functions. In the updated ver-sion'7 of our CARS theoretical spectrum generating program, an option has been provided to use a Voigt line shape function. At atmospheric pressure and flame temperatures around 1500 K it is often not clear whether collisional narrowing due to overlap of pres-sure broadened lines or Doppler broadening plays a
more important role. As a test we have fitted 1550-K
spectrum of N2 obtained with the isolated line model with cross-coherence (IT) against libraries with (i) collision narrowing and cross-coherence (GT) and (ii) with isolated line and Voigt profile (ITV). The GT model gave a best-fit temperature of 1554 K and the
ITV model gave 1558 K.
This test suggests that, while both the above im-provements produce only modest changes in the tem-perature, the CARS spectrum is perhaps more sensi-tive to the use of Voigt profile than the inclusion of
collisional narrowing for T = 1550 K.
A set of programs for fitting experimental CARS spectra to calculated spectra, including a nonlinear least mean squares fitting scheme, was developed.'7 The calculation of a typical theoretical CARS flame spectrum can take a few hours with a DEC VAX-11/ 730 computer. Therefore, a method of estimating temperatures by fitting experimental CARS spectra to a precalculated library of theoretical CARS spectra at various temperatures was implemented. The instru-ment function required to create this library is ob-tained by fitting room-temperature nitrogen CARS spectra. With this approach less than two seconds of DEC VAX-11/730 CPU time was required to fit a single experimental spectrum. The originall four-parameter, asymmetric, Voigt instrument function was expanded 7 optionally to include two terms that
-1
decayed as the reciprocal of the frequency displace-ment, creating a six-parameter modified Voigt instru-ment function. The fitting programs were also
modi-fied to allow the CARS intensities to be corrected for
detector nonlinearity.
Ill. Results and Discussion
A. Effect of Image Persistence on CARS Temperatures Image persistence in P-20-based IPDA detectors was shown' to contribute about 0.5-2.0% of the signal
in a typical CARS system. Most of this image
persis-tence comes from pulses prior to the preceding one and
is caused by the slowly decaying components of many earlier CARS signals.
We have modeled the effect of this image persistence
on CARS-derived temperatures by synthesizing theo-retical spectra that are mixtures of two temperatures. Six synthetic spectral libraries were created by adding
0.5 or 2.0% of 500 K, 700 K, or 1000 K theoretical CARS
spectra to a standard library of spectra calculated (for
a constant pressure of one atmosphere) at every 100 K,
from 300-2100 K. The synthetic spectra were then treated as experimental spectra and fitted to the origi-nal library to obtain the best-fit temperatures.
The error in best-fit temperatures that results from adding the image persistence of a cooler spectrum to a hot spectrum increases markedly with temperature as
shown in Fig. 1. This occurs because the CARS
inten-sity decreases with increasing temperature, with the
peak intensity of a 2100-K spectrum being -1/1000
that of a 300-K spectrum (assuming constant
pres-sure).
For the same reason the increase in best-fit tempera-tures that results from adding the image persistence of
a hot spectrum to a colder spectrum is negligible. The
maximum increase in best-fit temperature observed was 3.3 K and for this reason these data are not
pre-sented in Fig. 1.
The image persistence results in time averaging of CARS spectra and the effect on CARS-derived tem-peratures is similar to that of spatial averaging within the probe volume that has been discussed recently.2 2
The temperature errors (Fig. 1) that result from the
admixture of cold spectra are unacceptably large. In a
turbulent flame with pockets of cool and hot gases this would result in temperature histograms biased to
low-er templow-eratures where the biasing would depend on
the particular time history as well as the temperature
distribution. In practice it will be difficult to assess
quantitatively the effect on CARS-derived
tempera-tures of image persistence since it is long lived (up to several seconds) and many previous CARS signals will
contribute. A prototype detector with a faster rare-earth phosphors more suited to CARS temperature measurements in a turbulent environment will greatly reduce these problems.
B. Detector nonlinearity
The effect of correcting a CARS spectral signature
for detector nonlinearity is shown in Fig. 2 for a
spec-0 I Up Us I. -2 4 6 8 --10 20 40 --60 --80 100 200 400 - 600--800 -1000=_ 500 II I I I I I I I I N ItI I N 0.5% 11111111~~~~~~~~~~~~~~~~~~~~~~~~~~~~~~~~B {EI /e I~ 1000 1500 2000 ORIGINAL TEMP (K) T = 1000K T = 700K T = 1000K T = 500K T = 700K T = 500K
Fig. 1. Image persistence for a Princeton Instruments model IRY-1024 IPDA following an interrupted 10-Hz laser exposure.
1.0-0.9- --- UNCORRECTED CORRECTED FOR DETECTOR
0.8- NON-LINEARITY 0.7--0.6 0.-n z z- 0.4- 0.3- 0.2-…-1 0.I 2260 2270 2280 2290 2300 2310 2320 2340 2350 2360 2370 RAMAN SHIFT (cm)-'
Fig. 2. Effect of correcting for detector nonlinearity on an experi-mental CARS flame spectrum.
trum recorded in the flat-flame burner using the Tra-cor Northern TN-6132 detector. The Tra-correction
ap-plied is essentially that shown in Fig. 1 of Ref. 1.
Applying this correction results in best-fit CARS temperatures (see Table I) that are -50-100 K hotter at 1600 K. Applying the nonlinear correction destroys the agreement we had previously reportedl between CARS temperatures and Na line-reversal tempera-tures.
In an attempt to discover the cause of this discrepan-cy we investigated the effect of various fitting options and CARS input data on CARS derived temperatures. The data consisted of three experiments, comprising
30 files, each containing 100 single-pulse CARS
spec-tra (0.69 cm-' pump laser bandwidth) recorded in the hydrogen/air flat-flame burner and employing USED CARS phase matching.
The result of this investigation is shown in Table I. For the weighted least mean squares (LMS) fits, the weights assigned to each diode signal were obtained
from the measured detector noise characteristics with an added component for the shot-to-shot variation in the Stokes laser spectral profile'0(assumed to be 4% in Table I). The Raman linewidth and relaxation rate
data used in calculating the theoretical CARS spectra are referenced in Table I.
For entries A-E the four-parameter instrument function was obtained by unweighted fitting of experi-mental room temperature N2 spectra to theoretical spectra that were convolved to ±10 Voigt widths (typi-cally ±15 cm-').
For entry F the fitting program used to obtain the instrument function from the room-temperature ni-trogen spectral7 was modified. Spectral shift was add-ed as a fitting parameters to replace the original strat-egy of aligning the maximum intensity points in the experimental and synthetic room-temperature N2 CARS spectra and weighting was used where appropri-ate.
For entries G and H, the convolution of the theoreti-cal CARS spectra was with the six-parameter modified Voigt instrument function, and the convolution range was extended from 10 Voigt widths'0 to 50 cm' independent of the Voigt parameter. A more accurate nonlinear correction of the IPDA response was em-ployed that resulted in corrections that were -15% less than for the nonlinear correction employed in entries A-F.
Table 1. Effect of CARS theoretical model assumption on best-fit single-pulse CARS temperaturesa
Average best-fit cars temperature Uncorrected With nonlinear Code for for detector detector
CARS nonlinearity correction
model Unweighted Weighted Unweighted Weighted used LMS fit LMS fit LMS fit LMS fit
A 1541 1509 1639 1632 B 1579 1573 1691 1700 C 1565 1550 1675 1683 D - - 1599 1561 E 1570 1550 1679 1675 F 1569 1549 1668 1668 G 1574 1582 1622 1643 H 1570 1574 1618 1633
a Except as noted, the synthetic spectra were calculated with
collisional narrowing and cross-coherence effects included. The changes in the model and the input parameters are listed below.
A Raman linewidths and exponential gap model for relaxation rate data taken from Ref. 23.
B Raman linewidths and exponential gap model relaxation rate data taken from Ref. 24.
C Raman linewidths augmented by 9% to account for the addi-tional broadening effect of water vapor.25
D Nonresonant susceptibility increased by 50%.
E More accurate version2 6of exponential gap model for relax-ation rate data implemented with 9% augmentrelax-ation for water vapor.
F Fitting programs modified to include more accurate fit to room-temperature N2spectra (see text). The Raman linewidths were those of entry E.
G The theoretical spectra were convolved with a six-parameter instrument function convolved to ±50 cm-' and a more accurate nonlinear correction of the IPDA response was employed (see text). The Raman linewidths were those of entry E.
H Same as G except the synthetic flame spectra were calculated with the effects of cross-coherence and Doppler broadening (Voigt profile) included.
The theoretical spectral libraries used to generate the best-fit temperatures for entries A-G in Table I were calculated with the effects of collisional narrow-ing and cross-coherence included. The pump laser bandwidth was 0.69 cm-'. Entry H was generated with the effects of cross-coherence and Doppler broad-ening included.
The best-fit unweighted CARS temperatures in Ta-ble I are -50-100 K hotter when the nonlinear correc-tion is applied. The temperature shifts noted previ-ously,'0 when weighted as compared to unweighted LMS fitting was applied, are frequently observed for the uncorrected fits in Table I but are largely absent when the nonlinear correction is applied. Since, with weighting, the lower CARS signals are accorded rela-tively greater importance in the LMS fitting proce-dure, this suggests that applying the nonlinear correc-tion results in a CARS spectrum where the high and low signal features are consistent with a single tem-perature.
We have routinely adopted weighted least mean squares (WLMS) fitting of CARS spectra, first, be-cause, the WLMS fit markedly increases the precision of single-pulse CARS temperature measurements.10 And, second, because an unweighted LMS fit implicit-ly assumes that the error (variance) associated with an individual diode reading is constant independent of signal level and this clearly is not correct.5"10"13
Model A in Table I corresponds to the CARS syn-thetic spectra used in our earlier study10where the N
2 Raman linewidths2 3 were taken to be independent of
combustion species (i.e., C02/N2 and H20/N 2
colli-sions were assumed to have an effect identical to N2/N2 collisions) and the relaxation rate data were obtained from an exponential gap model.2 3
The use of Raman linewidths and state relaxation rates based on more extensive high temperature and pressure N2Raman linewidth data2 4increased best-fit temperatures (model B, Table I) by 40-70 K. This increase partly disappeared as, first, the effect of H20
broadening on N2 Raman linewidths2 5 was included
(model C, Table I) and, second, a more accurate em-pirical expression for the exponential gap relaxation rate model2 6(model E, Table I) was implemented.
During the analysis it became clear that, particularly for the weighted and corrected fits, it was important to fit the low-intensity wings of the instrument function. To accomplish this the six-parameter modified Voigt instrument function was implemented and the convo-lution range extended. As expected this had a greater effect on the weighted fits as can be seen by comparing the uncorrected best-fit temperatures for F and G in Table I. The reduction in the corrected best-fit tem-peratures for G as compared to F is in part due to the modified nonlinear correction employed for G. The modified nonlinear correction (G and H) results in smaller increase in best-fit temperatures than the pre-vious correction (A-F). If the experimental flame data are analyzed with the same theoretical slit con-volved library both with and without the correction applied, the change in best-fit temperatures is
typical-0.67 0.5- 0.4- I-z 0.3- 0.2-0. I- 0.0-- EXPERIMENT (E) --- THEORY (T) --- 10 x(E-T) 22 80 2290 2300 23 10 2320 2330 2340 2350 2360 2370 RAMAN SHIFT (cm')
Fig. 3. Comparison of an experimental room-temperature CARS spectrum to a theoretical N2CARS spectrum calculated for Tv = 1325 K and TR = 294 K and convolved with a best-fit six parameter
instrument function.
ly 90 K. The smaller temperature increment observed
for G and H in Table I when the correction for detector
nonlinearity is applied results from its having a com-pensating effect by modifying the instrument func-tion. This compensating effect is more marked for models G and H because of the improved fit to the extended wings of the instrument function.
As discussed in Sec. IIA it is probably more
impor-tant to include Doppler broadening in the CARS mod-el than collisional narrowing for our flame conditions (H and G, respectively, in Table I) although the differ-ences between the best-fit temperatures are small.
The final weighted nonlinear corrected best-fit tem-perature of 1633 K(H), which we consider the most accurate, is 56-K hotter than the averaged Na
line-reversal/thermocouple measurements of 1577 ± 20 K.
Thus a discrepancy remains that cannot be explained with current available N2 CARS models and data. C. Stimulated Raman Pumping
The room-temperature N2CARS spectra frequently
exhibit a small v = 2 v = 1 peak, presumably due to
population of the v = 1 level by stimulated Raman
pumping. Both the room-temperature N2 and flame
spectra were recorded using the same laser energies to
monitor the amount of stimulated Raman pumping. For this reason, the necessary reduction in room-tem-perature N2 IPDA signal was accomplished by insert-ing neutral density filters in the CARS beam rather than by attenuating the laser energies as is frequently
done in CARS spectroscopy. The effect of stimulated
Raman pumping, which is directly observable in room-temperature nitrogen spectra, can then be used to correlate the increase in best-fit temperature in flame spectra where the effect of stimulated Raman
pump-ing is only indirectly observable.
In one series of experiments we deliberately
defo-cused the laser beams, particularly the larger diam. pump beam, by inducing some spherical aberration. This produced a large increase in the stimulated
Ra-man pumping of N2 v = 1 level as shown by the
experi-mental spectrum in Fig. 3. We characterize this
pumping by measuring the ratio of the CARS v = 2 - v
=
1
peak amplitude (I,) to the v = 1 - v = 0 peakamplitude (IO). We measure I, by visually estimating its peak height above the tail of the fundamental band. For the room-temperature N2 spectrum in Fig. 3, the ratio Il:Jo = 0.019, whereas, before defocusing the laser
beams, lj/Jo was typically 0.005.
The ratio of stimulated Raman pumping (which var-ies as Ip I, where Ip and I, are the pump and Stokes laser intensities, respectively) to the CARS generation (which varies as 4p2 Is) is proportional to l/Ip. Thus
the decrease of Ip with increasing focal spot size ac-counts for the increased stimulated Raman pumping
of N2v = 1 level. (In practice, the total CARS signal
was maintained approximately constant by increasing the pump energy but the larger focal volume resulting from the increased spot size still required a lower laser intensity, Ip.)
In fitting room-temperature or flame N2 CARS spectra to theoretical spectra previously, no account had been taken of the population perturbation. To generate synthetic spectra to model the stimulated Raman effect, we have assumed an increased vibra-tional N2temperature (Tv), with a rotational tempera-ture (TR) that is independent of vibrational level and that corresponds to the kinetic temperature of the gas. This is reasonable, first, because the AJ = 0, ±2 selec-tion rule for the stimulated Raman process will result in the N2v = 1 level having a similar rotational
enve-lope to that of the ground state. Second, the rotation-al relaxation times T
R are somewhat shorter than the
laser pulse duration TL. The J dependent Raman
linewidths rj (FWHM) are dominated by rotational dephasing and represent the total rate of rotational energy transfer for that level:
(1)
ri
2= -j
"',=j
where -Yij is the rate of transition from state j to state i. Thus the typical rotational relaxation times of 0.18 ns
at room temperature and 0.53 ns at T = 1500 K are
shorter than TL 10 ns.
The vibrational relaxation times T
V' due to
vibration-al energy transfer are much larger than TL. The fastest
rates occur in the hydrogen/air flame by energy
trans-fer to water molecules2 7 and for our flame conditions we estimated an N2vibrational relaxation time of -700 ns, very much longer than the laser pulse duration of
-10 ns. Thus even under flame conditions, there is essentially no vibrational relaxation of the stimulated
Raman pumped N2v = 1 level.
An instrument function was obtained from the ex-perimental spectrum in Fig. 3 by fitting it to synthetic
CARS spectra that were calculated for a fixed
rotation-al temperature of 294 K and varying vibrationrotation-al tem-perature. A best fit was obtained for a vibrational
temperature (T,) of 1325 K as shown in Fig. 3.
A library of synthetic CARS spectra, calculated ev-ery 50 K from 1100-2100 K, was then combined with
1 August 1989 / Vol. 28, No. 15 / APPLIED OPTICS 3237
II I
1\v/s
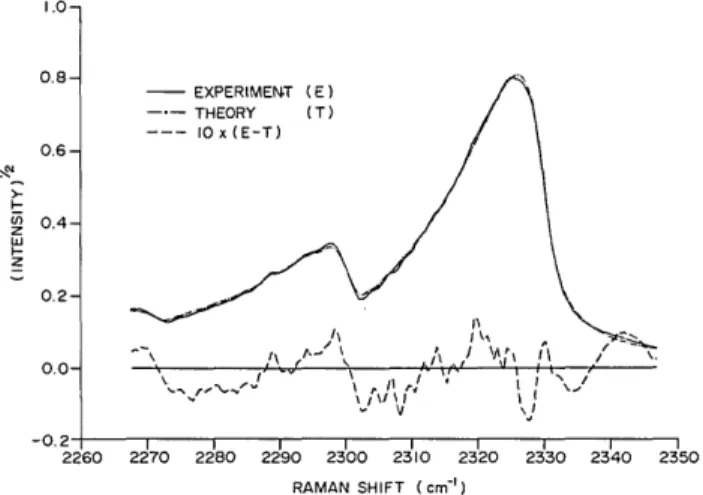
0.8- 0.6- 2-a z I- 0.4- 0.2- 0.0-- EXPERIMENT (E) --- THEORY (T) --- lOx (E-T) l I I/ I1 J / 2260 2270 2200 2290 2300 2310 2320 2330 2340 2350 RAMAN SHIFT (cm-')
Fig. 4. Comparison of an experimental CARS flame spectrum to a best-fit theoretical spectrum (T = 1775 K) convolved with an instru-ment function obtained from fitting a room-temperature N2CARS
spectrum.
this instrument function and the resulting synthetic spectra used to fit the corresponding experimental CARS flame spectra. A best fit to a 400-pulse average flame spectrum is shown in Fig. 4 where the best-fit temperature is 1775 K. The experimental spectrum is clearly vibrationally hotter and rotationally cooler than the theoretical spectrum as would be expected if
population changes of the N2 v = 1 level were
occur-ring. The best-fit temperature is also over 100-K
hot-ter than those recorded with tighhot-ter focusing and laser energies where the ratio I/J0 is much less.
A series of experiments with varying amounts of stimulated Raman pumping in the room-temperature N2 spectra was analyzed in a fashion similar to that described for the spectrum in Fig. 4. The results of this analysis are presented in Fig. 5 where the best-fit temperature of the flame spectrum is seen to increase with the Ij/Io ratio of the corresponding room-tem-perature N2spectrum.
A linear regression analysis of the data in Fig. 5 can be used to estimate the error in flame spectrum tem-perature measurements if the IJ/I0 ratio of the
corre-sponding room temperature N2 file is known. For the data in Table I the average value of I,/Io was 0.0015 and
from Fig. 5 this can be seen to result in an increase of 13
K in the CARS flame temperature measurement over
the temperature expected for I1/Jo = 0.0. Thus
ap-proximately 13 K of the 56-K discrepancy discussed in
Sec. IIIB can be attributed to an increase in the v = 1
population.
To further demonstrate the presence of stimulated Raman pumping, experimental spectra were fitted with libraries of theoretical spectra that were calculat-ed with an augmentcalculat-ed vibrational temperature i.e., TV
= TR + AT where AT = 0, 100, 200,250, 300 and 400 K.
The resulting best-fit variance between theory and
experiment is shown in Fig. 6 as a function of N2
vibrational temperature augmentation AT. The
ex-perimental spectrum is that shown in Fig. 4 for which
I1/o = 0.019 and the minimum in the best-fit variance
occurs for AT = 250 K. The resulting fit between
1780 1760
~1720
m 1700 0 w 1680 1660 1640- 1620-U,1600 .0 0.02 0.004 0.006 0.008 0.610 0.012 0.014 0.016 0.018 0.020 / IN CORRESPONDING ROOM TEMPERATURE N2CARS SPECTRAFig. 5. Best-fit temperature for N2 CARS flame spectra vs ob-served stimulated Raman pumping of N2v = 1 in corresponding
room-temperature N2 CARS spectrum.
S 0
s
it l
m 5
100 200 300 400
N, VIBRATIONAL TEMPERATURE AUGMENTATION (K) 500
Fig. 6. Best-fit variance of the experimental flame spectrum shown in Fig. 5 (j/1I = 0.019) vs vibrational temperature augmentation AT. The synthetic CARS libraries were calculated for TV = TR + ATwith
AT = 0, 100, 200, 250, 300 and 400 K.
theory and experiment, which is shown in Fig. 7, is
dramatically improved over that shown in Fig. 4 (for AT = 0). This best-fit augmentation of Tv of 250 K is
greater than the observed increase in best-fit flame
spectra of - 160 K deduced from Fig. 5 for l1/Jo = 0.019.
This is to be expected since the best fit to the flame spectrum is a compromise between fitting the
vibra-tional and rotavibra-tional envelopes as shown in Fig. 4.
We have modeled the effect of stimulated Raman pumping to see if its observed effect in room-tempera-ture N2 CARS spectra is consistent with the perturba-tions we have proposed in flame spectra. During the
CARS process, perturbation of the vibrational popula-tion may occur due to stimulated Raman coupling between the two laser fields at wp and w This evolu-tion of the populaevolu-tion difference is proporevolu-tional to the imaginary part of the Raman susceptibility and the product of the laser intensities Ip I,, and may be
expressed as"1,2 8: of 2 l
If we ignore the variation of da/d with temperature then a, and hence T,, is constant with temperature.
This suggests that the characteristic time evaluated
for room temperature may also be used for flame
con-ditions provided the laser intensities remain constant. From Eq. (2) the change in the population difference due to stimulated Raman excitation between levels v
and v + 1 is given by the rate equation,
IN I ' .
*"
j
, 'A 1i II ,,s,9 --- \, a\ Ii- 1 ; -,j v v 2260 2270 2280 2290 2300 2310 2320 2330 2340 2350 RAMAN SHIFT (cm')Fig. 7. Comparison of the experimental CARS flame spectrum shown in Fig. 4 to a best-fit theoretical spectrum (Tv = 1881 K; TR =
1631 K) convolved with an instrument function obtained from fit-ting a room temperature N2CARS spectrum.
d(AN) 47rc4 du
4,
)PIP(.) I(.)
)] (dt hw4d12 cj (2Ao)+
where AN is the population difference, (da)/(d ) is the
Raman cross section, c is the velocity of light, h is the
Planck's constant, Awj is the detuning and rj is the Raman linewidth (FWHM) for transition j.
A characteristic time -r for this process may be
de-fined as
TC1 = _1 A d(N) dt constant g(w) I,(w)I,(w), (3)
where
(2AWj)2+ rj2
is a Lorentzian lineshape function. For finite band-width sources g(w) must be convolved with the spectral profiles of the lasers. In broadband experiments the Stokes laser has a large bandwidth and may be as-sumed to be constant over the region of the pump width. Thus convolution may be done with only the pump laser profile. If this latter profile is assumed to be a Lorentzian, then the convolved function g'(w) is also a Lorentzian with a width (FWHM) equal to the sum of the Raman linewidth rj and the pump
band-width rp,
(2 Aw)2 + (rj+ Fp)2 (5)
If we further integrate g'(co) over all values of detuning for a given transition,
J
g'(w)dw =r/4T111 doI -I-2=7 (6)
TC ipI h4
dQ ( C
) 4
where Is is the Stokes laser intensity and Ip is a scaling factor for the Lorentzian pump laser intensity
expres-sion.
where a is defined above and TD is the time constant for
vibrational relaxation. In Eq. (6) we assume that the
Raman cross section du/dQ varies as v + 1 [i.e., a, = (v + 1)ao].
Since the decay of Raman-excited vibrational nitro-gen (D 700 ns) is very much slower than the laser
pulse duration (p = 10 ns) the term AN/TD in Eq. (7) can be neglected. The average concentration (Ne) in any vibrational level v during the laser pulse is
We have numerically integrated the rate equations for
stimulated Raman pumping of v = 0 - v = 1, v = 1 - v
= 2, and v = 2 - v = 3. For the room temperature N2
spectrum in Fig. 3, I1/Io 0.019, which requires a value
of aorp of 0.42 to produce the average population ratio of Ni/No 0.080 that is inferred from the best-fit
vibrational temperature Tv = 1325 K.
This aorp can then be used to predict the stimulated Raman pumping in the flame spectrum. An unper-turbed N1/No of 0.122 was assumed (corresponding to
T = 1590 K) and the rate equations were numerically integrated with this initial condition and an aoiop value
of 0.42. The calculated value of N1N0 was 0.183
corre-sponding to a vibrational temperature of 1976 K. This is -100-K greater than the observed best-fit vibration-al temperature of 1881 K. Thus this anvibration-alysis some-what overpredicts the ratio of stimulated Raman pumping in the flame and in room temperature N2. This may be due to approximations in the analysis, or to some defocusing of the laser beams caused by refrac-tive index gradients in the flame.
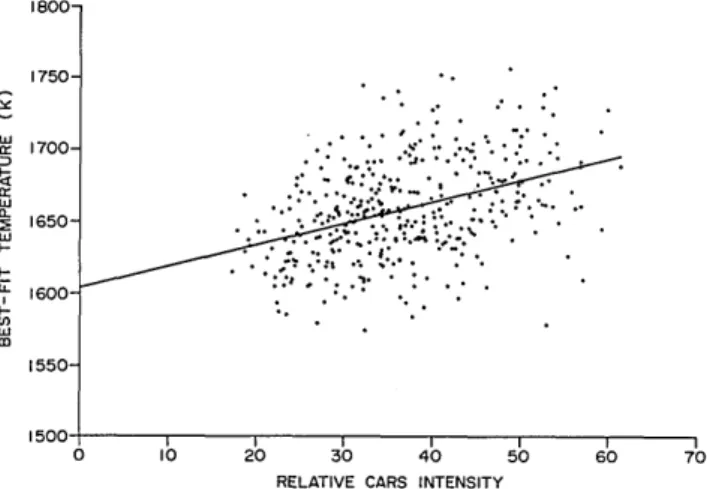
One further piece of evidence that can be adduced to
demonstrate the effect of stimulated Raman pumping is the correlation we have consistently observed be-tween best-fit flame temperature measurements and CARS intensity. The variation in CARS intensity results from shot-to-shot variation in the focal intensi-ties of the CARS laser beams, with the higher peak intensities expected to be associated with greater
stim-ulated Raman pumping of N2 v = 1. A plot of
tem-perature (T) for a file of 400 single-pulse CARS spectra
vs spectrally integrated CARS intensity () and the result of a linear regression analysis of the data is
shown in Fig. 8. (The corresponding averaged
room-temperature N2 spectrum has an J,/Io ratio of 0.008.) The linear regression analysis gave:
T = (1.5 0.2)I + 1603.8 6.3,
1 August 1989 / Vol. 28, No. 15 i APPLIED OPTICS 3239
1.0 0.8 0.6 -"' 0.4-z I-0.2 0.0 -0.2- EXPERIMENT (E) -*- THEORY (T) -- -10 x (E-T) II -- 'I .'
,t-d(
= -(AN)a - __I dt TD (7) IV,(,,) = (1/Ta) |P N,(t)dt. (8) (9)where the errors represent a single standard deviation and the average temperature was 1659 K. The
inter-cept of Fig. 8 is consistent with that of Fig. 5, both of
which should represent the best-fit temperature in the absence of any population perturbation.
The errors associated with neglecting stimulated Raman pumping and IPDA nonlinearity are partially offsetting for the data reported here. Application of the current best measurements of detector nonlinear-ity (Entry H, Table I) result in increase in best-fit temperature of -60 K (rather than the 100 K resulting from an earlier measurement that was used in the analysis of entries A-F, Table I). The stimulated Raman correction for this data reduces the best-fit flame temperatures 13 K. Thus application of both
corrections results in a CARS temperature of 1620 K,
which is 43 K greater than the Na line-reversal/ther-mocouple measurement.
For the data we reported previously0 the stimulated Raman pumping was much greater than for that in
Table I. The average value of I1/Io was 0.005 for which
the corresponding correction for stimulated Raman pumping is 45 K. This would only partially offset the effect of correcting that CARS data for detector non-linearity.
For some CARS spectrometers, the ratio of nonreso-nant to resononreso-nant CARS signal was found2 9 3 0 to in-crease with increasing correlation between the pump laser components, indicating non-Gaussian pump la-ser field statistics. With USED CARS phase match-ing the pump laser components are highly correlated (for the 0.69 cm-' bandwidth pump laser) and if such increases occurred in our experiments they would re-quire the use of an artificially high value of XNR to fit them.
The effect of a 50% increase in XNR can be seen by
comparing C and D in Table I where the best-fit tem-peratures are seen to decrease by 122 K (weighted LMS fit). Thus only an 18% increase in the nonreso-nant CARS component would be required to explain the 43-K discrepancy between CARS and Na line-reversal/thermocouple temperature measurements in the flat-flame burner. The sensitivity of the best-fit temperatures to XNR is clearly a disadvantage of USED
CARS phase matching.
D. Folded BOXCARS CARS experiments
To resolve the question of the effect of laser field statistics on CARS derived temperatures we recently repeated the CARS flame temperature measurements using folded BOXCARS phase matching with a 6.1-cm optical path difference between the pump laser com-ponents, which is greater than the 1.5-cm coherence length of the pump laser. For these uncorrelated pump laser beams no enhancement of the nonresonant
CARS components is expected. For a series of seven
experiments consisting of a total of 10,400 CARS flame spectra the average temperature obtained was 1594 7 K, using the theory corresponding to entry H, Table I, with weighting and nonlinear correction applied. The error limit is the 95% confidence interval and does not
1700- 15-1 600-' X (a 1 550-0 10 20 30 40 50 60 70
RELATIVE CARS INTENSITY
Fig. 8. Variation with relative CARS intensity of best-fit tempera-ture for 400 single-pulse CARS spectra, and a linear regression
analysis of the data.
include any estimate of possible systematic errors. The average stimulated Raman I1/Io ratio for these experi-ments was 0.0008 (considerably lower than the corre-sponding USED CARS experiments), which, from Fig. 5, would result in the best-fit CARS temperature being 6-K too high. With this correction the measured
CARS temperature of 1588 K is in satisfactory
agree-ment with the Na line-reversal/thermocouple mea-surement of 1577 i 20 K.
IV. Summary and Conclusions
The typical image persistence of the IPDA detectors used in broadband CARS spectroscopy is shown to be so great that the detectors are unsuitable for single shot 10-Hz temperature measurements in turbulent combustion. This image persistence results in a CARS spectral signature that contains contributions from many previous pulses and is biased to lower tem-peratures. This bias is expected to be a function of the exposure history over several previous pulses. An analysis of this effect by synthesizing mixtures of two CARS spectra is shown to result in large negative er-rors in best-fit CARS temperatures. A prototype de-tector with a faster rare-earth phosphor will greatly reduce this problem.
Correcting CARS spectral signatures for the recent-ly discovered'2logarithmic fall-off in IPDA sensitivity with decreasing output signal is shown to result in increases of best-fit temperature of -50-100 K at 1600 K. Comparisons of CARS-derived temperatures with those obtained by other techniques that have neglect-ed this effect have claimneglect-ed 1.0-1.5% accuracy. In our own work we find that the agreement previously claimed0 was partially due to a cancelation of errors resulting from the neglect of detector nonlinearity and stimulated Raman pumping of the N2 vibrational manifold. This may also account for the agreement observed by others.
We have demonstrated that stimulated Raman pumping can occur and we have, quantitatively as-sessed its effect on CARS-derived temperatures. The
correlation observed between the stimulated Raman
pumping of the N2 v = 1 level in room-temperature N2
spectra and the increase in best-fit temperature of the corresponding flame spectra can be used to correct for this effect. The correlation in Fig. 5 could apply to other experimental CARS configurations, provided that the room temperature N2 spectra are recorded at the same laser intensities as the flame CARS spectra. Rather than setting experimental conditions such as laser energy and focal spot sizes to avoid stimulated Raman pumping it is better to examine the room tem-perature N2 spectra (taken at the same laser energies
as the flame spectra) for the appearance of a N2 2-1
band.
With USED CARS phase matching the correlated pump beams may have resulted in an enhanced
non-resonant CARS signal. Neglecting this effect could
also have partially offset the error of ignoring detector nonlinearity. Temperature measurements made us-ing folded BOXCARS phase matchus-ing, where this
ef-fect is absent, are shown to be in good agreement with
combined sodium line-reversal/thermocouple mea-surements when corrections for detector nonlinearity and stimulated Raman pumping are applied. Image persistence does not affect this result since the mea-surements were taken in a constant temperature
source.
While this manuscript was in preparation, an addi-tional study of the effect of stimulated Raman
pump-ing on broadband CARS derived temperatures came to
our attentions Temperature errors of 7-8% at 1500 K were observed for the highest pump energy employed.
References
1. D. R. Snelling, G. J. Smallwood, and R. A. Sawchuk, "Nonlinear-ity and Image Persistence of P-20-Phosphor Based Intensified Photodiode Array Detectors used in CARS Spectroscopy," Appl. Opt. 28, 3226-3232 (1989), same issue.
2.- S. Kroll, M. Alden, P. -E. Bengtsson, and C. Lofstrom, "An Evaluation of Precision and Systematic Errors in Vibrational CARS Thermometry," J. Appl. Phys. B, to be published. 3. A. C. Eckbreth, "Optical Splitter for Dynamic Range
Enhance-ment of Optical Multichannel Detectors," Appl. Opt. 22, 2118-2123 (1983).
4. L. P. Goss, G. L. Switzer, D. D. Trump, and P. W. Schreiber, "Temperature and Species-Concentration Measurements in Turbulent Diffusion Flames by the CARS Technique," AIAA Publ. No. 82-0240 (1982).
5. M. Pealat, P. Bouchardy, M. Lefebvre, and J. -P. Taran, "Preci-sion of Multiplex CARS Temperature Measurements," Appl. Opt. 24, 1012-1022 (1985).
6. A. C. Eckbreth, "Laser Diagnostics for Combustion Tempera-ture and Species," Abacus Press, Cambridge, MA (1988). 7. D. A. Greenhalgh, "CARS Thermometry for Low and High
Pressure Combustion Systems," in Proceedings, Sixty-Seventh
AGARD Conference (No. 399) on Advanced Instrumentation for Aero Engine Components, Philadelphia (May 1986). 8. D. A. Greenhalgh and F. M. Porter, "CARS Application in
Chemical Reactors, Combustion and Heat Transfer," in
Pro-ceedings, First International Laser Science Conference, Dallas (November 1985).
9. F. Y. Yueh and E. J. Beiting, "Simultaneous N2, CO, and H2 Multiplex CARS Meaurements in Combustion Environments Using a Single Dye Laser," Appl. Opt. 27, 3233-3243 (1988). 10. D. R. Snelling, G. J. Smallwood, R. A. Sawchuk, and T.
Parames-waran, "Precision of Multiplex CARS Temperatures Using Both Single-Mode and Multimode Pump Lasers," Appl. Opt. 26, 99-110 (1987).
11. P. R. Regnier, F. Moya, and J. P. Taran, "Gas Concentration Measurements by Coherent Raman Anti-Stokes Scattering," AIAA J. 12, 826-831 (1974).
12. A. Gierulski, M. Noda, T. Yamamoto, G. Marowsky, and A. Slenczka, "Pump-Induced Population Changes in Broadband Coherent Anti-Stokes Raman Scattering," Opt. Lett. 12, 608-610 (1987).
13. D. R. Snelling, R. A. Sawchuk and R. E. Mueller, "Single-Pulse CARS Noise: A comparison Between Single-Mode and Multi-mode Pump Lasers," Appl. Opt. 24, 2771-2778 (1985). 14. D. R. Snelling, R. A. Sawchuk, and G. J. Smallwood,
"Multi-channel Light Detectors and Their Use for CARS Spectrosco-py," Appl. Opt. 23, 4083-4089 (1984).
15. A. C. Eckbreth, "BOXCARS, Crossed-Beam Phase-Matched CARS Generation in Gases," Appl. Phys. Lett. 32, 421-423 (1978).
16. D. R. Snelling, National Research Council of Canada, unpub-lished results.
17. T. Parameswaran and D. R. Snelling, "The Calculation of Theo-retical Coherent Anti-Stokes Raman Spectra," NRC Technical Report TR-GD-013 (1989).
18. M. L. Koszykowski, R. L. Farrow, and R. E. Palmer, "Calcula-tion of Collisionally Narrowed Coherent Anti-Stokes Raman Spectroscopy Spectra," Opt. Lett. 10, 478-480 (1985). 19. R. E. Teets, "Accurate Convolutions of Coherent Anti-Stokes
Raman Spectra," Opt. Lett. 9, 226-228 (1984).
20. H. Kataoka, S. Maeda, and C. Hirose, "Effects of Laser Linewidth on the Coherent Anti-Stokes Raman Spectroscopy Spectra Profile," Appl. Spectrosc. 36, 565-569 (1982).
21. M. A. Henesian and R. L. Byer, "High Resolution CARS Line Shape Function," J. Opt. Soc. Am. 68, 648-649 (1978). 22. J. P. Boquillon, M. Pealat, P. Bouchardy, G. Collin, P. Magre,
and J. P. Taran, "Spatial Averaging and Multiplex Coherent Anti-Stokes Raman Scattering Temperature-Measurement Er-ror," Opt. Lett. 13, 722-724 (1988).
23. R. J. Hall, J. P. Verdieck, and A. C. Eckbreth, "Pressure-In-duced Narrowing of the CARS Spectrum of N2," Opt. Commun. 35, 69-75 (1980).
24. L. A. Rahn and R. E. Palmer, "Studies of Nitrogen Self-Broad-ening at High Temperature with Inverse Raman Spectroscopy," J. Opt. Soc. Am. B 3, 1164-1169 (1986).
25. L. A. Rahn, in Technical Digest, Conference on Lasers and
Electo-Optics (Optical Society of America, Washington, DC, 1986), "N2Raman Linewidths in a H2-02-N2Flame by Inverse Raman Spectroscopy," paper TuK 42.
26. R. L. Farrow, R. Trebino, and R. E. Palmer, "High-Resolution CARS Measurements of Temperature Profiles and Pressure in a Tungsten Lamp," Appl. Opt. 26, 331-334 (1986).
27. J. A. Blauer and G. R. Nickerson, "A Survey of Vibrational Relaxation Rate Data for Processes Important to CO2-N2-H2O
Infrared Plume Radiation," Technical Report No. AFRPL-TR-73-57 (1973).
28. S. Druet and J. P. E. Taran, "CARS Spectroscopy," Prog. Quan-tum Electron. 7, 1-72 (1981).
29. L. A. Rahn, R. L. Farrow, and R. P. Lucht, "Effects of Laser Field Statistics on Coherent Anti-Stokes Raman Spectroscopy Intensities," Opt. Lett. 9, 223-225 (1984).
30. R. L. Farrow and L. A. Rahn, "Interpreting Coherent anti-Stokes Raman Spectra Measured with Multimode Nd:YAG Pump Lasers," J. Opt. Soc. Am. B 2, 903-907 (1985).