HAL Id: hal-02311467
https://hal.archives-ouvertes.fr/hal-02311467
Submitted on 15 Oct 2019
HAL is a multi-disciplinary open access archive for the deposit and dissemination of sci-entific research documents, whether they are pub-lished or not. The documents may come from teaching and research institutions in France or abroad, or from public or private research centers.
L’archive ouverte pluridisciplinaire HAL, est destinée au dépôt et à la diffusion de documents scientifiques de niveau recherche, publiés ou non, émanant des établissements d’enseignement et de recherche français ou étrangers, des laboratoires publics ou privés.
Limit order books, uninformed traders and commodity
derivatives: Insights from the European carbon futures
Yves Rannou
To cite this version:
Yves Rannou. Limit order books, uninformed traders and commodity derivatives: Insights from the European carbon futures. Economic Modelling, Elsevier, 2019, 81, pp.387-410. �10.1016/j.econmod.2019.07.009�. �hal-02311467�
HAL Id: hal-02311467
https://hal.archives-ouvertes.fr/hal-02311467
Submitted on 10 Oct 2019
HAL is a multi-disciplinary open access archive for the deposit and dissemination of sci-entific research documents, whether they are pub-lished or not. The documents may come from teaching and research institutions in France or abroad, or from public or private research centers.
L’archive ouverte pluridisciplinaire HAL, est destinée au dépôt et à la diffusion de documents scientifiques de niveau recherche, publiés ou non, émanant des établissements d’enseignement et de recherche français ou étrangers, des laboratoires publics ou privés.
Limit order books, uninformed traders and commodity
derivatives: Insights from the European carbon futures
Yves Rannou
To cite this version:
Yves Rannou. Limit order books, uninformed traders and commodity derivatives: Insights from the European carbon futures. Economic Modelling, Elsevier, 2019, 81, pp.387-410. �10.1016/j.econmod.2019.07.009�. �hal-02311467�
-1-
Limit order books, uninformed traders and commodity
derivatives: Insights from the European carbon futures
Yves Rannou
1This version: July 06, 2019
2Abstract
This paper provides a suitable model for studying the strategic behavior of uninformed investors that trade commodity derivatives via limit order books. Two main testable implications are obtained after solving for the model equilibrium. The adverse selection costs of uninformed traders depend on the inflow of market orders and their risk aversion. Next, the adverse selection costs of uninformed buyers and sellers and the difference of their asset valuations determine the size of their bid-ask spread.
An analysis of European carbon futures data confirms the relevance of these implications. Moreover, we detect a diagonal effect that results in a positive correlation of market orders, which is driven by adverse selection, then by order splitting strategies and by imitative strategies of uninformed traders to a lesser extent.
JEL Classification:C30, G11, G14
Keywords: Market microstructure; Limit order book; Uninformed traders; Bid-ask spread; European carbon futures
1 Tel.: +33 04 73 98 24 30. E-mail address: yves.rannou@esc-clermont.fr. Groupe ESC Clermont – Laboratory CleRMa EA 3849, 4 boulevard Trudaine, 63000 Clermont-Ferrand.
2 An earlier version of this paper was presented at the 5th International Symposium in Computational Economics
and Finance (ISCEF, Paris April 10–12 2018, www.iscef.com). I am grateful to the ISCEF participants and the two anonymous referees for their helpful comments and valuable suggestions. Special thanks are also addressed to Pascal Barneto, Olivier Brandouy, Benjamin Clapham, Jean-François Gajewski, Selim Mankai and Vito Mollica for preliminary discussions. Finally, the author gratefully acknowledges the support of Ecole Centrale Paris for supplying the data used. Any remaining errors or omissions are solely the responsibility of the author.
-2-
1. Introduction
The question in Glosten's (1994) well known paper: “Is the electronic order book inevitable?” sounded provocative a quarter of century ago but no longer does since the limit order book (LOB hereafter) has become the dominant market design (Gomber et al., 2017). The LOB changes dramatically the way of trading in the sense that liquidity is now self-organized. Any trader can provide liquidity with limit orders for which a limit price is specified or consume liquidity with market orders to trade at the prevailing market price. The unexecuted orders form the consolidated source of liquidity and the spread between the best bid and best ask prices namely the bid-ask spread proxies the cost of trading.
As more exchanges move from floor-based or dealership platforms to LOBs, an abundant theoretical literature has studied the effects of order strategies on prices and on liquidity in these electronic market microstructures. While several microstructure models have been designed for and applied to stock markets (Hasbrouck and Harris, 2006; Handa et al., 2003; etc.), currency markets (see, e.g., Katusiime et al., 2015) and futures markets (see, e.g., Hsu and Lee, 2014), very few models have been built for commodity markets to study exclusively the composition of trading costs (Ibrahim and Kalaitzoglou, 2016). By contrast, econometric estimations have been extensively used to assess the profitability of trading strategies in commodity derivatives markets such as carbon futures markets (see for example Narayan and Sharma, 2016).
To achieve the tractability of previous models, it is often assumed that uninformed traders are the only to submit limit orders (Rosu, 2018). Limit orders are subject to the risks of non-execution and of picking off (Foucault, 1999). The latter risk causes an undesirable non-execution in the case of the arrival of adverse information. Foucault (1999) shows that the picking off risk increases when the asset volatility rises. In reaction, limit order (uninformed) traders widen the spread to protect against this risk making market orders more costly. Interestingly, Marshall et al. (2011) document that the spreads in commodity markets increase with volatility as Foucault (1999) asserts, but this relationship varies across commodity families given the levels of traders’ risk aversion. Handa et al. (2003) extend Foucault (1999) by introducing an adverse selection risk due to the presence of privately informed traders. In Handa et al. (2003), the adverse selection risk and the heterogeneity of traders’ beliefs on the asset value determine the spread. The size of the spread reaches a maximum in balanced markets with equal numbers of (high value) buyers and (low value) sellers. This result is verified by Handa et al. (2003) with French CAC40 stocks data. Quite surprisingly, it has not yet been tested in commodity markets.
The purpose of this paper is to conduct a systematic study of the order strategies of uninformed investors that trade commodity derivatives in LOBs and their trading costs. To our knowledge, this study is the first to investigate the interactions between the uninformed traders’
-3-
order strategies, the bid-ask spread, and the quality of information displayed in LOBs used for commodity trading. In LOBs, uninformed traders can extract valuable information on a real time basis and learn news before others to optimise their order strategies. Therefore, their decision-making impacts information dissemination and price formation (Boco et al., 2016).
Important questions related to uninformed trading are addressed in this paper: In which circumstances do uninformed traders place either limit or market orders? Are their limit or market order flows correlated? When does the spread vary and achieve its maximum value? Do adverse selection costs mainly determine the spread in commodity derivatives markets as in stock markets (Van Ness et al., 2001)? Do adverse selection costs of buyers significantly differ from these of sellers? We attempt to answer these questions by way of our model.
Our main contribution is to develop a dynamic model that embeds the asymmetric information frameworks of Foucault (1999) and Handa et al. (2003) in a richer preference
structure by allowing traders to be risk averse.3 Formally, risk averse uninformed traders have
a constant absolute risk aversion (CARA) utility that is a function of their wealth, which correlates with the risky asset, leading to a hedging reason to trade. Another reason for uninformed trades, speculation on public information gives similar outcomes. Accordingly, our model is consistent with uninformed investors trading for hedging, for speculation, or for a mix
of these reasons (Han et al., 2016).4 Our modelling approach presents three advantages.
First, we consider that uninformed traders face the risk of picking off due to the arrival of adverse public information as in Foucault (1999), and the risk of adverse selection due to their inability to discern if the counterparty trader is informed as in Handa et al. (2003).
Second, we incorporate the heterogeneous beliefs of traders, who source public information from the LOB, into our model. A limitation of the previous models is that they rely on an analysis of risks ignoring the uncertainty faced by uninformed traders when they value the risky asset (Han et al., 2016). To address this shortcoming, our model connects this uncertainty to the processing and the source of information as in Boco et al. (2016). Specifically, we suppose uninformed traders monitor their LOB screens from which they extract public information signals. By making variable the precision of these signals, we bridge the gap between two extreme cases: a perfectly known precision or a purely noisy precision. On the basis of these signals, uninformed traders assess the arrival rates of market orders and adjust their risky asset valuations in order to revise their limit prices and/or post new orders.
3 Departure from the usual assumption of risk neutrality is rare in modelling order strategies (Rosu, 2018).
Kovaleva and Iori (2012) study the impact of a random delay in the limit order execution of a risk-averse seller in a mean-variance setting. They find that the bid-ask spread increases as his risk aversion increases.
4 In commodity markets, uninformed trading may result from hedging and portfolio management activities of
financial institutions. Uninformed trading may also be related to the algorithmic trading of institutional investors (see Han et al. (2016) for a detailed discussion on the aspects of uninformed trading in commodity markets).
-4-
Given that framework, we optimise the uninformed traders’ order strategies to derive a unique equilibrium with optimal bid and ask prices written in a closed-form solution. This equilibrium presents nice properties. One property is that the price-improving limit orders allow uninformed traders to compensate for their risks of adverse selection (Handa et al., 2003) and of picking off (Foucault, 1999). Another property relies on the relationship between the adverse section risk and the inflow of market orders. Two related testable propositions are obtained:
- the adverse selection risks of uninformed buyers (resp. sellers) are found to be negatively (resp. positively) dependent to the arrival rate of buy market orders.
- the adverse selection risks of uninformed buyers (resp. sellers) are found to be positively (resp. negatively) dependent to the arrival rate of sell market orders.
Our second contribution is to provide an innovative three-way bid-ask spread decomposition. Actually, the spread estimators such as those of Huang and Stoll (1997) and
Madhavan et al. (1997) that have been applied to commodity marketsestimate only aggregated
adverse selection costs. A reduced form of our model, which assumes that uninformed traders recognise a similar arrival rate of buy and sell market orders allows us to decompose the spread into three components: (i) adverse selection costs of buyers and (ii) of sellers respectively and (iii) differences between buyers’ and sellers’ asset valuations. Each component depends on the order flow imbalance that serves as a market competition measure (Handa et al., 2003). A first benefit is that this three-way spread decomposition may be easily implemented and tested with a one-step regression model that does not rely on complex lag structures and avoids statistical issues such as serial correlation and measurement errors (Van Ness et al., 2001). A second benefit is that it offers a flexible framework for examining a variety of microstructure issues including the intraday variations of the spread and its components. A third benefit is that this decomposition provides two additional testable model implications related to the behavior of trading costs. We demonstrate that if both the buyers’ and sellers’ adverse selection costs and the spread are affected by the degree of risk aversion, the precision of (noisy) public information only impacts the spread component due to the differences between buyers’ and sellers’ asset valuations. Then, we extend the result of Handa et al. (2003) in the sense that the spread is found to achieve a maximum (resp. minimum) size at the most balanced (resp. unbalanced) value of the order flow imbalance whatever the precision of (noisy) public information.
We empirically test our model and its above-mentioned implications by using order book
data related to the European Allowances (EUA) futures.5 We focus our attention on the EUA
5 The European Allowances (EUA) carbon market hinges upon a cap-and-trade mechanism where the supply of
EUAs (i.e. the right to emit 1 teq.CO2 in the atmosphere) is determined by political decisions of the European
-5-
carbon market, one of the solutions envisaged to finance the transition towards a sustainable low-carbon or green economy, because it presents relevant characteristics for our study: i) it is essentially a futures market that shares common features with other commodity futures markets such as a high level of risk aversion and information asymmetry (Chevallier et al., 2009; Marshall et al., 2011); (ii) liquidity and information flows are concentrated in the LOB of the ICE-ECX exchange (Ibikunle et al., 2013); (iii) given significant order flow persistence (Kalaitzoglou and Ibrahim, 2013) and price predictability (Narayan and Sharma, 2016), uninformed traders can improve the profitability of their limit orders owing to less uncertainty on prices and market directions (Galariotis et al., 2018).
Four clear results emerge from our empirical analysis. First, we verify that the size of the spread achieves its maximum value in balanced markets as predicted by our model. Second, the aggregate adverse selection costs represent on average 70% of the spread in line with the estimates of Mizrach and Otsubo (2014) and are higher for larger orders (Ibikunle et al., 2013). Third, the adverse selection costs of sellers (resp. buyers) account for 36.5% (resp. 34.1%) of the spread on average. As a result, placing limit buy orders is less risky and costly in terms of adverse selection for uninformed traders than placing sell limit orders (Ibrahim and Kalaitzoglou, 2016). Fourth, the spread and the sellers’ (resp. buyers’) adverse selection costs follow an intraday U-shaped (resp. inverted U-shaped) pattern while the spread component due to the difference between buyers’ and sellers’ valuations remains constant (29.3% of the spread on average). We explain the U-shaped pattern by the existence of an adverse selection effect after the opening period in the sell side (Rosu, 2018). Expecting a lower arrival rate of buy orders, uninformed sellers revise less frequently their valuations, perceive lower adverse selection risks and decrease their spread. In the closing period, this effect is partially offset by a dynamic efficiency effect (Rosu, 2018) at a moment where uninformed sellers interpret noisier public information. Owing to more uncertainty, they revise more frequently their valuations so the difference between buyers’ and sellers’ asset valuations increases leading to widen the spread. Instead, the adverse selection effect prevails in the opening and the closing periods for the buy side implying the inverted U-shaped pattern. Taken together, these results confirm the relevance of our model implications to study the behavior of the spread and its components.
Our third contribution lies in the evidence of a non-linear relationship between adverse selection and market orders, which echoes the two implications previously obtained from our model. Specifically, we uncover a diagonal effect that implies a strong and positive serial correlation of market orders in the European carbon futures market. Initially detected in the French stock markets (Biais et al. 1995), it is explained by adverse selection considerations in the opening period. Then, it reflects the prevalence of order splitting as informed traders prefer
-6-
submitting medium sized market orders in succession instead of placing large orders. We find that this diagonal effect is more pronounced in the closing period when public information are noisier and risk aversion is lower (Chevallier et al., 2009). This finding is subjected to scrutiny, and after controlling for some factors that are likely to affect the result, is shown to be robust.
The rest of the paper is organized as follows. In Section 2, we outline the model and characterize the order strategies of uninformed traders. The next section discusses the main testable implications of our model. Section 4 provides a numerical analysis of our model that delivers further implications. Section 5 presents the empirical analysis of our model implications using European carbon futures data. Our conclusions and an outlook for further research appear in Section 6. All proofs are gathered in the appendix.
2. The model
We consider a LOB model of two assets trading in a continuous double auction market:
(i) a single risky asset x traded with a price Px and liquidated within a time horizon T at a
stochastic value XT and (ii) a riskless bond that pays out a payoff RT at time T. The market
operates in discrete time where the assets are traded with one unit of limit or market order at
each t time step with t [1;T] . Trades occur based on the standard price and time priorities in
LOB markets.6 We now turn to the characteristics of the model.
2.1. Characteristics of the model
Trader types. Three types of traders are active in the market.
- Informed traders (I) benefit from private advantageous information about the value of the risky asset. They submit market orders to obtain immediate order execution because their information is short-lived (Handa et al., 2003; Goettler et al., 2005).
- Noise traders (N) are either feedback traders who speculate based on spurious price signals or liquidity traders that have immediate hedging or portfolio balancing needs (see for
instance Han et al., 2016). To gain immediacy, they trade by means of market orders.7
- Uninformed traders (U) are rational agents that do not hold private information but extract public information signals from their LOB screens. They are the only able to submit either limit or market orders in our model (Bloomfield et al., 2009).
6 Limit orders are further ahead in the queue (time priority) or executed if no other orders have price priority. 7 Introducing noise traders in our model is notably motivated by the work of Colla et al. (2012). Like Ibrahim and
Kalaitzoglou (2016), these authors incorporate liquidity traders who trade EUA futures for exogenous reasons in their model populated by risk averse traders maximizing CARA utility functions. To enrich their model, they suggest adding feedback noise traders who speculate with aggressive orders by extrapolating past prices.
-7-
Heterogeneous Beliefs. To study the role of heterogeneous beliefs of traders, we divide uninformed traders into two populations. Uninformed buyers (resp. sellers) have a terminal
wealth WT, which is a random variable such that: WT= Xb,t + (W1-Px)RT (resp. WT = (W1+Px)
RT - Xs,t) where W1 is their initial wealth. Xb,t and Xs,t represent the fundamental value of the
risky asset of uninformed buyers and sellers respectively. Thus, a low (resp. high) share of uninformed buyers (resp. sellers) correspond to a market with high (resp. low) fundamental value of the risky asset. Intuitively, these values will affect differently the dynamics of prices. Preferences. All market participants are risk averse and make their order strategies to maximise
their expected utility WT at time T. For the sake of convenience, we assume a CARA utility
given a parameter written in an exponential function as follows: - WT
T
u(W ) = e .
Noise and public information. Public information implies the content of all LOB information made public and visible to traders on a real-time basis through their screens. It includes the history of prices and quantity of both trades and (buy or sell) orders (Boco et al, 2016). As in Berkman and Koch (2008), we consider the net initiated order flow of noise traders per broker: OF/B as a proxy of the noise affecting the precision of public information signals.
Uninformed traders are supposed to monitor actively their screens, thereby extract and interpret noisy public information signals to revise their values of the risky asset before trading.
For instance, uninformed buyers (resp. sellers) extract and interpret a noisy signal Z b,1
(resp. Z ) at time 1 from the same LOB informational content: Ωs,1 1 before submitting orders.
Now we consider a first scenario where uninformed buyers forecast the fundamental
value of the risky asset Xb,T at time 1 (resp. time t) using the noisy signal Z that verifies b,1
1 , b T , b 1 , b X Z ~
where
b,1is an idiosyncratic shock independent of Xb,T, with mean 0 and variance2 1 , , b B
OF . Assuming that X and
b
Z~ have a joint probability function f X Zb,1
b,T b,1
at time 1 and
b,t b,T b,1
f X Z at time t, we employ the Projection theorem for normal distributions identifying that:
2 1 , , b 2 x , b 2 x , b 2 x , b 2 x , b x , b x , b 1 1 , b T , b B , N ~ Z ~ X OF at time 1; 2 1 , , b 2 x , b 2 x , b 2 x , b 2 x , b x , b x , b t 1 , b T , b B t t t t t , N ~ Z ~ X OF at time t; Where: 2 1 , , b 2 x , b 2 x , b 2 x , b B OF ε σ σ σ ρ
is the coefficient that determines the precision of the uninformed
buyers’ projection of the risky asset value onto the noisy signal.
The case of uninformed sellers is analogous. They are supposed to forecast the risky asset
-8-
whereb,1is an idiosyncratic shock independent of Xs,T, with mean 0 and variance 2
s, ,1
OF
B . Given
that X and Zs have a joint probability function f X Zs,1
s,T s,1
at time 1 and fs,t
X Zs,T s,1
at time t, wecan use the Projection theorem in a similar manner than previously. We therefore obtain the coefficient
2 1 , , s 2 x , s 2 x , s 2 x , s B OF
that determines the precision of the
uninformed sellers’ projection of the risky asset value onto the noisy signal.
By making variable 2b and 2s , we bridge the gap between two extreme cases: a perfectly
precise signal or a purely noisy signal. When 2b = 2s = 1, the signals of buyers and sellers
correspond to those held by informed traders. As 2b and 2s go down, the public information
signals become increasingly noisy and more uncorrelated across buyers and sellers.
These four key features of our model have important consequences on the limit and market order strategies of uninformed traders that we describe in the next paragraph.
2.2. The uninformed trader’s limit order strategies
Order strategies is a dynamic process that involves the submission and the revision of
limit orders.8 In our setting, uninformed traders are the only to place or revise limit orders. They
can trade with three types of traders: informed traders who arrive with a probability pI, noise
traders with a probability pN and uninformed traders with a probability pU. Next, uninformed
buyers (resp. sellers) are supposed to homogeneously recognise the arrival rate of market sell
(resp. buy) orders: kMs (resp.kMb ). From Fig. 1, we observe that a limit buy order may be: (1)
executed against informed sellers (CI), (2) executed against noisy sellers (CN), (3) executed
against uninformed sellers (CU), or (4) unexecuted (CRE). The probability that limit buy order
(uninformed) traders face informed sellers is pI×kMs , with noise sellers PN×ksM, with aggressive
uninformed sellers pU×kMs , and patient uninformed sellers with (1−k ) respectively. Ms
Alternatively, uninformed buyers can place market buy orders that will be executed against uninformed limit sell orders.
Fig. 1 also displays the configurations for which uninformed sellers can execute a limit sell order. The probability that uninformed traders execute their limit sell orders with informed
buyers is pI×kMb , with noise buyers PN×k , with aggressive uninformed buyers pMb U×k and Mb
patient uninformed buyers with 1−kMb respectively. Also, uninformed sellers have the
opportunity to post market sell orders that will be executed against uninformed limit buy orders. <Fig. 1 is inserted about here>
-9-
Henceforth, we can determine four specific profit functions of an uninformed trader submitting a limit order that will be executed (or not) at time t given the profile of counterpart
trader met (CI, CN, CU, CRE). For the different scenarios presented below, the subscript b and s
indicate the buy and sell side respectively, L denotes an uninformed trader’s limit order strategy,
E(WT) stands for his expected terminal wealth at the end of the trading period T.
Informed traders at the opposite side. Handa et al. (2003) point out that limit order traders face adverse selection when they trade with counterparty informed traders. Also, informed traders that discover private information before others trade using market orders because they aim to profit from their short-lived information (Goettler et al., 2005) or because they are risk averse (Kovaleva and Iori, 2012). For Foucault (1999), they exercise a free put (resp. call)
option of the execution price as the best bid Pbid (resp. the best ask Pask), offered by limit order
buyers (resp. sellers) in either case. By posting a limit buy (resp. sell) order conditioning on informed trades (CI) given the probability density function fbt,
Xb,TZ~b,1,CI
(resp.fs,t
Xs,TZ~s,1,CI
),an uninformed trader with a terminal wealth WT can expect the following utility:
Buy side: L
T b,1 I
RP
bt, 1 bid
bt,
b,T b,1 I
b,Tt, b Z ,C dX ~ X f P W X exp 1 , Z ~ ) W ( u Tbid C
Sell side:
s,t
s,T s,1 I
s,T P R s,t 1 ask I 1 , s T L t , s Z ,C dX ~ X f P W X exp 1 C , Z ~ ) W ( u ask T
Noise traders (N) at the opposite side. Market microstructure literature assume that noise traders use market orders to gain immediacy for the purpose of speculation or immediate hedging and portfolio balancing needs. As a result, noise sellers (resp. buyers) trade the
altruistic price Pbid (Pask) with limit order traders to obtain immediate order execution. For
Bloomfield et al. (2009), the actions of noise traders enable uninformed traders to reduce their adverse selection losses but hinder the adjustment of prices to the fundamental asset value when the market is less efficient. In either case, execution of limit orders is more uncertain because the fundamental asset value is volatile, inducing a picking off risk (Foucault, 1999) when adverse public information arrives. By placing a limit buy (resp. sell) order conditioning on trading with a noise trader (CN) and the probability density function fb,t
Xb,TZ~b,1,CN
(resp.
Z ,CN
~ X
fs,t s,T s,1 , an uninformed trader with a terminal wealth WT expects the following utility
where the first term is related to price improvement and the second term to the picking off risk:
Buy side:
b,t T 1 bid
b,t
b,T b,1 N
b,T T , b N 1 , b T , b t , b R P b,t T 1 bid T , b N 1 , b T , b t , b R P bid 1 T t , b N 1 , b T L t , b dX C , Z ~ X f P W R X exp 1 dX , Z ~ X f P W R X exp 1 dX , Z ~ X f P W R X exp 1 C , Z ~ W ( u C C T bid T bid
-10-
s,t T 1 ask
s,t
s,T s,1 N
s,T T , s N 1 , s T , s t , s R P s,t T 1 ask T , s N 1 , s T , s t , s R P ask 1 T t , s N 1 , s T L t , s dX C , Z ~ X f P W R X exp 1 dX , Z~ X f P W R X exp 1 dX , Z ~ X f P W R X exp 1 , Z ~ ) W ( u C C C T ask T ask
Sell side:Uninformed traders at the opposite side. Unlike Foucault (1999) and Handa et al. (2003), we consider the case in which an uninformed market order trader is the counterpart. Given the arrival of an uninformed market order trader, the payoff of a limit order is related to the possibility of price improvement and to the picking off risk. By submitting the limit buy (sell)
order conditioning on uninformed trade (CU) and the probability density function fbt,
Xb,TZ~b,1,CU
(resp.fst,
Xs,TZ~s,1,CU
), an uninformed trader with a terminal wealth WT expects the utility: Buy side: L
T b,1 U
bt, T
1 bid
bt,
b,T b,1 U
b,Tt, b Z , dX ~ X f P W R X exp 1 , Z~ ) W ( u C
C Sell side: L
T s,1 U
s,t T
1 ask
s,t
s,T s,1 U
s,Tt, s Z , dX ~ X f P W R X exp 1 , Z ~ ) W ( u C
C Limit orders of the opposite side. There are several reasons for an absence of incoming market orders in the opposite side. First, informed traders can submit same side market orders after obtaining information that they interpret similarly. Second, the opposite side noise traders do not place market orders. Third, uninformed traders of the opposite side may decide to place limit orders or undercut existing ones. For these three configurations, any limit order submitter loses the opportunity of price improvement and run the risks of non-execution. If limit orders cannot be executed before time T, uninformed traders are rational and prefer investing in the
bond that delivers a fixed payoff RT. By placing a limit buy (resp. sell) order conditioning on
the risk of non-execution (CNE) and the probability density function fbt,
Xb,TZ~b,1,CNE
(resp.
Z ,CNE
~ X
fst, s,T s,1 ), an uninformed trader with a terminal wealth WT has the expected utility:
Buy side: L
T b,1
T
1
b,t
b,T b,1
b,T t , b Z ,C dX ~ X f W R exp 1 C , Z ~ ) W ( u NE
NE Sell side: L
T s,1
T
1
s,t
s,T s,1
s,T t , s Z ,C dX ~ X f W R exp 1 C , Z ~ ) W ( u NE
NE 2.3. The uninformed trader’s market order strategies
If the competition for order execution makes their limit order strategies unprofitable owing to greater risks of non-execution and of picking off, uninformed traders can decide to submit market orders. By posting a market buy (resp. sell) order denoted M given a probability
density functionfb,t
X Zb,T b,1
(resp. fs,t
X Zs,T s,1
, an uninformed trader with a terminal wealth WThas the expected utility:
Buy side: M
T b,1
b,t T
1 ask
b,1
b,T b,1
b,T1 , b Z dX ~ X f P W R X exp 1 Z ~ ) W ( u
Sell side: M
T s,1
T
1 bid
s,t
s,1
s,T b,1
s,T1 , s Z dX ~ X f X P W R exp 1 Z ~ ) W ( u
-11-
3. The equilibrium of the model and the behavior of prices
3.1. The equilibrium of our model and the optimal bid and ask prices
We infer the equilibrium of our model to make optimal the uninformed traders’ order strategies. Equilibrium is here defined as a set of mutual strategies such that each uninformed trader chooses an optimal strategy given the other traders’ strategies. Given our initial model assumption, we know that the buy (resp. sell) order strategy involves two aspects:
(1) either submit a buy (resp. sell) limit order or a buy (resp. sell) market order, and (2) if a limit order is selected, determine or revise the bid or ask price at which the order is submitted. We begin by transposing the optimal order strategy of an uninformed buyer.
Normalizing the payoff of the uninformed trader to zero if the limit order expires in the case that it is not executed, we write his expected utility for a mix of limit buy order placed at
a price Pbid and a buy market order executed at Pask as follows:
1 T
b,t
b,T b,1 NE
b,T M s T , b 1 , b T , b t , b bid 1 T t , b U N M s T , b I 1 , b T , b t , b P bid 1 T t , b I M s T , b 1 , b T , b t , b ask 1 T t , b T t , b dX C , Z ~ X f R W exp 1 ) k 1 ( dX C , Z ~ X f P W R X exp 1 ) p p .( k dX C , Z ~ X f P W R X exp 1 p . k dX Z ~ X f P W R X exp 1 ) W ( u bid
(1)With:
N,U
and the respective probabilities which both verify pIpNpU1The uninformed trader observes the informational state of LOB at time t-1 to submit (or revise) his limit buy order accordingly at time t. For the sake of tractability, the probability density functions conditioning on each of his counterparts are assumed identical. Using a Taylor expansion, we obtain the linear buy side equilibrium displayed in Eq. (2). The left-hand side represents the price improvement of a limit order while the right-hand side accounts for the expected risks of adverse selection, of picking off and of non-execution.
Proposition 1.1. The uninformed buyer aims at producing a sufficient price improvement to cover the adverse selection costs due to the presence of informed traders and minimize the risks of non-execution and of picking off due to the arrival of new public information.
M M AS,RA M 2 2
s ask bid s b s b b,x
T Adverse selection risk Price improvement
due to private information Picking off risk due to adverse public information
1 B k P P k LOSS k t 1 1 R OF
Ms
b ask T
Non-execution risk 2 b 1 k F P RWith the following conditions : t 1 and 0 1
(2) • 2 1 , , b 2 x , b 2 x , b 2 x , b B OF ε σ σ σ ρ
is the explainable degree of the buyer’s projection of fundamental asset value;
• LOSS 1 p
1 N(V~ ) (1 N(Y~ )
1 exp
(R P F
b bid 1 T b b I RA , ASb is the adverse selection
-12-
sell orders, his probability to trade with an informed trader (PI), his revised fundamental value
of the risky asset 2 2 2
b b b,1 b b,x b,x 1 F Z (1 ) 2
and the following two variables:
2 2 2 2 2 2 bid T b b,1 b b,x b b,x bid T b b,1 b b,x b b 2 2 2 b,x b,x b and OF P R Z (1 ) (1 ) t P R Z (1 ) B V Y OF OF t t 1 B B Appendix A.1 shows the proof.
□
Similarly, the uninformed seller observes the informational state of LOB at time t-1 to submit (or revise) his limit sell order accordingly at time t. He is indifferent between placing a limit order or a market order if his expected utility from trading via a market order executed at
the bid price Pbid equals that from trading with a limit order submitted at the ask price Pask:
1 T 1
s,t
s,T s,1 NE
s,T M b T , s 1 , s T , s t, s t, s ask 1 T U N M b T , s I 1 , s T , s t , s P T 1 ask s,t I M b T , s 1 , s T , s t , s t , s bid 1 T T t, s dX C , Z ~ X f R W exp 1 ) k 1 ( dX C , Z ~ X f X P W R exp 1 ) p p .( k dX C , Z ~ X f X P W R exp 1 p . k dX Z ~ X f X P W R exp 1 ) W ( u ask
(3)With
N,U
and the respective probabilities verify pIpNpU1We derive the linear equilibrium for the sell side in a similar manner. Again, the left-hand side of the Eq. (4) represent the expected price improvement of a limit order over a market order, while the right-hand side encapsulates the expected risk of adverse selection but also these of picking off and of non-execution specific to a limit sell order.
Proposition 1.2. The uninformed seller aims at producing a sufficient price improvement to cover the adverse selection costs due to the presence of informed traders and minimize the risks of non-execution and of picking off due to the arrival of new public information.
M M AS,RA M 2 2
b ask bid b s b s s,x
T Adverse selection risk Price improvement
due to private information Picking off risk due to adverse public inform
1 B (1 k ) P P k LOSS k t 1 1 ρ σ R OF
Mb
bid T S
Non-execution risk ation 2 s 1 k P R FWith the following conditions : t 1 and 0 ρ 1
(4) • 2 1 , , s 2 x , s 2 x , s 2 x , s B OF ε σ σ σ ρ
is the explainable degree of the seller’s projection of fundamental asset value;
• AS,RA I
s s
T
1 ask
s
s Y) 1 exp (R P F ~ ( N 1 ( ) V~ ( N 1 p 1 LOSS is the adverse selection
-13-
buy orders, his probability to trade with an informed trader (PI), his revised fundamental value
of the risky asset
2 x , s x , s 2 s 1 , s 2 s s 2 1 ) 1 ( Z ~
F and the following two variables:
2
s 2 x , s 2 x , s 2 s x , s 2 s 1 , s 2 s T ask s 2 x , s x , s 2 s 1 , s 2 s T ask s 1 t B OF t B OF ) 1 ( ) 1 ( Z R P Y~ and t B OF ) 1 ( Z ~ R P V~ Appendix A.1 shows the proof.
□
Foucault (1999) and Handa et al. (2003) do not discriminate the risks of adverse selection and of non-execution for buyers and sellers. By contrast, Propositions 1.1 and 1.2 differentiate the three main risks of limit orders: adverse selection, picking off and non-execution for uninformed buyers and sellers respectively. In addition, they stipulate three conditions that make the order strategies of uninformed traders more profitable.
First, their price-improving limit orders should provide enough profits to cover the losses due to adverse selection (Handa et al., 2003) and the picking off risk (Foucault, 1999).
Second, they adjust their buy or sell reservation values of the risky asset given the level
of volatility, of their risk aversion and modify the price of their limit orders accordingly.9
Third, uninformed buyers (resp. sellers) become more (resp. less) aggressive when they interpret a noisy public information signal of favorable valuation, because they are more concerned about the non-execution (resp. picking off) risk. Then, the related changes in the risks of non-execution and of picking off induce a revision of limit prices for both LOB sides.
In the view of the latest condition, a fully revealing equilibrium in which fully precise signals are progressively revealed into prices is unlikely. Instead, Proposition 2 focuses on a signal-revealing, complete equilibrium solved from the partial buy and sell sides’ equilibrium strategies determined in Eqs. (2) and (4).
Proposition 2: There is a unique and signal revealing equilibrium of price quotation for a
given trading time t which involves the following optimal bid (Pbid) and ask (Pask) prices:
2 2 , , 2 2 2 2 , , 1 1 1 1 1 ( 1) 1 2 1 1 1 1 ( 1) 1 1 for 1 2 1 M M M b s b AS bid M M b M M b x b b b x T s b T s b M AS AS b b s b b x s s x M M T s b k k k B P F LOSS t R k k R k k OF k B LOSS LOSS t t R k k OF (5)
2 2 , , 2 2 2 2 , , 1 1 1 1 1 ( 1) 1 2 1 1 1 1 ( 1) 1 1 2 1 M M M s b s AS ask M M s M M s x s s s x T s b T s b M AS AS s b s b b x s s x M M T s b k k k B P F LOSS t R k k R k k OF k BLOSS LOSS t for t
R k k OF 1 (6)
-14-
The first part of the bid price Pbid reflects the reservation values of market sell order
traders and limit buy order traders. The reservation value a risk-averse market sell order trader is adjusted for the asset volatility while this of a risk-averse limit buy order trader accounts for
the asset volatility given the discount rate 2
b,x b,x T 1 1 R 2
and for the adverse selection loss:
2
2 , , 1 1 ( 1) 1 2 AS b x b b b x T B LOSS tR OF .Similarly, the first part of the ask price Pask reflects the
reservation values of market buy order traders and limit sell order traders.
The last part of Pbid and Pask relies on the difference between the uninformed buyers’ and
sellers’ adverse selection losses. For Glosten (1994), limit order sellers augment their ask prices to cover their adverse selection losses when they trade with informed traders. Limit order buyers increase their bid prices to the same extent because the LOB is symmetric. However, this result is not valid when uninformed traders face asymmetric adverse selection risks. Intuitively, uninformed sellers (resp. buyers) may prefer placing market buy (resp. sellers) orders if they perceive too high adverse selection risks compared to those of buyers (resp. sellers), accompanying the escalation (resp. decrease) of the bid price and the ask price. Consequently, uninformed traders who face lower adverse selection risks benefit from a price advantage over the other side uninformed traders who face higher adverse selection risks. In that way, the advantageous LOB side transfers a part of their adverse selection costs to the other LOB side.
Last but not least, we verify that the arrival rate of market buy and sell orders determines
the location of Pbid (Pask) between the reservation values and the size of buyers’ and sellers’
adverse selection losses respectively. Proposition 3 focuses on the dependence of adverse selection losses to changes in the arrival rate of market orders.
Proposition 3. The expected adverse selection losses recognised by uninformed traders are directly affected by the arrival rates of market buy and sell orders.
(a) The adverse selection losses expected by uninformed buyers (resp. sellers) are negatively (resp. positively) associated with the arrival rates of market buy orders, implying:
AS M b b LOSS / k < 0 (resp. AS M s b LOSS / k > 0 )
(b) The adverse selection losses expected by uninformed sellers (resp. buyers) are negatively (resp. positively) associated with the arrival rates of market sell orders, implying:
AS M b b LOSS / k > 0 (resp. AS M s s LOSS / k < 0 )
Proof of Proposition 3 is given in Appendix A.2.
□
3.2. An innovative three-way decomposition of the bid-ask spread
As a first step toward the study of price formation, the order strategies of uninformed traders are scrutinized in a fairly structured baseline model. In the following paragraph, we
-15-
propose a reduced form of our model in which uninformed traders homogeneously expect a
similar arrival rate of buy and sell market orders denoted k such that M M
b s
k = k = k . k is a market
competition measure that directly affects the probability of order execution as shown in Fig. 2. <Fig. 2 is inserted about here>
Let us consider two extreme cases. If k tends to unity, most of traders are sellers. They can opt for two strategies, either they decrease the bid price of their limit orders or they decrease ask price of their market sell orders to reduce the risk of non-execution. Given these revisions, bid and ask prices approach their reservation values and the spread should decrease. At the opposite side, few numbered buyers have a price competitive advantage but are still concerned by the risks of adverse selection if sellers are informed.
If k is close to zero, outnumbered buyers are likely to push their prices of limit buy orders up to remain competitive or increase the ask price of market buy orders to reduce the non-execution risk. As a result of these actions, the bid-ask spread narrows. At the opposite side, uninformed sellers benefit from a price competitive advantage even though they still run the risks of adverse selection if buyers are informed.
From these two extreme cases, we understand that the parameter k determines the size of
the spread and the level of adverse selection risks. To prove this point, we replace M
s
k and M
b
k by
k in both Eqs. (4) and (5). We thus obtain Proposition 4 that presents a novel decomposition of the spread in three components, which their respective influences depend on the value of k. Proposition 4. If uninformed traders expect an equivalent arrival rate of buy and sell market orders, the equilibrium bid-ask spread π is composed of three components: the adverse selection costs of uninformed buyers and uninformed sellers and the difference between their respective risk-adjusted asset valuations.
s T 3 b T 2 s b T 1 ASC R ASC R V R V R R (7)With the weights:
) k 1 ( k 1 ) k 1 ( k 1 ; ) k 1 ( k 1 k2 2 ; ) k 1 ( k 1 ) k 1 ( 2 3 such that ω1 + ω2+ ω3 = 1.
Given the following components:
- ) 2 1 ( ) 1 ( Z ~ V R 2 x , b b x 2 b t , b 2 b
b : the risk-adjusted asset valuation of a buyer;
- ) 2 1 ( ) 1 ( Z ~ V R 2 x , s s x 2 s t , s 2 s
s : the risk-adjusted asset valuation of a seller;
- AS,RA b 2 x , b 2 b b (t 1) (1 ) LOSS B 2 1 ASC OF
: the discounted adverse selection costs of a buyer;
- AS,RA s 2 x , s 2 s s (t 1) (1 ) LOSS B 2 1 ASC OF
: the discounted adverse selection costs of a seller.
Proof of Proposition 4 is given in Appendix A.3.
-16-
This three-way decomposition suggests a non-linear relationship between the market competition measure k and the bid-ask spread. Under an extreme market competition (k=0%)
(resp. k=100%), the factor related to adverse selection ω3=1 (resp. ω2=1) determines the
bid-ask spread and the spread has a minimum size consistent with the result of Handa et al. (2003). Conversely, a well-balanced market (k=50%) implies a maximum value for the spread as in
Handa et al. (2003), which is equally weighted such that ω1=ω2= ω3=1/3.
Then, we allow for variations of precisions of noisy signals between two extreme cases:
a perfect precision and a very incomplete precision to study the effects of the heterogeneity of beliefs on the spread along the Corollary 1 and Corollary 2.
Corollary 1: In the case of perfect precision of public information signals for buyers and sellers
implying that both b = s=1 and B 1
OF , the bid-ask spread π verifies the following equation:
AS s T 3 AS b T 2 t , s t , b T 1 LOSS R LOSS R Z ~ Z ~ R (8a)Corollary 2: In the case of very imprecise public information signals for buyers and sellers
implying that both b and s= 0 and 0
OF
B , the bid-ask spread π is written as follows:
AS s T 3 AS b T 2 s b T 1 LOSS R LOSS R ) V R V R ( R (8b) Where: 2 x , b x , b b 2 1 V R (resp. 2 x , s x , s s 2 1 V
R ) are the risk adjusted valuation of buyer
(resp. seller) on the fundamental value of the risky asset.
Appendix A.4 shows the proof.
□
When the noisy signal of uninformed traders is more precise (
b2→1 and2 s
→1), theirrevised fundamental values are closer to their noisy signal. Intuitively, if they can access to valuable public information on a real-time basis, they are prone to consider the noisy signal rather than their original risk-adjusted valuations. Besides, the difference of their revised fundamental valuations depends on their original valuations but also on volatility, risk aversion, and precisions of the noisy (buyers’ and sellers’) signals, meaning the value of the three factors of the spread is uncertain. By contrast, when the uninformed traders’ noisy signal is less precise
(
b2→0 and2 s
→0), their revised fundamental values approach the risk-adjusted valuations.Because the valuations among traders are made more heterogeneous, the factor ω1 and the size
of the spread increase. This finding is consistent with Handa et al. (2003) inferences.
Overall, the Corollaries 1 and 2 generalise the result of Handa et al. (2003) to the extent that the spread is found to have a maximum size in balanced markets (with k equal to 0.5) whatever the precision of (noisy) public information. In that way, they confirm the capacity of our three-way decomposition of the spread to take changing market conditions into account.
-17-
4. Numerical analysis of the model and implications for the spread
Althrough our model offers a simple bid-ask spread decomposition, its unique solution is not written in a linear closed form. To transform Eq. (7) in a linear form, we assume that the expected value of the terminal wealth ranged from zero to unity. Based on this assumption, we
set up the parameters’ values for a numerical analysis of our model: b,x= 0.12, s,x= 0.11, their
respective variances: σb=0.003 and σs=0.003, R=1.01, =1, the arrival rate of market orders :
5 . 0 k k k M s M b
and the precision of noisy signals
s b OF OF B B = 0.2. We proceed by a recursive
process on the conditions for model equilibrium to have convergent solutions. We thus explore model implications using numerical tests drawn from independently tuning the parameters.
Fig. 3 shows the effect of a variation in the arrival rate of market buy order combined with a change in risk aversion on the value of the spread and adverse selection costs. We confirm the implications of Proposition 3, namely the sellers’ (resp. buyers’) adverse selection costs are negatively (resp. positively) associated with the arrival rates of market buy orders. We also observe that both the sellers’ and buyers’ adverse selection costs and the size of the spread increase when risk aversion is higher as predicted by the model of Kovaleva and Iori (2012).
<Fig. 3 is inserted about here>
Fig. 4 plots the adverse selection costs of buyers and sellers as the precision of their noisy signals equally vary. The adverse selection costs are more sensitive to a shift in the level of risk aversion than a change in the precision of noisy signals. To compensate for higher adverse selection risks in a context of less precise noisy signals, uninformed traders who are risk averse revise more frequently their reservation values downward and hence increase their spreads.
<Fig. 4 is inserted about here>
Fig. 5 shows the variations of the spread and the differences of asset valuations (ω1) given
changes in the volatility of asset values and in the precision of noisy signals. We observe that
the size of the spread (resp. ω1) is positively (resp. negatively) to the precision of noisy signals.
Indeed, if uninformed traders interpret more precise signals, they revise more frequently their risk-adjusted values, so the difference of asset valuations increases leading to widen the spread.
<Fig. 5 is inserted about here>
To summarise the above findings, we note that, on the one hand, both the noise and the volatility impact the spread component related to the difference of asset valuations, which in turn influences the picking off risk (Foucault, 1999). On the other hand, if the arrival rate of markets orders affects the adverse selection costs, the magnitude of their effects depends on the level of risk aversion to a large extent. This latter result implies that the spread increases as the level of risk aversion rises, an implication also obtained by Kovaleva and Iori (2012).
-18-
5. Empirical Analysis
5.1. Presentation of the European carbon futures market
The European carbon (EUA) market is essentially a futures market dominated by ICE-ECX, a leading commodity derivatives platform in Europe that concentrates 92% of the EUA futures volume since 2008 (Ibikunle et al., 2013). The ICE-ECX platform operates with a LOB using usual price/time priority rules for order execution and where orders are placed without restriction. Official trading starts at 7:00 and ends at 17:00 GMT from Monday to Friday.
5.2. Data selection
We study an exhaustive sample of five EUA ECX December futures, which are the most liquid EUA futures contracts (Mizrach and Otsubo, 2014) during their latest year of maturity when they concentrate most of traders’ attention. This sample spans the period March 1, 2008 to December 31, 2012 and is relevant for two reasons. First, this period is selected by Ibrahim and Kalaitzoglou (2016) and corresponds to the Phase II of the EU ETS (2008-2012) during which the EUA market has experienced significant developments in liquidity and maturity. Second, our data set is at least double in size compared to previous papers that decompose the bid-ask spread of EUA futures (e.g., Medina et al., 2014) using high frequency order book data.
We retrieve historical ICE-ECX market conditions from the Thomson Reuters Tick History database (TRTH). Historical data files record rich information, including a transaction file recording all trades with their timestamps, prices, quantities and directions (buy or sell), and a quote file, which lists all the updates (with corresponding price and quantity of orders) standing in the LOB at the five best ask and best bid prices. Because the clock used to timestamp the transaction and quote files are not perfectly synchronised, market orders cannot be easily distinguished from cancelled orders. Therefore, we employ the well-established matching procedure of Muni Toke (2016) to qualify orders as market orders.
We thus apply several filters to clean trade and order book data. Trades executed in the pre-opening period (6:45 to 7:00) or in the after-hours market are discarded. We remove orders above or below 50 ticks from the best quote to avoid the presence of stale or erroneous orders.
5.3. Bid-ask spreads, timing and size of trades
From the TRTH database, we generate all necessary liquidity variables to examine the validity of our testable model implications. We first compute the proportional bid-ask spread:
i Best Pask Best Pbid / Best Pask Be Pst bid /2
-19-
Akin to Handa et al. (2003), we calculate the order imbalance as a proxy of our market
competition measure k: 10
number of trades at the ask limit sell orders submitted 100% number of trades at the ask and bid limit buy and sell orders submitted
k
Given the k parameter, we obtain the weights of PBAS components as follows:
Weight of the difference in risk-adjusted valuations (ω1%) = k×(1-k)/ [1-k×(1-k)]
Weight of the buyer’s expected loss of adverse selection (ω2%) = (k)²/ [1-k×(1-k)]
Weight of the seller’s expected loss of adverse selection (ω3%) = (1-k)²/ [1-k×(1-k)]
To examine the intraday dynamics of PBAS and its components, we partition each trading day into 15-minute intervals. This interval is a tradeoff between too much aggregation and noisy a dataset, which allows us to obtain estimates without much loss of data synchronicity.
Panel A of Table 1 presents the monthly means and standard deviations for the above
variables of interest. We can see that the mean spread (PBAS) (resp. trade size) decreases by
1% (resp. increases by 26%) between May and September. Instead, we observe an opposite evolution of PBAS and trade size for the period November-April that occurs before the
compliance events during which information asymmetry is greater.11 These two results indicate
a negative relation between trade size and the bid-ask spread detected by Medina et al. (2014). Furthermore, our model implies that the spread and its components are both dependent upon the value of the parameter k%. We follow the method of Handa et al. (2003) to explore the linkages between the bid-ask spread, its components and k% in more details. We divide our sample into two parts where the first part is k% larger than 50% and the second part is k% smaller than 50%. We observe that in the region where k is greater than 0.5, the spread (PBAS) is positively related to k. When k is closer to 0.5, it achieves its highest levels as in Handa et al. (2003). The adverse selection components follow an opposite trend, being lower (resp. higher) when the order flow is proportionately more concentrated on the sell side (resp. balanced). Also, the behaviors of PBAS and its three factors over values of k are consistent with Proposition 4 even if the impact of informed trading needs to be assessed.
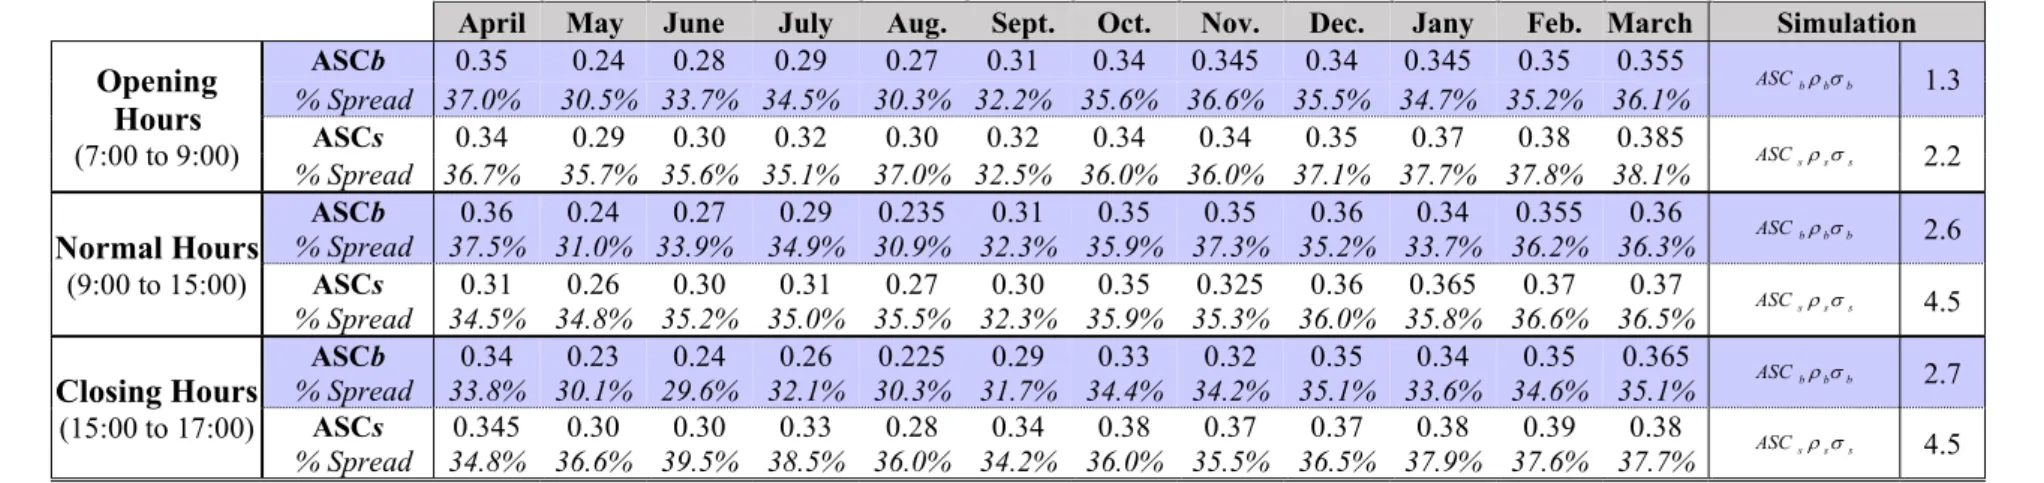
Panel B of Table 1 presents the results of univariate regressions of PBAS over three time periods. Consistent with Medina et al. (2014) and Ibikunle et al. (2013), we find that spreads are higher at the opening period (7:00 to 9:00), then decline in normal hours (9:00-15:00) and increase during the latest two hours (15:00 to 17:00) whatever the month considered. In the latest two hours, when the flow of information is more intense, informed traders are likely to trade more to benefit from better liquidity conditions and less price uncertainty. In reaction,
10 For the purpose of robustness tests, we have estimated k over a 30-minute interval but also calculated k with the
immediate LOB depth (limit orders posted at the best bid or ask). Our results were qualitatively similar.
11 The compliance events take place each year between April 30th (submission of carbon emissions results by
-20-
uninformed traders are likely to undercut their bid and ask quotes leading to widen the spread. In accordance with Propositions 1.1 and 1.2, they require a higher risk premium for their limit orders to compensate for higher adverse selection risks (Glosten, 1994; Handa et al., 2003).
<Table 1 is inserted about here>
Hitherto, our emphasis on the relation between the order imbalance k% and the spread provide results in line with these of Handa et al. (2003). Besides, in our model, k%
simultaneously generates ω1, the weight of the difference in asset valuations and the adverse
selection costs of buyers and sellers (ω2%)and(ω3%). Hence, we consider ω1, ω2, ω3 altogether
with the spread PBAS. In this respect, we perform two model regressions (PBAS%) to assess whether the spread decomposition remains robust to changing market conditions.
In a first regression model, we consider time intervals as the unique control variable. Ibrahim and Kalaitzoglou (2016) find that the realised volatility (resp. spread) over all trades tends to increase until 15:00 and fall (resp. increases) towards market close (15:00-17:00). Ibikunle et al. (2013) measure higher spreads and adverse selection costs in the opening period (7:00-9:00) and in closing hours (15:00-17:00) when market prices are noisier. In a related study, Ibikunle et al. (2016) assess the impact of the informed traders’ strategies on spreads and adverse selection costs: intense at the open and mild at the close, which can explain the U-shaped pattern of the spread. Building on this literature, we assume that time intervals capture the effects of informed trading and noise on spreads.
We therefore include three time intervals INTj as they were determined by Ibikunle et al.
(2016) into the below regression model:
3 3 b s 2 b,t b s 3 j s,t b s t j 1 j 1 RV ASC RV ASC RV
t jPBAS INT INT (9)
Where:
RVbsRVbRVs: the difference between risk-adjusted valuations of buyers and sellers;
ASCb (resp. ASCs): the adverse selection costs of buyers (resp. sellers) are defined in Eq. (7);
INTj takes the value INT1 if PBAS is observed between 7:00 and 9:00; INT2 if PBAS is
between 9:00 and 15:00; and INT3 if PBAS is between 15:00 and 17:00;
εt is the random error term.
Prior research on the EUA futures market provide evidence that the price impact of trades is non-linear in size (Frino et al., 2010; Ibikunle et al., 2013, 2016). Palao and Pardo (2014) show that carbon traders tend to adjust their trades as a multiple of five contracts when uncertainty are higher and prices noisier. Kalaitzoglou and Ibrahim (2013) and Ibikunle et al. (2016) find that informed traders split large block orders (with a minimum size of 50 contracts) into smaller ones to reduce their price impact and hide their informational content after the opening period. In line with this literature, we consider a second regression model where the