HAL Id: hal-03116008
https://hal.archives-ouvertes.fr/hal-03116008
Submitted on 20 Jan 2021
HAL is a multi-disciplinary open access
archive for the deposit and dissemination of
sci-entific research documents, whether they are
pub-lished or not. The documents may come from
teaching and research institutions in France or
abroad, or from public or private research centers.
L’archive ouverte pluridisciplinaire HAL, est
destinée au dépôt et à la diffusion de documents
scientifiques de niveau recherche, publiés ou non,
émanant des établissements d’enseignement et de
recherche français ou étrangers, des laboratoires
publics ou privés.
aircraft campaign over European TCCON sites
J. Messerschmidt, M. Geibel, T. Blumenstock, H. Chen, N. Deutscher, A.
Engel, D. Feist, C. Gerbig, M. Gisi, F. Hase, et al.
To cite this version:
J. Messerschmidt, M. Geibel, T. Blumenstock, H. Chen, N. Deutscher, et al.. Calibration of
TC-CON column-averaged CO2 the first aircraft campaign over European TCTC-CON sites. Atmospheric
Chemistry and Physics, European Geosciences Union, 2011, 11 (21), pp.10765-10777.
�10.5194/acp-11-10765-2011�. �hal-03116008�
www.atmos-chem-phys.net/11/10765/2011/ doi:10.5194/acp-11-10765-2011
© Author(s) 2011. CC Attribution 3.0 License.
Chemistry
and Physics
Calibration of TCCON column-averaged CO
2
: the first aircraft
campaign over European TCCON sites
J. Messerschmidt1,**, M. C. Geibel2, T. Blumenstock3, H. Chen2,*, N. M. Deutscher1, A. Engel7, D. G. Feist2, C. Gerbig2, M. Gisi3, F. Hase3, K. Katrynski6, O. Kolle2, J. V. Lavriˇc2, J. Notholt1, M. Palm1, M. Ramonet5,
M. Rettinger4, M. Schmidt5, R. Sussmann4, G. C. Toon9, F. Truong5, T. Warneke1, P. O. Wennberg8, D. Wunch8, and
I. Xueref-Remy5
1Institute of Environmental Physics, University of Bremen, Bremen, Germany 2Max Planck Institute for Biogeochemistry, Jena, Germany
3IMK-ASF, Karlsruhe Institute of Technology (KIT), Karlsruhe, Germany
4IMK-IFU, Karlsruhe Institute of Technology (KIT), Garmisch-Partenkirchen, Germany 5Laboratoire des Sciences du Climat et l’Environnement (LSCE), Gif-sur-Yvette, France 6AeroMeteo Service, Bialystok, Poland
7Institute for Atmospheric and Environmental Sciences, University of Frankfurt, Frankfurt, Germany 8California Institute of Technology, Pasadena, CA, USA
9Jet Propulsion Laboratory, Pasadena, CA, USA
*now at: NOAA-ESRL, Boulder, CO 80305, USA
**now at: California Institute of Technology, Pasadena, CA, USA
Received: 14 March 2011 – Published in Atmos. Chem. Phys. Discuss.: 12 May 2011 Revised: 30 September 2011 – Accepted: 13 October 2011 – Published: 2 November 2011
Abstract. The Total Carbon Column Observing Network (TCCON) is a ground-based network of Fourier Transform Spectrometer (FTS) sites around the globe, where the column
abundances of CO2, CH4, N2O, CO and O2 are measured.
CO2is constrained with a precision better than 0.25 % (1-σ ). To achieve a similarly high accuracy, calibration to World Meteorological Organization (WMO) standards is required. This paper introduces the first aircraft calibration campaign of five European TCCON sites and a mobile FTS instrument. A series of WMO standards in-situ profiles were obtained over European TCCON sites via aircraft and compared with retrievals of CO2column amounts from the TCCON instru-ments. The results of the campaign show that the FTS mea-surements are consistently biased 1.1 % ± 0.2 % low with re-spect to WMO standards, in agreement with previous TC-CON calibration campaigns. The standard a priori profile for the TCCON FTS retrievals is shown to not add a bias. The same calibration factor is generated using aircraft pro-files as a priori and with the TCCON standard a priori. With a calibration to WMO standards, the highly precise TCCON CO2measurements of total column concentrations provide a
Correspondence to: J. Messerschmidt (messerschmidt@iup.physik.uni-bremen.de)
suitable database for the calibration and validation of nadir-viewing satellites.
1 Introduction
Carbon dioxide (CO2) is the most abundant anthropogenic greenhouse gas (GHG), and its increase is driving global cli-mate change. To understand clicli-mate change, both the mon-itoring and the prediction of CO2abundances are important. Monitoring is necessary to improve our understanding of processes governing the CO2 cycle, and it is also of major interest for measuring the success or failure of emission re-duction or sequestration schemes. Prediction will become an even more important factor as the consequences of climate change will increasingly affect human and natural systems.
Currently the sources and sinks of CO2are determined by two different approaches: bottom-up and top-down. The for-mer estimates the carbon budget by starting with process in-formation at the scale of a few square meters, requiring up-scaling to provide information at regional scales. The latter uses atmospheric inverse transport modeling to derive sur-face flux distributions from atmospheric concentration mea-surements. Until recently the top-down approach was solely based on a network of in-situ boundary layer measurement
stations. This approach is limited by the sparse spatial cover-age of the sampling sites (Marquis and Tans, 2008), but also by the dependence and sensitivity of sink estimates to the as-sumed vertical model transport (Baker et al., 2006; Stephens et al., 2007).
To improve the constraint on carbon cycle processes and for a global coverage, the space agencies JAXA, ESA, and NASA have launched an ambitious effort to map the in-tegrated column of CO2 and CH4 by satellite observations (e.g. GOSAT, CarbonSat, OCO-2). The space-based obser-vations can significantly improve the source-sink estimates by improving the description of the CO2 distribution, pro-vided they are sufficiently precise and accurate (Rayner and O’Brien, 2001).
TCCON is a worldwide network of ground-based FTSs
that was founded in 2004. It has been largely used as
a calibration and validation resource for satellite measure-ments (e.g. Reuter et al., 2011; Morino et al., 2011), but also provides insights into carbon cycle science (e.g. Yang et al., 2007; Keppel-Aleks et al., 2011). The individual TC-CON sites are operated by various institutions around the world (e.g. Washenfelder et al., 2006; Wunch et al., 2011; Deutscher et al., 2010; Geibel et al., 2010). TCCON data products are column-averaged dry-air mole fractions, e.g.
XCO2, XCH4, XN2O, XCO. TCCON measurements for CO2
show a precision better than 0.25 % (∼1 ppm) (1-σ ) (Wunch et al., 2011). Under clear sky conditions, precisions of even 0.1 % (1-σ ) can be achieved (Washenfelder et al., 2006; Messerschmidt et al., 2010; Deutscher et al., 2010). With its sufficiently precise measurements of total columns of green-house gases, FTIR spectrometry is currently the most suit-able measurement technique to validate and calibrate satellite total column measurements.
To provide the link between satellite measurements and the ground-based in-situ network, a sufficiently accurate con-straint of trace gas abundances is of critical importance. Ref-erencing the TCCON measurements to the WMO calibration scale is achieved using aircraft and balloon profiling above the FTS stations.
The first calibration campaign of a TCCON site was de-scribed by Washenfelder et al. (2006). The calibration to the WMO reference scales revealed a bias of 2 % for the Park Falls site, and showed an excellent correlation. Deutscher et al. (2010) describe the calibration campaign of the TC-CON site in Darwin, Australia and yield a low bias of about 1 % with respect to WMO standards. Additionally the agree-ment between Darwin and the first calibration campaign data was shown. Wunch et al. (2010) included further calibration campaigns of TCCON sites in the United States of Amer-ica, Japan, and New Zealand and harmonized the calibration method for all sites. All calibration campaigns yield consis-tently a single calibration factor of 0.989 ± 0.002 (2-σ ) for CO2.
This paper introduces the first aircraft calibration cam-paign of European TCCON sites with the same TCCON data
retrieval as used by Wunch et al. (2010). During the cam-paign, in-situ profiles to high altitude were obtained with an aircraft above five European TCCON sites and a mobile FTS system in Jena, Germany. An overview of the campaign and the results for CO2will be presented in this paper. The re-sults show a European TCCON sites calibration factor for CO2 of 0.989 ± 0.002 (2-σ ) consistent with other TCCON sites (Wunch et al., 2010).
2 The IMECC campaign
The EU project, Infrastructure for Measurement of the Euro-pean Carbon Cycle (IMECC), is an Integrated Infrastructure Initiative within the Sixth Framework Programme of the Eu-ropean Commission. The aim of the IMECC project is to build the infrastructure necessary for the characterization of the European carbon balance. 30 partners within 15 countries are contributing for four years (2007–2011) in three main initiatives. The first focuses on the improved comparabil-ity of European CO2measurements. The second targets on establishing a broad, co-ordinated and accessible European CO2database. The implementation of new measurement ap-proaches is supported in the third initiative.
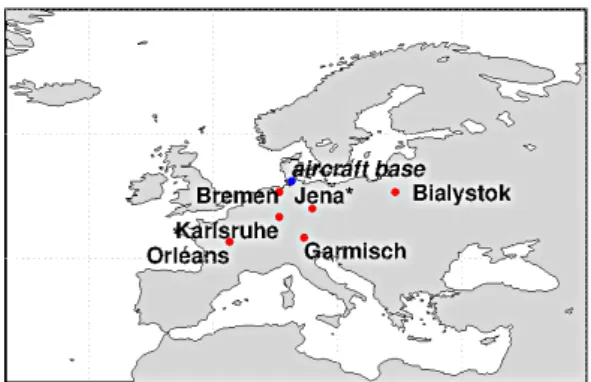
The first airborne campaign to calibrate FTS sites in Eu-rope with respect to WMO standards (Zhao and Tans, 2006) was funded by the IMECC project. Organization of the flight tracks, the aircraft instrumentation and the post-flight anal-ysis of the aircraft in-situ data was undertaken by the Max Planck Institute for Biogeochemistry (MPI-BGC). The main purpose of the campaign was the calibration of the following European TCCON sites: Bialystok (Poland), Bremen (Ger-many), Garmisch (Ger(Ger-many), Karlsruhe (Ger(Ger-many), and Or-léans (France), and the mobile FTS system located in Jena (Germany), which was built to be deployed at Ascension Is-land. Figure 1 shows the locations of the calibrated sites and the airbase of the IMECC campaign in Hohn, Germany.
The calibration flights took place between 28 September and 9 October 2009. The in-situ instrumentation was on board a Learjet 35A, operated by enviscope GmbH (Frank-furt a. M., Germany), with a flight ceiling of 13 km. Near the European TCCON sites, high altitude in-situ profiles were taken, typically from 500 m up to 13 000 m. The lowest 5 km were mostly flown in spirals, however, due to e.g. air traffic restrictions, this approach had to be modified at some sites. A typical aircraft profile is shown in Fig. 2. Additional dips were performed during the transfer flights from the airbase. Overall, eight flights were made on four days. In about 20 flight hours, 16 vertical profiles were generated over the Eu-ropean TCCON sites at solar zenith angles (SZAs) ranging from 51 to 84 degrees. The flight overpasses are listed in Table 1. During all flights, in-situ data were taken for CO2, CH4, H2O, CO, N2O, H2, SF6.
The FTS sites were operated at the time of the campaign by the individual responsible working groups. All European
Fig. 1. A map of the five European TCCON sites, and a mobile FTS
system located at Jena (indicated by Jena*), which were calibrated with respect to WMO standards for the first time during the IMECC campaign. time [hh:mm] 13:57 14:21 52.6 52.8 53 53.2 21.48 23.17 2000 4000 6000 8000 10000 long. [°] latitude [°] altitude [m]
Fig. 2. BIK_4: a typical aircraft profile as performed during the
IMECC campaign. The participating European TCCON sites were approached typically at a flight altitude of 11 km. Close to the sites, a spiral was flown in the lower troposphere.
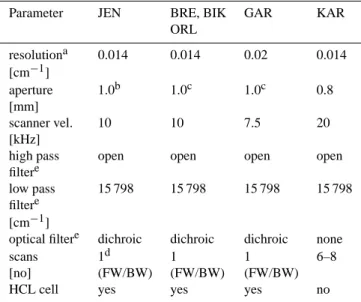
TCCON FTS instruments are Bruker 125HR spectrometers. The settings used during the campaign are listed in Table 2. In the following section, the different sites are described in detail.
2.1 Calibrated European TCCON sites
Bialystok, Poland. The FTS facility in Bialystok is operated by
the Institute of Environmental Physics (IUP), Bremen, Germany in close cooperation with AeroMeteoService, Bialystok, Poland. Bialystok represents the easternmost measurement site within the European Union. An on-site tall tower (300 m) provides boundary layer in-situ measurements. Bialystok and Orléans, France are the only sites with co-located FTS and tall tower measurements in Eu-rope. Additionally, CO2profiles up to 2.5 km altitude are measured
from small aircraft regularly. The FTS instrument was funded by the EU-projects GEOmon (Global Earth Observation and Monitor-ing) and IMECC and has been in operation since March 2009. The FTS in Bialystok is fully automated, and is controlled via remote access (Messerschmidt et al., 2010).
Table 1. Site locations and overpass times and codes. Site Lat. Long. Alt. Overpass: Code
[◦N] [◦E] [m a.s.l.] Date/Time [UTC] Bialystok, 53.23 23.03 180 30 Sep Poland 09:39 BIK_1 10:04 BIK_2 13:48 BIK_3 14:10 BIK_4 Orléans, 47.97 2.13 132 2 Oct France 06:36 ORL_1 07:02 ORL_2 10:35 ORL_3 10:57 ORL_4 Karlsruhe, 49.08 8.43 115 2 Oct Germany 09:31 KAR_1 Garmisch- 47.48 11.06 743 5 Oct Parten- 08:47 GAR_1 kirchen, Germany Jena, 50.91 11.57 211 5 Oct Germany 07:56 JEN_1 08:08 JEN_2 9 Oct 10:12 JEN_3 10:35 JEN_4 Bremen, 53.10 8.85 5 5 Oct Germany 11:29 BRE_1 9 Oct 10:52 BRE_2
Bremen, Germany. FTS measurements were started at the IUP in
Bremen in 2000, and the Bremen site has been part of the Network for the Detection of Atmospheric Composition Change (NDACC) and TCCON since 2004. While most European NDACC observa-tories are located on high mountains, the Bremen site is located on flat terrain. The low altitude location is advantageous for studying tropospheric gases. In addition, the flat surroundings at the site in Bremen makes this site well suited for the validation of satellites, e.g. (Reuter et al., 2011).
Garmisch-Partenkirchen, Germany. The Garmisch FTS site is
operated by the Institute for Meteorology and Climate Research At-mospheric Environmental Research (IMK-IFU), which is part of the Karlsruhe Institute of Technology (KIT). Measurements started in 2004 and the site has been part of TCCON since 2007. This site is located in the alpine region of Southern Germany. The FTS is op-erated coincident with the NDACC mountain-site FTS at Zugspitze (2964 m a.s.l.). The Garmisch site is about 50 km to the south of the Hohenpeissenberg site operated by the German Weather service, where in-situ CO2and CH4measurements are performed.
Jena, Germany. The FTS instrument in Jena was set up and
oper-ated by the Atmospheric Remote Sensing group at the MPI-BGC. In the long-term, the instrument is destined to be located at Ascension Island in the South Atlantic Ocean. During the time of the IMECC campaign the instrument was still being set up at Jena. After the
Table 2. Instrument settings for the FTS measurements during the
IMECC campaign. Witha: resolution =OPDmax0.9 ,b: reduced beam diameter for InGaAs via additional aperture,c: intensity attenuator at the InGaAs diode,d: due to technical difficulties only forward scans were recorded on the first overflight day,e: electronical and optical filter are used to prevent Aliasing.
Parameter JEN BRE, BIK GAR KAR ORL resolutiona 0.014 0.014 0.02 0.014 [cm−1] aperture 1.0b 1.0c 1.0c 0.8 [mm] scanner vel. 10 10 7.5 20 [kHz]
high pass open open open open filtere
low pass 15 798 15 798 15 798 15 798 filtere
[cm−1]
optical filtere dichroic dichroic dichroic none
scans 1d 1 1 6–8
[no] (FW/BW) (FW/BW) (FW/BW) HCL cell yes yes yes no
campaign the FTS system was shipped to Australia, for a compari-son campaign with the FTS at the University of Wollongong (Geibel et al., 2010).
Karlsruhe, Germany. The FTS instrument at the KIT in Karlsruhe
has been operational since September 2009, just before the IMECC campaign. It is operated by the Institute for Meteorology and Cli-mate Research – Atmospheric Trace Gases and Remote Sensing (IMK-ASF/KIT).
Orléans, France. The automated FTS facility in Orléans is
oper-ated by the IUP, Bremen, Germany in close cooperation with the LSCE, Paris, France. The measurement site not far from Orléans has the advantage of an on-site tall-tower (180 m). TCCON mea-surements started immediately after installation in August 2009. The setup was funded by the IMECC project. The FTS in Orléans is set up in the same manner as the Bialystok instrument.
2.2 Aircraft instrumentation
For continuous measurements of CO2, CH4 and H2O, the
aircraft was equipped with a Wavelength-Scanned Cavity Ring Down Spectrometer (CRDS) (model G1301-m, Picarro Inc., Sunnyvale, CA), providing mixing ratio data recorded at ∼0.5 Hz intervals. The analyzer was calibrated against WMO reference gases in the laboratory before and after the airborne campaign, providing an accuracy of 0.1 ppm for CO2and 2 ppb for CH4. Measurements were made in wet air, and dry-air mixing ratios were derived following the method of Chen et al. (2010). CO data were measured with an Aero-Laser instrument (model AL5002), which was calibrated dur-ing flight usdur-ing WMO traceable standards. The instrument
provides dry-air mixing ratios at 1 Hz frequency with an ac-curacy of 2 ppb (Gerbig et al., 1999). Additionally, up to eight flasks per profile were taken at different altitude levels, from which CO2, CH4, N2O, CO, H2and SF6were analyzed, validating the quality of the continuous measurements. The flasks were analyzed post-flight at the MPI-BGC’s gas analy-sis lab. Supplemental meteorological data (pressure, temper-ature, latitude, longitude, altitude, distance to site, and time) were also recorded.
3 Data analysis
3.1 European TCCON data
In the FTS instruments JEN, KAR, GAR and BRE the Op-tics User Software (OPUS version 6.5), a program provided by Bruker, was used to record the interferograms. In BIK and ORL, the raw interferogram data were obtained directly from the embedded web server inside the instruments. To calcu-late the spectra from the interferograms, we used the Interfer-ogram Processing Package (IPP), which was developed at the Jet Propulsion Laboratory (JPL) (Pasadena, USA) within the framework of TCCON. In the former case, OPUS-IPP (ver-sion 20100123) and in the latter case, SLICE-IPP (ver(ver-sion 20100123) was used. Both software packages perform the same Fast Fourier Transformation, the different names only indicate the different formats of the interferograms. Addi-tionally, they correct the spectra for solar intensity variations, caused e.g. by passing clouds (Keppel-Aleks et al., 2007). GFIT (version 4.4.10), a nonlinear least-squares spectral fit-ting algorithm, developed by G. Toon (JPL), was used for the retrieval of the trace gas column amounts from the measured spectra (Wunch et al., 2011). The tropospheric portion of the a priori CO2profile, used in GFIT, is based on an empirical
model fitting GLOBALVIEW CO2 data
(GLOBALVIEW-CO2, 2010). The tropopause height is determined from
the National Centers for Environmental Prediction/National Center for Atmospheric Research (NCEP/NCAR) reanalysis. The stratospheric a priori CO2decreases with altitude above the tropopause height, depending on the age of the air, based on measurements by Andrews et al. (2001). In order to elim-inate a potential bias introduced by the a priori profiles used in the standard TCCON retrieval, the assembled aircraft pro-files were used as GFIT a priori (Wunch et al., 2010). The column-averaged dry-air mole fraction (DMF) of the mea-sured gases, e.g. XCO2, can be calculated from the retrieved
column amount by
XCO2=0.2095 ·
1e6 · columnCO2
columnO2
(1) The units of XCO2are µmol mol
−1and commonly expressed
as parts per million [ppm]. Taking the ratio of the atmo-spheric CO2 and O2 columns minimizes some systematic and correlated errors present in both retrieved CO2and O2
columns (e.g. pressure errors, influence of the instrumental line shape, tracker pointing errors, Washenfelder et al., 2006; Wunch et al., 2011).
The CO2column is retrieved for two CO2bands centered at 6228 cm−1and 6348 cm−1, and the RMS-error weighted mean is used to calculate XCO2. Column O2is retrieved from the electronic band centered at 7882 cm−1. A correction to the airmass dependence, supplied with GFIT and described in Wunch et al. (2011) and Deutscher et al. (2010), was added. Data outside the ranges [0.20–0.22] for the dry air mole fraction of O2, as well as outside the range [350 ppm– 400 ppm] for CO2 are regarded as outliers in the TCCON standard retrieval and discarded. For the IMECC campaign, the variation of the FTS measurements during the time of the overpasses was used as a filter. Only individual FTS measurements were considered that had a standard deviation about the mean XCO2 less than the standard TCCON pre-cision of 0.25 %. Fewer than 10 % of the data points were removed by this filter.
3.2 On-site in-situ measurements at European TCCON
sites
At Bremen, Garmisch, and Karlsruhe no on-site in-situ mea-surements were available. At the other three sites, Bialystok, Jena, and Orléans on-site in-situ facilities are installed and used in the campaign.
Bialystok. With a height of more than 300 m, the tall tower located
at the Bialystok site is one of the tallest in Europe. A variety of at-mospheric trace gases have been sampled at five levels (4 m, 23 m, 90 m, 180 m, 300 m) quasi-continuously since 2005. CO2volume mixing ratio is measured with a LI-7000 non-dispersive infrared (NDIR) gas analyzer from LI-COR, traceable to WMO standards with an accuracy of 0.02 ppm. Further details on additional instru-ments can be found in Popa et al. (2010).
Jena. A LI-COR LI-6262 NDIR gas analyzer is mounted on the
weather station on the roof of the MPI-BGC in Jena, providing con-tinuous CO2measurements, traceable to WMO standards with an
accuracy of 0.5 ppm.
Orléans. The FTS site near Orléans is located next to the Trainou
tall tower observatory, a 180 m tall tower that provides quasi-continuous in-situ measurements of CO2and other trace gases from
three levels (50 m, 80 m, 180 m). CO2is measured with a LI-6252
NDIR gas analyzer from LI-COR.
3.3 Aircraft in-situ data
The airborne in-situ data have been merged in the MPI-BGC labs with the flask analysis data using weighting functions corresponding to the flow rate during flask sampling. The av-eraged concentrations agree within WMO recommendations for CO2, CH4 and CO with the exception of the two first profiles in Bialystok and the first profile in Orléans (WMO, 2009). The mean difference is 0.06 ppm for CO2. Above 8 km, these flights were affected by a small leak in the pump
that provided sample gas to the CRDS, causing the CO2and H2O measurements to be contaminated by cabin air. CO2 for those portions of the profiles was taken from the flask
data. CH4 measurements by CRDS showed no significant
difference during those periods. For each profile the quality-controlled and corrected data were averaged within pressure intervals of 5 hPa. The uncertainties given for the mixing ratios encompass the uncertainty due to interpolation across missing values (e.g. due to instrument calibration periods), and also include the statistical uncertainty from sampling only a limited number of seconds at each pressure interval. In addition, there is an uncertainty added which is related to the calibration of the standard gases against WMO primary gases (for CO20.1 ppm, for CH42 ppb, and for CO 2 ppb). Given the aircraft ceiling of 13 km, the aircraft measurements cov-ered roughly 80 % of the total column in terms of pressure measured from the ground.
3.4 Completing the in-situ profiles
In order to compare the FTS data with the high altitude in-situ profiles, the aircraft data have to be extended to the ground and in the stratosphere to cover the CO2 total col-umn. Therefore the airborne in-situ data are combined with on-site in-situ measurements, if provided (BIK, ORL, JEN) or extrapolated to the surface with the lowest aircraft mea-surement (BRE, KAR, GAR). To estimate the stratospheric CO2 decrease with the age of air (Sect. 3.1), the standard GFIT a priori CO2 profiles are used for the extension in the stratosphere. The tropopause height is determined from the NCEP reanalysis, supplied in the TCCON standard re-trieval. For aircraft profiles that were measured higher than the tropopause, the standard GFIT a priori CO2 profile was attached to the highest aircraft measurement. For aircraft profiles that were not measured up to the tropopause pres-sure, the aircraft profile was extended with the most con-temporary GFIT a priori profile. At the Karlsruhe site, only one overpass was carried out, and the upper troposphere was filled in with the highest aircraft measurement. All assem-bled in-situ profiles are shown for each site in Figs. A1–A4. The aircraft measurements are given in red. The GFIT a pri-ori profiles fitted in CO2 to the aircraft measurements are shown in blue. Extended parts for missing measurements in the upper troposphere are indicated as black and used contemporary GFIT a priori profiles in green. The NCEP tropopause height is indicated by a thin red line. The origi-nal GFIT a priori profiles are shown with a thin dotted black line. The resulting uncertainties are discussed in Sect. 3.6.
3.5 Integration of the assembled in-situ profiles
The completed in-situ profiles over the European TCCON sites can be compared with the FTS DMF, when integrated to
compute column-averaged CO2DMF. Rodgers and Connor
which one has much higher vertical resolution than the other. This approach has been modified by the Wunch et al. (2010) retrieval set up, and is duplicated here.
The averaging kernels are needed for comparison between two instruments. The averaging kernel matrix represents the changes in a retrieved profile at one level i due to a per-turbation to the true profile at another level j . Since GFIT does a profile scaling retrieval (PSR), the averaging ker-nel matrix reduces to a vector representing the sensitivity of the retrieved total column to perturbations of the partial columns at the various atmospheric levels. In GFIT the av-eraging kernels are calculated with the scaled profiles, there-fore the FTS retrieval scaling factor, γ , has to be taken into account (Wunch et al., 2010):
b
cs=γ ca+aT(xh−γ xa) (2) withcbs: smoothed DMF of the aircraft, γ : FTS retrieval scal-ing factor, ca: FTS a priori DMF, aT: FTS column averaging kernel, xh: aircraft profile, xa: FTS a priori profile
The derivation of the equation of the column-averaged
air-craft CO2 DMF can be found in Wunch et al. (2010) and
yields: b cs=γ VCa prioriCO 2 VCair + VCaircraftCO 2,ak−γVC a priori CO2,ak V Cair (3)
with γ : FTS retrieval scaling factor, VCair: total column of dry-air, VCa prioriCO
2 : total vertical column of CO2, VC
aircraft
CO2,ak:
column averaging kernel-weighted vertical column of the air-craft, V CCOa priori
2,ak: column averaging kernel-weighted vertical
a priori.
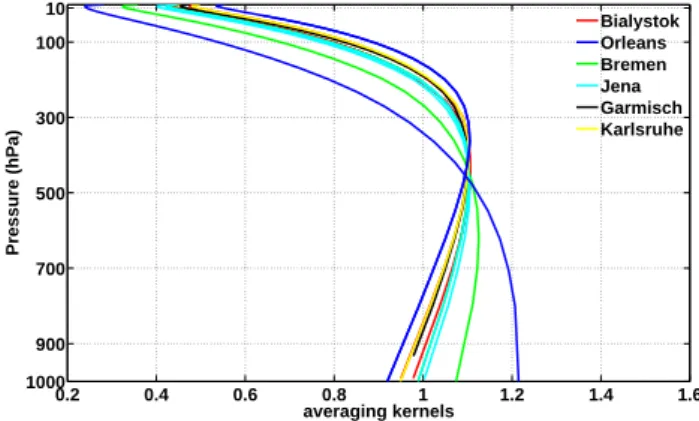
Variability in the averaging kernels is primarily driven by changing solar zenith angles. Therefore the averaging kernel from the FTS measurement nearest in time to the central time of the overpass was used for the smoothing. This averaging kernel is the mean over both CO2 retrieval windows. The column averaging kernel vectors used for the integration of the 16 in-situ profiles during the IMECC campaign are shown in Fig. 3.
3.6 Uncertainty discussion
Measurements are affected by three types of error sources: random effects, known and unknown systematic effects. Random effects result in a measurement to measurement variability and can be quantified by the standard deviation. Known systematic effects should not simply be encompassed by increasing the estimated uncertainty, according to the Joint Committee for Guides in Metrology (JCGM, 2008) rec-ommendations. They rather should be corrected and the un-certainty in the correction included in the total unun-certainty of the corrected quantity. The total uncertainty is calculated as the sum in quadrature of random effects and the uncer-tainty of the corrected known systematic effects. Unknown
0.2 0.4 0.6 0.8 1 1.2 1.4 1.6 10 100 300 500 700 900 1000 averaging kernels Pressure (hPa) Bialystok Orleans Bremen Jena Garmisch Karlsruhe
Fig. 3. All column averaging kernels for CO2used for the
inte-gration during the IMECC campaign. The colors indicate the as-sociated site at which the FTS measurements were taken. Due to different solar zenith angles (SZAs), the averaging kernels vary for the various sites and overpass times. The SZAs are given in Table 5.
systematic effects reveal in comparison to independent mea-surements and can be corrected against a calibration stan-dard, such as the WMO standards, the objective of this paper.
3.6.1 Uncertainty of FTS-derived DMFs
FTS measurements are known to be mainly affected by the following systematic effects. Firstly the a priori profiles can be wrong due to false estimations of the temperature, pres-sure or water vapour profiles. Furthermore the volume mix-ing ratio shape of the a priori profiles can be wrong. Secondly the sun tracker pointing at the middle of the sun can be offset. Thirdly the instrumental line shape (ILS) can be distorted due to shear or angular misalignment of the instrument or field of view (FOV) failure (Wunch et al., 2011). The calculation of XCO2 by Eq. (1) reduces some of the effects that are
com-mon to both gases (solar tracking pointing errors, zero level offsets, ILS errors or surface pressure measurement errors).
Furthermore it is known that the XCO2 exhibit an
airmass-dependency, resulting in 1 % larger XCO2 at low solar zenith
angeles (SZA) than at high SZA. This dependency is re-moved in the standard GFIT retrieval by a single empirical correction (Sect. 3.1). A quantification of realistic perturba-tions of the a priori profile, the tracking and the ILS was done by Wunch et al. (2011). It could be estimated that the XCO2 in total would be affected by 0.18 % for low SZA (20◦) and 0.13 % for high SZA (70◦) .
Within the IMECC campaign, potential systematic effects introduced by the a priori profiles were eliminated by using the assembled aircraft profiles as a priori profiles (Sect. 3.1). Concerning the quality of the solar tracking, a suitable indi-cator is the pointing error, which is the deviation from point-ing at the middle of the sun and can be estimated by the Doppler Shift. The ILS is regularly monitored in all TCCON FTS instruments (Sect. 3.1) and misalignments could further
be seen in the fitting residuals by characteristic artifacts. All FTS instruments and their solar tracker were optimized prior the IMECC campaign, and hence systematic effects by the pointing error and the ILS were minimized.
One known source, systematically affecting FTS measure-ments, was not diminished prior the campaign or is taken care of in the retrieval. Messerschmidt et al. (2010) showed that collocated FTS instruments agree within 0.07 %, but only after correcting for a systematic effect introduced by a mis-sampling of the internal reference laser provided in the commercially available FTSs. Briefly, a periodic laser mis-sampling leads to so called ghosts (artificial spectral lines), which are mirror images of the original spectral lines. The influence of the ghosts on the retrieved XCO2 was quantified as a function of the ghost and parent line intensities, called the ghost/parent line ratio (GPR). For a typical GPR, the re-trieved XCO2is affected by about 1 ppm. Therefore, a
correc-tion scheme was introduced for solar measurements afflicted with ghosts (Messerschmidt et al., 2010). The effect of the retrieved XCO2 was quantified and this correction applied to
all measurements during the IMECC campaign.
The Messerschmidt et al. (2010) correction scheme does not predict the sign of the ghosts, which means that it is am-biguous as to whether the ghosts lead to an over- or an un-derestimation of the retrieved XCO2. For three of the FTS
in-struments (BIK, BRE, ORL), this sign was inferred from the side-by-side measurements detailed by Messerschmidt et al. (2010). For the Garmisch and Karlsruhe FTS instruments, the ghosts were minimized prior to the aircraft campaign and did not introduce a large systematic effect. The Jena instru-ment could not be corrected prior to the aircraft campaign, and had significant ghosts, which affected the retrievals. The results suggest an over-estimation of XCO2. However, as we
cannot be sure of the sign, we investigate two “worst-case” scenarios in calculating the scaling factors for the FTS rel-ative to the in-situ profile in Sect. 4. These correspond to all ghosts (Table 3) leading to an (a) under- and (b) over-estimation of the retrieved XCO2. The difference between
these scenarios is used to check the correction of the system-atic effect introduced by the ghost correction scheme in the calculation of scaling factors.
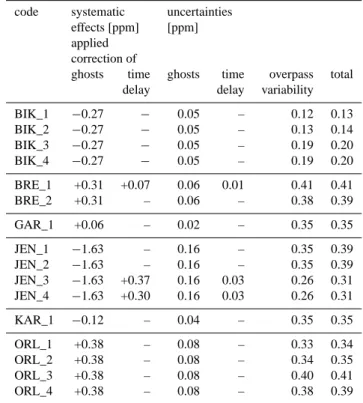
One further source lead to systematic effects: due to poor weather in Jena and Bremen, not all overpasses could be car-ried out at the same time as the FTS data were measured (BRE_1, JEN_3, JEN_4). To account for a delay of two hours in all three cases, the expected variation due to the di-urnal CO2cycle was accounted for as a systematic effect. At both sites, the magnitude of the diurnal cycle was estimated from the trend of the FTS measurements on the same day. The diurnal cycle was calculated for BRE_1 by the trend of the FTS data taken for a 2 h time period prior to the over-pass and for JEN_3 and JEN_4 by the trend of the FTS data measured for a 2.5 h time period after the overpass. The trends were estimated with the FTS data that met the filter criteria introduced in Sect. 3.1 and extrapolated to the
over-Table 3. Systematic effects due to ghosts and a time delay between
the overpass and FTS measurements and the uncertainty sources contributing to the total uncertainty of the FTS measurements. The total uncertainty accounts for the FTS measurements variability dur-ing the overpasses, an uncertainty in the estimation of the expected variation due to the diurnal cycle and the uncertainty in the ghost estimation, according to Messerschmidt et al. (2010).
code systematic uncertainties effects [ppm] [ppm] applied
correction of
ghosts time ghosts time overpass total delay delay variability BIK_1 −0.27 − 0.05 – 0.12 0.13 BIK_2 −0.27 − 0.05 – 0.13 0.14 BIK_3 −0.27 − 0.05 – 0.19 0.20 BIK_4 −0.27 − 0.05 – 0.19 0.20 BRE_1 +0.31 +0.07 0.06 0.01 0.41 0.41 BRE_2 +0.31 – 0.06 – 0.38 0.39 GAR_1 +0.06 – 0.02 – 0.35 0.35 JEN_1 −1.63 – 0.16 – 0.35 0.39 JEN_2 −1.63 – 0.16 – 0.35 0.39 JEN_3 −1.63 +0.37 0.16 0.03 0.26 0.31 JEN_4 −1.63 +0.30 0.16 0.03 0.26 0.31 KAR_1 −0.12 – 0.04 – 0.35 0.35 ORL_1 +0.38 – 0.08 – 0.33 0.34 ORL_2 +0.38 – 0.08 – 0.34 0.35 ORL_3 +0.38 – 0.08 – 0.40 0.41 ORL_4 +0.38 – 0.08 – 0.38 0.39
pass time. On-site in-situ measurements showed for the ex-trapolated time period in Jena a variability of ±0.5 ppm and no significant trend that indicate further influence e.g. from local pollution or changing meteorological conditions. For Bremen no on-site in-situ measurements exist. The BRE_1, JEN_3, JEN_4 data are not included in the calculation of the calibration factor, due to the remaining lack of information during the overpasses, but the results will be discussed in Sect. 4.2.
Random effects, such as noise and variations in the so-lar tracker and instrument performance, are quantified by the measurement to measurement variability during the over-passes.
The total uncertainty for the FTS data is the sum in quadra-ture of the contributing standard uncertainties: the standard deviation about the mean during the overpass, the standard uncertainty of the ghost estimation and the standard uncer-tainty of the diurnal cycle estimation. Table 3 summarizes the magnitude of the systematic corrections, the uncertain-ties and the total uncertainty for all overpasses.
3.6.2 Uncertainty of the assembled in-situ data
The uncertainty of the assembled in-situ data is derived from the uncertainty of the aircraft measurements, the uncertain-ties in extrapolating the profiles and the usage of contempo-rary profiles (Table 4).
The GFIT a priori CO2profiles are used to extend the in-situ data above the tropopause, as explained in Sect. 3.4. Thus a typical profile of mean age (Andrews et al., 2001) above the local tropopause is used to calculate the lag of stratospheric CO2 values with respect to mean tropospheric values. Furthermore a decrease of the seasonal cycle with altitude is taken into account. Seasonally resolved aircraft measurements during the SPURT project (Engel et al., 2006) revealed that the seasonal cycle in the lowermost strato-sphere (i.e. the region of the stratostrato-sphere between the local tropopause and the 380 K isentrope) is not only attenuated with increasing vertical distance to the local tropopause but is also shifted with respect to the troposphere (Hoor et al., 2004; Bönisch et al., 2008, 2009; Hintsa et al., 1998). The seasonal cycle magnitude can be as large as 3 ppm at the mid latitude tropopause and decreases to about half of that value at about 50 K potential temperature above the local tropopause. The amplitude and timing of the seasonal cycle at the tropopause is captured quite well in the a priori profiles with a maxi-mum in May. The variability in this area is, however, very high, especially when using pressure coordinates. Therefore a conservative uncertainty estimate is used by assuming that the CO2seasonal cycle in the lowermost stratosphere can not be correctly represented and that this seasonal cycle leads to an additional uncertainty of the CO2a priori profile of about 2 ppm, that is a typical amplitude of the seasonal cycle in the lowermost stratosphere. This uncertainty is independent of contributions from the absolute uncertainty of the mean age profile, that is estimated to be about 0.3 ppm (Wunch et al., 2010). The total uncertainty of the stratospheric CO2values is thus estimated as the sum in quadrature and on the order of 2.02 ppm.
For some overpasses, the profiles could not be measured up to the tropopause. If no contemporary aircraft profile was available, the upper troposphere was filled with the highest aircraft measurement; e.g. as clearly seen in Fig. A2. The CO2variability in the upper troposphere, measured at the Eu-ropean TCCON sites, is within 2 ppm and applied as uncer-tainty for the filling. If a contemporary aircraft profile was available, it was used to estimate the profile above the last aircraft measurement (Figs. A1, A3, A4). It is assumed that the profile can therewith be better estimated than by using the highest aircraft measurement and an uncertainty of 1.5 ppm is assigned.
For the aircraft data, the standard uncertainty provided by the post-flight analysis at the MPI-BGC’s lab was applied. The uncertainties given for the mixing ratios contain uncer-tainties from extension with the lowest aircraft measurement to the surface pressure, as well as from interpolation across
Table 4. Contributing uncertainties to the total uncertainty of the
assembled in-situ data. The total uncertainty is calculated by the sum in quadrature of the weighted fraction in terms of pressure with respect to the completed in-situ profile.
Uncertainties contributing to the total uncertainty [ppm] stratospheric extrapolation 2.02 missing tropospheric values 2.00 usage of contemporary profile 1.50 mean aircraft profile 0.11
missing values (e.g. due to instrument calibration periods). Also included is the statistical uncertainty from sampling only a limited number of seconds at each pressure interval. In addition, an uncertainty related to the calibration of the standard gases (working tanks) against WMO primary gases is added. The mean standard deviation for the IMECC cam-paign aircraft profiles is 0.11 ppm. The total uncertainty is calculated from the sum in quadrature of these contributing uncertainties weighted by their relative contribution to the completed profile in terms of pressure.
Due to poor weather conditions a profile was not flown above the Karlsruhe TCCON site. Aircraft measurements were, however, recorded during a stop-over 50 km to the south of the site. The Karlsruhe data are therefore treated similarly to the other overflights, but because of these excep-tional circumstances, they are not included in the calculation of the calibration factor. They will be discussed in Sect. 4.2. The resulting uncertainties for the FTS measurements and for the integrated column-averaged assembled aircraft CO2 profiles are listed for all overpasses in Table 5.
4 Comparison of the European TCCON CO2
measurements with in-situ data
4.1 Comparison to previous TCCON calibrations
The IMECC results can be compared with previous TCCON calibrations, published in Wunch et al. (2010), by predicting a linear relationship and no intercept. The results are plot-ted in addition to the previous TCCON calibrations presenplot-ted in Wunch et al. (2010) in Fig. 4. The IMECC data are shown in red and the previous TCCON calibrations in green. The best fit to the IMECC data is calculated by considering both errors on the x- and y-axis (York et al., 2004) and is indi-cated with a red line. The previous TCCON calibrations are shown with a green line. The thin blue lines show the best fits under the worst-case ghost scenarios. The resulting scale factors are reported as the slope of the best fit ± two standard deviations. The scale factor, the best fit uncertainty and the scale factor uncertainty are listed in comparison to the previ-ous TCCON calibrations in Table 6. The worst-case ghost
Table 5. The IMECC campaign results: the code of each overpass, the type, the solar zenith angle (SZA), the aircraft ceiling/-floor, spiral
range, nearest distance, number of FTS measurements during the overpass, and the column-integrated CO2abundances measured by in-situ
instrumentations and FTS are given.
code type SZA [◦] aircraft aircraft spiral [km] nearest number of FTS aircraft (min-max) ceiling [km] floor [m] (ceiling,width) distance [km] FTS data [ppm] [ppm] BIK_1 descent 56.2–61.1 11.5 500 (5,10) 0 65 378.3 ± 0.1 382.6 ± 0.1 BIK_2 ascent 56.2–61.1 8 500 (3,5) 0 67 378.3 ± 0.1 382.5 ± 0.2 BIK_3 descent 66.8–72.4 8 800 (5,8) 0 35 378.1 ± 0.2 382.5 ± 0.2 BIK_4 ascent 66.8–72.4 10.5 800 (5,10) 0 35 378.1 ± 0.2 382.5 ± 0.1 BRE_1 descent 58.0–75.5 13 500 (6,10) 0 30 379.1 ± 0.4 383.7 ± 0.1 BRE_2 descent 59.5–62.8 13 500 (10,10) 0 37 378.7 ± 0.4 383.5 ± 0.1 GAR_1 descent 53.9–62.3 12.5 1500 (7,15) 5 19 379.6 ± 0.4 384.1 ± 0.1 JEN_1 descent 59.0–63.8 12.5 800 (7,10) 0 8 379.7 ± 0.4 383.7 ± 0.1 JEN_2 ascent 59.0–63.8 8 800 – 0 8 379.7 ± 0.4 383.8 ± 0.2 JEN_3 descent 59.9–61.7 12.5 500 (9,15) 0 7 380.0 ± 0.3 384.1 ± 0.1 JEN_4 ascent 59.9–61.7 12.5 500 – 0 7 380.0 ± 0.3 384.1 ± 0.1 KAR_1 54.2–64.3 7 200 – 10 26 380.8 ± 0.4 384.6 ± 0.2 ORL_1 descent 68.90–83.6 11.5 700 (9,15) 30 45 380.1 ± 0.3 384.2 ± 0.1 ORL_2 ascent 68.9–083.6 7 700 (3,5) 0 45 380.0 ± 0.4 384.2 ± 0.2 ORL_3 descent 51.80–52.5 11 700 (8,30) 12 10 380.3 ± 0.4 384.1 ± 0.1 ORL_4 ascent 51.8–052.5 8 700 (5,5) 0 10 380.3 ± 0.4 384.2 ± 0.2 365 370 375 380 385 390 360 365 370 375 380 385 smoothed aircraft CO2 (ppm) FTS X CO 2 (ppm) Wunsch et al., 2010b: y = (0.989±0.002)x IMECC campaign: y = (0.989±0.002)x y=x
worst ghost case scenarios
Fig. 4. The IMECC campaign in comparison with previous TCCON
calibrations, published in Wunch et al. (2010). The scaling factors agree within their uncertainties. This suggests one global scaling factor can be used for CO2for all TCCON sites worldwide. With
the thin blue lines the best fit to the worst ghost case scenarios are indicated.
scenarios yield scale factors that lie within the uncertainty of the IMECC calibration scale factor, which implies a correct elimination of the systematic effect by the ghost correction scheme. The larger difference for the upper bound (maxi-mum overestimation) is mostly due to the large ghosts found in the Jena instrument (XCO2+ 1.63 ppm).
The IMECC calibration scale factor calculated here to be 0.989 ± 0.002 (2-σ ) agrees with the Wunch et al. (2010) cal-ibration (0.989 ± 0.002 (2-σ )) . The IMECC calcal-ibration
sup-Table 6. A linear relationship and a zero intercept are predicted.
The scale factors are calculated by considering solely the IMECC campaign, by adding the IMECC campaign to the previous TCCON calibrations and in two worst ghosts scenarios (ghost_O: all ghosts lead to CO2overestimation, ghost_U: all ghosts lead to CO2
un-derestimation). For comparison the scaling factor for the previous TCCON calibrations is listed as given in Wunch et al. (2010).
data scale uncertainty
factor best fit (1-σ ) scale factor (2-σ ) IMECC calibration 0.989 0.001 0.002 IMECC (ghost_O) 0.991 0.001 0.002 IMECC (ghost_U) 0.988 0.001 0.002 IMECC and previous 0.989 0.001 0.002 TCCON calibrations
previous TCCON 0.989 0.001 0.002 calibrations
ports the assumption of one global scale factor for CO2for all TCCON sites worldwide (Wunch et al., 2010), which can be applied independent of site and season. However, the pre-vious TCCON calibrations did not include a correction of potential ghosts in the FTS spectra.
4.2 Calibration of the TCCON standard XCO2 product
FTS data collected during the IMECC campaign were also fitted using the standard GFIT a priori profiles in order to
Table 7. Results of the two retrieval approaches are listed. The
dif-ferences are calculated by FTS retrieval (TCCON standard a priori) minus FTS retrieval (aircraft a priori).
mean result mean result difference (standard a priori) (aircraft a priori) (1.col.–2.col.) FTS XCO2 379.5 379.4 0.0 ± 0.1 in-situ CO2 383.7 383.7 0.0 ± 0.1 381.5 382 382.5 383 383.5 384 384.5 377.5 378 378.5 379 379.5 380 380.5 381 smoothed aircraft CO 2 (ppm) FTS X CO 2 (ppm)
use of aircraft profiles as prior: y = 0.989(±0.002)x use of standard GFIT priors: y = 0.989(±0.002)x BIK_1−BIK_4 BRE_2 BRE_1 GAR_1 JEN_1−JEN_2 JEN_3−JEN_4 KAR_1 ORL_1−ORL_4
Fig. 5. The IMECC data were analyzed with the TCCON standard
a priori profiles. The unconsidered KAR_1, BRE_1, JEN_3, and JEN_4 data are shown in the site corresponding color with red cir-cles. The corresponding retrievals, with the aircraft profiles as a priori, are given as circles in the same color. The resulting scale factor is consistent (within the uncertainty) with the scale factors calculated using of the aircraft profiles as a priori (Sect. 4.1).
analyze the spectra in a way consistent with the standard TC-CON retrieval. This approach allows estimation of the qual-ity of TCCON CO2data products obtained using the standard GFIT a priori profiles. The mean of all results for the FTS data and the integrated in-situ profiles are listed in compar-ison with the former retrieval approach in Table 7. The dif-ferences in the XCO2 are calculated as the FTS retrieval with
TCCON standard a priori minus the FTS retrieval with the aircraft a priori. The estimation of the scale factor was per-formed following Sect. 4.1. A linear relationship and a zero intercept was predicted, the best fit was estimated with the York et al. (2004) fitting method, and the KAR_1, BRE_1, JEN_3, and JEN_4 data are excluded in the fitting procedure. The IMECC data, retrieved with the standard GFIT a priori, are shown in Fig. 5 as filled circles (Bialystok: red, Bremen: purple, Garmisch: cyan, Jena: green, Karlsruhe: yellow, Or-léans: blue). The unconsidered KAR_1, BRE_1, JEN_3, and JEN_4 data are shown in the site corresponding color with red circles. The corresponding retrievals, with the aircraft profiles as a priori, are given as circles in the same color. The scale factor is consistent with the results of Sect. 4.1. All scale factors are listed in Table 8.
The KAR_1, BRE_1, JEN_3, and JEN_4 data were ex-cluded because of missing information about the exact
atmo-Table 8. The scale factor calculated with (a) the use of the TCCON
standard a priori, (b) the use of the TCCON standard a priori and including BRE_1, JEN_3 and JEN_4 data, and (c) IMECC calibra-tion as described in Sect. 4.1. All estimacalibra-tions are consistent within their uncertainties.
data scale uncertainty factor best fit (σ ) scale factor (2σ ) TCCON standard retrieval 0.989 0.001 0.002 TCCON standard retrieval 0.989 0.001 0.002 (KAR_1,BRE_1,JEN_3-4)
IMECC calibration 0.989 0.001 0.002
spheric profile during the FTS measurements. In the case of KAR_1 data, the recorded aircraft profile was displaced, and in the case of the BRE_1, JEN_3, and JEN_4 data the aircraft profiles were not contemporary with the FTS measurements. The latter profiles were corrected for a systematic effect of a diurnal cycle of the order of the FTS measurement precision magnitude (Table 3). The scale factor, calculated including the KAR_1, BRE_1, JEN_3, and JEN_4 data, yields within their uncertainty the same scale factor as without the data. The Karlsruhe data, however, exhibit an overestimation with respect to the best fit, that can not be investigated due to the lack of information. Model simulations could help to assess potential influence from pollution by nearby emissions at the Karlsruhe site.
GFIT retrievals use an a priori profile that is based on dry-air mole fractions. In reality, the FTS observes a profile shape with respect to pressure that is described by the wet-air mole fractions. We investigated the effect of this assump-tion by comparing retrievals with the aircraft dry-air profile as a priori with retrievals made by creating an a priori wet-air profile by using the co-measured H2O profile. The FTS-retrieved XCO2 values on average differ by 0.1 µmol mol
−1,
with the wet-air profile yielding higher columns. However, the application of the averaging kernel and a priori dependent smoothing to the in-situ profile means that these are simi-larly affected, and individual ratios of aircraft/FTS XCO2 do
not change. The FTS retrieval is therefore insensitive to the a priori profile shape in comparison studies with other mea-surements (or models). This confirms that the a priori profiles used in GFIT do not add any systematic biases to the results of comparisons between FTS XCO2and other measurements.
5 Summary and outlook
The IMECC campaign results a negative bias of
1.1 % ± 0.2 % (2-σ ) of the FTS XCO2 measurements
with respect to WMO standards. The negative bias is likely due to spectroscopic inaccuracies, as the aircraft profiles were used as a priori profiles. The results from the IMECC campaign are in very good agreement with previous TCCON calibrations and the findings confirm the TCCON calibration
published in Wunch et al. (2010) for five new European TCCON sites.
The IMECC campaign spectra were also analyzed with the standard GFIT CO2a priori. The standard GFIT CO2a priori does not add a bias and the results agree with the results ob-tained with the aircraft profiles as a priori. The findings show that the TCCON standard XCO2product can be measured by
instruments using the standard GFIT a priori profiles with a bias of 1.1 % ± 0.2 % with respect to WMO standards and a precision of 0.25 % (1-σ ). With calibrated, high precision FTS measurements, TCCON provides an ideal resource for the calibration and validation of satellite measurements as it measures the same quantity as satellites but with a higher
precision and accuracy. The European TCCON standard
XCO2 product accuracy could be estimated to be 0.8 ppm
(400 ppm · 0.2 %).
The uncertainty could firstly be improved by minimizing potential ghosts prior to a calibration campaign and a reli-able ghost sign determination in the analysis. Secondly the uncertainty in the in-situ profile is dominated by the sections of the atmosphere not measured by the aircraft. With a jet aircraft flying at maximum flight altitude, roughly 80 % of the total column in terms of pressure can be sampled. The very accurate in-situ measurements have to be extrapolated in the stratosphere; this contributes to a large part of the un-certainty. This should be improved by extending the in-situ measurements to higher altitudes, for example with balloon or AirCore measurements (Karion et al., 2010) for a further accurate constraint of the calibration factor.
Appendix A 100 300 500 700 900 BIK_1 Pressure (hPa) BIK_2 375 380 385 390 395 100 300 500 700 900 BIK_3 CO 2 (ppm) Pressure (hPa) 375 380 385 390 395 BIK_4 CO 2 (ppm)
Fig. A1. The four assembled aircraft profiles taken in Bialystok. In
BIK_2 and BIK_3 the aircraft had a flight height of 8 km, and the upper parts were replaced with the measurements of the contempo-rary overpasses BIK_1 and BIK_4. The aircraft measurements are given in red. The GFIT a priori profile fitted in CO2to the aircraft
measurements are shown in blue. Extended parts for missing mea-surements in the upper troposphere are indicated as black and used contemporary profiles in green. The NCEP tropopause height is in-dicated by a thin red line. The original GFIT a priori profiles are shown with a thin dotted black line.
100 300 500 700 900 BRE_1 Pressure (hPa) BRE_2 375 380 385 390 395 100 300 500 700 900 GAR_1 CO 2 (ppm) Pressure (hPa) 375 380 385 390 395 KAR_1 CO 2 (ppm)
Fig. A2. In Bremen (BRE_1, BRE_2) and in Garmisch (GAR_1),
the aircraft ceiling reached the tropospause and the profiles could be completed by solely using the GFIT standard a priori. Due to bad weather conditions no aircraft profile was taken over the FTS site Karlsruhe. The presented in-situ data were collected while a stop-over 50 km south of the site. The Karlsruhe result was not considered in the IMECC calibration, but afterwards compared to the findings. Used color are explained in Fig. A1.
100 300 500 700 900 JEN_1 Pressure (hPa) JEN_2 375 380 385 390 395 100 300 500 700 900 JEN_3 CO 2 (ppm) Pressure (hPa) 375 380 385 390 395 JEN_4 CO 2 (ppm)
Fig. A3. Three out of four overpasses above the mobile FTS system
in Jena reached the tropopause. The JEN_2 profile was extended by replacing the upper part with the aircraft profile of JEN_1. The color indication is the same as in Fig. A1.
100 300 500 700 900 ORL_1 Pressure (hPa) ORL_2 375 380 385 390 395 100 300 500 700 900 ORL_3 CO 2 (ppm) Pressure (hPa) 375 380 385 390 395 ORL_4 CO 2 (ppm)
Fig. A4. Two out of four aircraft profiles could be measured up to
the tropopause at the European TCCONsite in Orléans. The upper troposheric portions in ORL_2 and ORL_4 are substituted by the measurements of ORL_1 and ORL_3. All aircraft profiles were taken at one day, two at low solar angle and two at higher solar angle around noon. Color description is given in Fig. A1.
Supplementary material related to this article is available online at:
http://www.atmos-chem-phys.net/11/10765/2011/ acp-11-10765-2011-supplement.pdf.
Acknowledgements. We acknowledge the support of the European
Commission within the 6th Framework Program through the Inte-grated Infrastructure Initiative IMECC (Infrastructure for Measure-ment of the European Carbon Cycle) and the Integrated Project GE-Omon (Global Earth Observation and Monitoring).
The aircraft measurements would not have been possible without the great support from Enviscope GmbH (Frankfurt am Main, Ger-many), especially Rolf Maser and Christoph Klaus, who were re-sponsible for the aircraft instrument integration and operation. We would also like to thank the Gesellschaft für Flugzieldarstellung mbH (Hohn, Germany), especially Svend Engemann and the other pilots, for their excellent support with flight planning and flight op-erations. We thank the Polish Air Navigation Services Agency for the organization of the overpass in Bialystok, Poland.
At the Institute of Environmental Physics (Bremen, Germany) Katinka Petersen, Christof Petri, Benjamin Sampson and Christine Weinzierl have contributed greatly to the success of the campaign. From the Max Planck Institute for Biogeochemistry (Jena, Ger-many) we would like to thank Stephan Baum, Armin Jordan, Mar-tin Hertel, Karl Kübler, and Bert Steinberg for their contributions. We thank the members of RAMCES team at LSCE (Gif-sur-Yvette, France) for maintaining the Orléans FTS site and providing station logistics. We would also like to thank Peter Rayner at the University of Melbourne, Australia for the coordination of the project IMECC and helpful comments on the article.
Implementation of TCCON data processing is supported by a grant from NASA’s Carbon Cycle Program (NNX08AI86G) to the California Institute of Technology. Part of this work was performed at the Jet Propulsion Laboratory, California Institute of Technology, under contract with NASA.
Edited by: J. Brandt
References
Andrews, A. E., Boering, K. A., Daube, B. C., Wofsy, S. C., Loewenstein, M., Jost, H., Podolske, J. R., Webster, C. R., Her-man, R. L., Scott, D. C., Flesch, G. J., Moyer, E. J., Elkins, J. W., Dutton, G. S., Hurst, D. F., Moore, F. L., Ray, E. A., Romashkin, P. A., and Strahan, S. E.: Mean ages of stratospheric air derived from in situ observations of CO2, CH4, and N2O, J. Geophys.
Res., 106, 32295–32314, 2001.
Baker, D. F., Law, R. M., Gurney, K. R., Rayner, P., Peylin, P., Denning, A. S., Bousquet, P., Bruhwiler, L., Chen, Y.-H., Ciais, P., Fung, I. Y., Heimann, M., John, J., Maki, T., Maksyu-tov, S., Masarie, K., Prather, M., Pak, B., Taguchi, S., and Zhu, Z.: TransCom 3 inversion intercomparison: Impact of transport model errors on the interannual variability of regional CO2fluxes, 1988–2003, Global Biogeochem. Cy., 20, GB1002,
doi:10.1029/2004GB002439, 2006.
Bönisch, H., Hoor, P., Gurk Ch., F. W., M., C., Engel, A., and Bregman, B.: Model evaluation of CO2 and SF6 in the
extratropical UT/LS region, J. Geophys. Res., 113, D06101, doi:10.1029/2007JD008829, 2008.
Bönisch, H., Engel, A., Curtius, J., Birner, Th., and Hoor, P.: Quan-tifying transport into the lowermost stratosphere using simultane-ous in-situ measurements of SF6and CO2, Atmos. Chem. Phys.,
9, 5905–5919, doi:10.5194/acp-9-5905-2009, 2009.
Chen, H., Winderlich, J., Gerbig, C., Hoefer, A., Rella, C. W., Crosson, E. R., Van Pelt, A. D., Steinbach, J., Kolle, O., Beck, V., Daube, B. C., Gottlieb, E. W., Chow, V. Y., Santoni, G. W., and Wofsy, S. C.: High-accuracy continuous airborne measurements of greenhouse gases (CO2and CH4) using the cavity ring-down
spectroscopy (CRDS) technique, Atmos. Meas. Tech., 3, 375– 386, doi:10.5194/amt-3-375-2010, 2010.
Deutscher, N. M., Griffith, D. W. T., Bryant, G. W., Wennberg, P. O., Toon, G. C., Washenfelder, R. A., Keppel-Aleks, G., Wunch, D., Yavin, Y., Allen, N. T., Blavier, J.-F., Jiménez, R., Daube, B. C., Bright, A. V., Matross, D. M., Wofsy, S. C., and Park, S.: Total column CO2measurements at Darwin, Australia – site
de-scription and calibration against in situ aircraft profiles, Atmos. Meas. Tech., 3, 947–958, doi:10.5194/amt-3-947-2010, 2010. Engel, A., Bönisch, H., Brunner, D., Fischer, H., Franke, H.,
Gün-ther, G., Gurk, C., Hegglin, M., Hoor, P., Königstedt, R., Krebs-bach, M., Maser, R., Parchatka, U., Peter, T., Schell, D., Schiller, C., Schmidt, U., Spelten, N., Szabo, T., Weers, U., Wernli, H., Wetter, T., and Wirth, V.: Highly resolved observations of trace gases in the lowermost stratosphere and upper troposphere from the Spurt project: an overview, Atmos. Chem. Phys., 6, 283–301, doi:10.5194/acp-6-283-2006, 2006.
Geibel, M. C., Gerbig, C., and Feist, D. G.: A new fully automated FTIR system for total column measurements of greenhouse gases, Atmos. Meas. Tech., 3, 1363–1375, doi:10.5194/amt-3-1363-2010, 2010.
Gerbig, C., Schmitgen, S., Kley, D., Volz-Thomas, A., Dewey, K., and Haaks, D.: An improved fast-response vacuum-UV reso-nance fluorescence CO instrument, J. Geophys. Res., 104, 1699– 1704, 1999.
GLOBALVIEW-CO2: Cooperative Atmospheric Data Integration Project – Carbon Dioxide,NOAA-ESRL, Boulder, Colorado, cD-ROM, 2010.
Hintsa, E. J., Boering, K. A., Weinstock, E. M., Anderson, J. G., Gary, B. L., Pfister, L., Daube, B. C., Wofsy, S. C., Loewenstein, M., Podolske, J. R., Margitan, J. J., and Bui, T. P.: Troposphere-stratosphere transport in the lowermost Troposphere-stratosphere from mea-surements of H2O, CO2, N2O and O3, Geophys. Res. Lett., 25, 2655–2658, 1998.
Hoor, P., Gurk, C., Brunner, D., Hegglin, M. I., Wernli, H., and Fischer, H.: Seasonality and extent of extratropical TST derived from in-situ CO measurements during SPURT, Atmos. Chem. Phys., 4, 1427–1442, doi:10.5194/acp-4-1427-2004, 2004. JCGM: Evaluation of measurement data - Guide to the expression
of uncertainty in measurement, Tech. rep., Joint Committee for Guides in Metrology, Working Group 1, 2008.
Karion, A., Sweeney, C., Tans, P., and Newberger, T.: AirCore: An Innovative Atmospheric Sampling System, J. Atmos. Ocean. Tech., 27, 1839–1853, doi:10.1175/2010JTECHA1448.1, 2010. Keppel-Aleks, G., Toon, G. C., Wennberg, P. O., and Deutscher,
N. M.: Reducing the impact of source brightness fluctuations on spectra obtained by Fourier-transform spectrometry, Appl. Op-tics, 46, 4774–4779, 2007.
Keppel-Aleks, G., Wennberg, P. O., and Schneider, T.: Sources of variations in total column carbon dioxide, Atmos. Chem. Phys., 11, 3581–3593, doi:10.5194/acp-11-3581-2011, 2011.
Marquis, M. and Tans, P.: Carbon Crucible, Science, 320, 460–461, 2008.
Messerschmidt, J., Macatangay, R., Notholt, J., Petri, C., Warneke, T., and Weinzierl, C.: Side by side measurements of CO2 by
ground-based Fourier transform spectrometry (FTS), Tellus B, 62, 749–758, doi:10.1111/j.1600-0889.2010.00491.x, 2010. Morino, I., Uchino, O., Inoue, M., Yoshida, Y., Yokota, T.,
Wennberg, P. O., Toon, G. C., Wunch, D., Roehl, C. M., Notholt, J., Warneke, T., Messerschmidt, J., Griffith, D. W. T., Deutscher, N. M., Sherlock, V., Connor, B., Robinson, J., Sussmann, R., and Rettinger, M.: Preliminary validation of column-averaged volume mixing ratios of carbon dioxide and methane retrieved from GOSAT short-wavelength infrared spectra, Atmos. Meas. Tech., 4, 1061–1076, doi:10.5194/amt-4-1061-2011, 2011. Popa, M. E., Gloor, M., Manning, A. C., Jordan, A., Schultz,
U., Haensel, F., Seifert, T., and Heimann, M.: Measure-ments of greenhouse gases and related tracers at Bialystok tall tower station in Poland, Atmos. Meas. Tech., 3, 407–427, doi:10.5194/amt-3-407-2010, 2010.
Rayner, P. J. and O’Brien, D. M.: The utility of remotely sensed CO2 concentration data in surface source inversions, Geophys. Res. Lett., 28, 175–178, 2001.
Reuter, M., Bovensmann, H., Buchwitz, M., Burrows, J. P., Con-nor, B. J., Deutscher, N. M., Griffith, D. W. T., Heymann, J., Keppel-Aleks, G., Messerschmidt, J., Notholt, J., Petri, C., Robinson, J., Schneising, O., Sherlock, V., Velazco, V., Warneke, T., Wennberg, P. O., and Wunch, D.: Retrieval of atmospheric CO2 with enhanced accuracy and precision from
SCIAMACHY: Validation with FTS measurements and com-parison with model results, J. Geophys. Res., 116, D04301, doi:10.1029/2010JD015047, 2011.
Rodgers, C. D. and Connor, B. J.: Intercomparison of re-mote sounding instruments, J. Geophys. Res., 108, 4116, doi:10.1029/2002JD002299, 2003.
Stephens, B. B., Gurney, K. R., Tans, P. P., Sweeney, C., Peters, W., Bruhwiler, L., Ciais, Philippe AN DRamonet, M., Bousquet, P., Nakazawa, T., Aoki, S., Machida, T., Inoue, G., Vinnichenko, N., Lloyd, J., Jordan, A., Heimann, M., Shibistova, O., Langenfelds, Ray L. ANDSteele, L. P., Francey, R. J., and Denning, A. S.: Weak Northern and Strong Tropical Land Carbon Uptake from Vertical Profiles of Atmospheric CO2, Science, 316, 1732–1735, doi:10.1126/science.1137004, 2007.
Washenfelder, R., Toon, G., Blavier, J.-F., Yang, Z., Allen, N., Wennberg, P., Vay, S., Matross, D., and Daube, B.: Carbon diox-ide column abundances at the Wisconsin Tall Tower site, J. Geo-phys. Res., 111, 1–11, doi:10.1029/2006JD007154, 2006. WMO: GAW Report No. 194 – 15th WMO/IAEA Meeting of
Ex-perts on Carbon Dioxide, Other Greenhouse Gases and Related Tracers Measurement Techniques, Tech. rep., World Meteoro-logical Organization, 2009.
Wunch, D., Toon, G. C., Wennberg, P. O., Wofsy, S. C., Stephens, B. B., Fischer, M. L., Uchino, O., Abshire, J. B., Bernath, P., Bi-raud, S. C., Blavier, J.-F. L., Boone, C., Bowman, K. P., Browell, E. V., Campos, T., Connor, B. J., Daube, B. C., Deutscher, N. M., Diao, M., Elkins, J. W., Gerbig, C., Gottlieb, E., Griffith, D. W. T., Hurst, D. F., Jiménez, R., Keppel-Aleks, G., Kort, E. A., Macatangay, R., Machida, T., Matsueda, H., Moore, F., Morino, I., Park, S., Robinson, J., Roehl, C. M., Sawa, Y., Sherlock, V., Sweeney, C., Tanaka, T., and Zondlo, M. A.: Calibration of the Total Carbon Column Observing Network using aircraft pro-file data, Atmos. Meas. Tech., 3, 1351–1362, doi:10.5194/amt-3-1351-2010, 2010.
Wunch, D., Toon, G. C., Blavier, J.-F. L., Washenfelder, R. A., Notholt, J., Connor, B. J., Griffith, D. W. T., Sherlock, V., and Wennberg, P. O.: The Total Carbon Column Ob-serving Network, Philos. T. Roy. Soc. A, 369, 2087–2112, doi:10.1098/rsta.2010.0240, 2011.
Yang, Z., Washenfelder, R., Keppel-Aleks, G., Krakauer, N., Ran-derson, J., Tans, P., Sweeney, C., and Wennberg, P.: New con-straints on Northern Hemisphere growing season net flux, Geo-phys. Res. Lett., 34, L12807, doi:10.1029/2007GL029742, 2007. York, D., Evensen, N. M., Martinez, M. L., and De Basabe Delgado, J.: Unified equations for the slope, intercept, and standard errors of the best straight line, American Journal of Physics, 72, 367, doi:10.1119/1.1632486, 2004.
Zhao, C. L. and Tans, P. P.: Estimating uncertainty of the WMO mole fraction scale for carbon dioxide in air, J. Geophys. Res., 111, D08S09, doi:10.1029/2005JD006003, 2006.