HAL Id: hal-01878993
https://hal.archives-ouvertes.fr/hal-01878993
Submitted on 15 Oct 2019
HAL is a multi-disciplinary open access archive for the deposit and dissemination of sci-entific research documents, whether they are pub-lished or not. The documents may come from teaching and research institutions in France or abroad, or from public or private research centers.
L’archive ouverte pluridisciplinaire HAL, est destinée au dépôt et à la diffusion de documents scientifiques de niveau recherche, publiés ou non, émanant des établissements d’enseignement et de recherche français ou étrangers, des laboratoires publics ou privés.
Impact of the calibration conditions of XR-RV3 films on
peak skin dose measurements in interventional radiology
J. Greffier, C. van Ngoc Ty, Mathieu Agelou, J. Coulot, B. Ledermann, S.
Ovtchinnikoff, F. Pereira, J. Beregi, G. Bonniaud
To cite this version:
J. Greffier, C. van Ngoc Ty, Mathieu Agelou, J. Coulot, B. Ledermann, et al.. Impact of the calibration conditions of XR-RV3 films on peak skin dose measurements in interventional radiol-ogy. Radiation Protection Dosimetry, Oxford University Press (OUP), 2017, 174 (2), pp.207-215. �10.1093/rpd/ncw116�. �hal-01878993�
Influence of the calibration conditions of radiochromic film on the
measurement of peak skin dose in interventional radiology
J. Greffiera,*, C. Van Ngoc Tyb, M. Agelouc, J. Coulotb, B. Ledermannd S.
Ovtchinnikoffa, Z. Abidata, JP. Beregia, G. Bonniaudb,e
5
a. Department of Radiology, Nîmes University Hospital , Medical Imaging Group Nîmes, EA 2415, Bd Prof Robert Debré 30029 Nîmes Cedex, France
b. Esprimed , 1, mail du Pr Georges Mathé, 94800 Villejuif, France
c. CEA, LIST, Laboratoire de modélisation et simulation des systèmes, 91191 Gif sur Yvette 10
cedex, France
d. Department of Cardiology, Nîmes University Hospital, Bd Prof Robert Debré 30029 Nîmes Cedex, France
e. Department of Radiology, Bretagne Atlantique Hospital Center, Bd Général Guillaudot, 56000 Vannes, France
15
* Corresponding author: Joël Greffier, CHU de Nîmes, Medical Imaging Group Nîmes, EA 2415, Bd Prof Robert Debré, 30029 Nîmes Cedex 9; tel: +33.466.683.309; fax: 20
ABSTRACT
Purpose:
The evaluation of Peak Skin Dose (PSD) is a key issue for patient radiation dose management 25
in interventional procedures. The impact of radiochromic films calibration on PSD measurements in pulsed fluoroscopy was investigated under various kVp and additional filtration conditions.
Methods:
Films were calibrated free-in-air for six beam qualities (kVpmmCu+mmAl: 700.1:+1 ; 900.1+1;
30
900.4+1; 1200.1+1; 1200.4+1; 1200.9+1) between 0.2 and 3Gy with Allura Xper FD20 system
(Philips, Amsterdam, Netherland). Six calibration curves were constructed (CC-700.1+1 to
CC-1200.9+1). Films reading were carried out with a commercial scanner (Epson, Suwa, Japan).
Each beam quality was characterized in terms of mean energy (ME) in air, with table, with table and water phantom using Monte Carlo (MC) simulations. The influence of kVp and 35
additional filtration selection on PSD measurement was evaluated free-in-air with a cross reading of each films with each CC. As several kVp and additional filtrations could be used during a procedure, additional films were exposed in air with mixed kVp ({701/3+901/3+1201/3}0.1+1 and {701/3+901/3+1201/3}0.4+1) and with mixed additional filtration
({700.1+1}1/2+{700.4+1}1/2 to {1200.1+1}1/2+{1200.4+1}1/2). Beam qualities of the mixed beams
40
were also characterized in terms of ME with the MC simulations. The influence of clinical mixed kVp and additional filtration on PSD measurement was again evaluated free-in-air with a cross reading of each mixed beam films with each CC. Finally, a cohort of 155 patient films from cardiology (37) and vascular (118) procedures were read with each CC. Routine calibration beam quality 1200.1+1 was taken as reference (DoseNorm). Statistical comparisons
45
between reference calibration beam quality and other beam qualities was obtained using the paired MannWhitney-Wilcoxon test.
Results:
ME ranged from 45.6keV to 75.5keV for 700.1+1 to 1200.9+1 beam qualities in air. Mixed beam
ME ranged from 48.3keV to 65.3keV in air. Table transmission and patient backscatter 50
decreased ME up to 4.9keV for 1200.9+1 beam quality. In terms of beam reading in air, the
read dose was overestimated when the ME of the film was greater than the ME of the CC used and vice versa. Deviations ranged from -28% (700.1+1 read with CC-1200.9+1) to +41%
(1200.9+1 read with CC-700.1+1). For mixed beam, when the exposed film was read with the
closest ME calibration the maximum deviation was -12% (ME 53keV film read with CC-55
900.4+1/59.4keV). The error ranged from -24% (ME 48.1keV read with CC-1200.9+1) to +28%
(ME 64.9keV film read with CC-700.1+1). Dose reading variations were equivalent for cardiac
and vascular patients depending on CC. Dose ratio with DoseNorm ranged from -12%
(CC-1200.9+1) to +25% (CC-700.1+1). PSD tended to be underestimated when the CC used had a
higher ME than the reference and vice versa. 60
Conclusions: Overall we observed that for a wider ME difference between the exposed film
and the CC used, a larger deviation was observed. The choice of beam quality for the calibration is a key point when additional filtration and kVp are automatically controlled in clinical conditions.
65
KEY WORDS: Radiochromic film, calibration, energy dependence, Interventional
angiography, patients.
ABRREVIATIONS
CC: Calibration curves 70
MC: Monte Carlo ME: Mean Energy PKA : Air Kerma Product
PSD: Peak Skin Dose 75
INTRODUCTION
X-ray image guided procedures are widely used for diagnostic and therapeutic examinations. Interventional angiography can deliver high dose to skin1 and skin injuries have been 80
reported2, 3. Hence, radiation dose management guidelines have been proposed to improve patient follow-up4. Skin injuries are directly related to the peak skin dose (PSD). Patients should have clinical follow-up above a PSD of 3 Gy. Such a follow-up is improved by having both the PSD and extent(s) of skin dose greater than 3 Gy, with a skin dose map. Though,
dose metrics such as the reference point air kerma (KAref) and the kerma area product (PKA)
85
are useful indicators, they are poorly correlated to the PSD5 and they do not give any dose extent information. Thus, several methods have been proposed to monitor skin dose6. Non real-time dosimeters, such as TLD chip or polymer gel can be placed in the patient back prior
to the procedure5-7. PSD can also be calculated from indirect dose metrics, such as the KAref
or the PKA8-10. On-line tools have been developed to monitor PSD and give a skin dose map
90
for radiation risk management during interventions11, 12. Direct measurements of PSD can be
performed using Gafchromic® films XR-RV35, 6, 12-16. The high resolution and the large
surface of the film results in a 2D dose map. A film calibration is required to evaluate PSD 16
and is performed in the air, and the kVp dependence of film response has been previously investigated16. However additional filtration was introduced to reduce the amount of low 95
energy photon17. Both kVp and total filtration modify the photon spectrum, a recent study
showed the importance of choosing the appropriate calibration beam quality in air18. Hence,
patient follow up depends on the beam quality chosen for the film calibration (energy and filtration). To our knowledge, although numerous calibration studies were performed for
previous XR films19-22, only two studies were conducted for XR-RV3 characterization films16,
100
18
. This study examines for the first time the impact of XR-RV3 calibration on clinical PSD reading and dose map by extension.
Since interventional imaging systems regulates kVp and additional filtration, response of XR-RV3 film has been investigated. We have constructed six calibration curves. Cross readings between each exposed beam quality films with each free-in-air calibration are reported. As 105
several beam qualities could be selected by the system dose rate control during a procedure, we analyzed the film response exposed to mixed beam qualities using our six calibration curves. The influence of table transmission and patient backscattered photons were also investigated by calculating beam Mean Energy (ME) in air, using Monte Carlo (MC) simulations. Finally, calibration conditions on clinical dose readings were investigated in a 110
METHODS AND MATERIAL
X ray source
The reflective-type XR-RV3 Gafchromic® films (International Specialty Products (ISP), Wayne, USA) were irradiated in interventional radiology equipment: Allura Xper FD 20 115
(Philips, Amsterdam, Netherland). The X-ray system has a built-in filtration of 2.5 mm Al and different additional filtrations are available depending on the selected protocol. In this study, the films were exposed in fluoroscopy mode with a pulsed beam of 15 frames per second. An additional filtration of 0.9 mmCu + 1 mmAl was set by choosing the low dose fluoroscopy mode. The medium dose fluoroscopy and the high dose fluoroscopy mode were 120
chosen respectively to select 0.4 mmCu+ 1 mmAl and 0.1 mmCu+ 1 mmAl .The highest dose rate was reached by positioning lead aprons on the table at a fixed tube potential (kVp) and constant additional filtration.
Monte Carlo Simulation
125
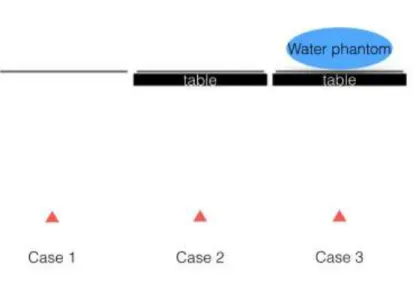
X-ray tube modeling has been introduced in PENELOPE Monte-Carlo code 24. In clinical measurements, the beam can cross the table and pad, and is exposed to backscattered photons coming from the patient. In our simulation, photon spectra have been simulated in air. Spectra were recorded at 70 cm from the source for 3 setups in air: without table and pad, with table 130
and pad, with table and pad and cylindrical water phantom. We calculated beam mean energies (ME) for each set-up: MEair, MEair-table, MEair-table-water for each combination of three
kVps (70, 90, and 120) and additional filtration detailed in X ray source section. Figure 1 summarizes simulation configurations.
Table and pad were assimilated to carbon fiber to reproduce table transmission. The elliptical 135
Figure 1: Photon spectrum simulations in PENELOPE. The source is represented by a red triangle. Case 1: spectra free-in-air. Case 2: spectra after table and pad. Case 3: spectra between patients couch and water phantom.
Free-in-air calibration
140
Film calibrations were carried out in free-in-air, films were placed on a six cm-thick polystyrene support providing negligible backscatter and irradiated at 37 cm from the focal spot. A flat ionization chamber 10x6-60 (Radcal, Monrovia, USA), was positioned at 1.5 cm above the films. Therefore, the inverse square law was applied to correct dose measurements. In order to have the totality of the ionization chamber in the exposure field, a diagonal of 48 145
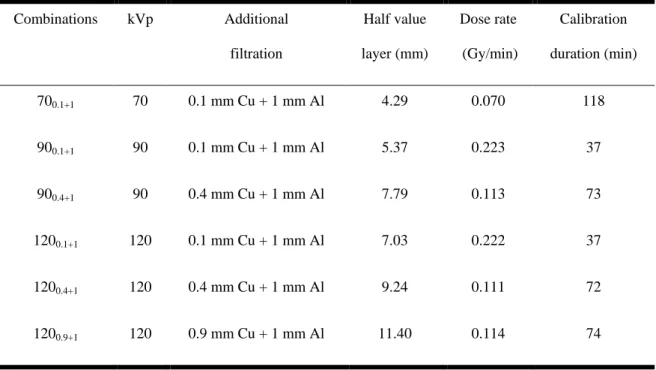
cm without zoom was used. Films were cut into pieces of 7 x 8 cm, white side facing source. Six calibration curves were constructed corresponding to different beam qualities, with different additional filtrations and kVp (Table 1). For each beam quality, calibrations were carried out using seven points (0; 0.2; 0.5; 1; 1.5; 2; 3 Gy). Half value layers (HVL) were measured with RaySafe Xi R/F detector (Unfors RaySafe, Billdal, Sweden).
150
Table 1: Beam quality and free-in-air calibration conditions used in this study Combinations kVp Additional filtration Half value layer (mm) Dose rate (Gy/min) Calibration duration (min) 700.1+1 70 0.1 mm Cu + 1 mm Al 4.29 0.070 118 900.1+1 90 0.1 mm Cu + 1 mm Al 5.37 0.223 37 900.4+1 90 0.4 mm Cu + 1 mm Al 7.79 0.113 73 1200.1+1 120 0.1 mm Cu + 1 mm Al 7.03 0.222 37 1200.4+1 120 0.4 mm Cu + 1 mm Al 9.24 0.111 72 1200.9+1 120 0.9 mm Cu + 1 mm Al 11.40 0.114 74
Film scanning and analysis
For each beam quality, the exposed films were scanned at one week ± 1h post exposure, with 160
an Epson 10000 Expression XL as per ISP recommendations. The software package « Epson Scan » (Version 3.49F) was used to control the scan parameters, which included scanning in “Professional Mode”, reflective mode, without color corrections and with a resolution of 72 dpi.
Each calibration film section was placed orange-side down in the center of the scanner in the 165
most uniform area.
The film images were analyzed with the software Film Qa-XR (ISP, Wayne, USA). A rectangular region of interest (ROI), approximately 2 x 2 cm, was placed in the center of each film image. Taking into account ISP recommendations the red color channel was used. The mean measured reflective density was associated to the measured dose.
170
On each patient film, a square ROI of 1 cm² was positioned manually in the region of maximum dose. The mean dose in this ROI is the PSD. ROIs were positioned by an
experienced medical physicist (JG) with five years of experience with Gafchromic® XR-RV3 films.
Dose cross - readings in air
175
Each free-in-air exposed films were read with each CC. This cross reading was compared to the actual measured dose. Mean discrepancies above all dose levels were evaluated for each beam quality read.
In clinical condition, additional filtration and kVp may vary depending on the patient, the X-ray tube angulation or procedure. To evaluate the influence on the film of a variation of the 180
additional filtration or kVp during an examination, we exposed the films to different conditions.
We studied the additional filtration change during an examination with exposed films to 70, 90 and 120 kVp at the dose levels of 0.4, 0.8 to 1.2 Gy . For each level, 50% of the dose has been delivered with an additional filtration of 0.1 mm Cu and 50% with 0.4 mm Cu 185
({700.1+1}1/2+{700.4+1}1/2 to {1200.1+1}1/2+{1200.4+1}1/2).
We studied the change in kVp during an examination with exposed films at 0.1 and 0.4 for three dose levels of 0.6; 1.2 and 1.8 Gy respectively. Each dose level was equally exposed to 70, 90 and 120 kVp ({701/3+901/3+1201/3}0.1+1 and {701/3+901/3+1201/3}0.4+1).
Patient
190
This study was conducted at the Radiology Dept. of Nimes University Hospital from May 2013 to June 2013. Reflective-type XR-RV3 Gafchromic® films were positioned in the patient back and PSD were measured for 155 patients who were admitted for a coronary chronic total occlusion (CTO) or for an abdominal embolization. Angioplasty stentings (AS) for CTO were performed in an interventional radiology room Allura Xper FD10 (Philips, 195
Amsterdam, Netherland) and abdominal embolization in Allura Xper FD20 (Philips, Amsterdam, Netherland).
Each film was read using all CC (700.1+1 ; 900.1+1 ; 900.4+1 ; 1200.1+1 ; 1200.4+1 ; 1200.9+1).
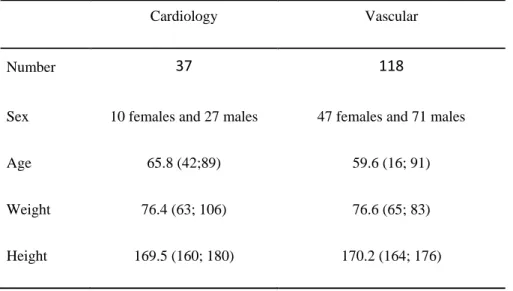
Thirty-seven AS and 118 abdominal embolization (22 gonadal-vein, 23 digestive-artery, 17 renal-artery, 10 iliac-renal-artery, 15 uterine-renal-artery, 11 hepatic chimio-embolization and 20 others 200
location embolization) were performed (Table 2).
Table 2: Patient population for the period May 2013 to June 2015
Cardiology Vascular
Number 37 118
Sex 10 females and 27 males 47 females and 71 males
Age 65.8 (42;89) 59.6 (16; 91)
Weight 76.4 (63; 106) 76.6 (65; 83)
Height 169.5 (160; 180) 170.2 (164; 176)
The mean PSD value and standard deviation of the ROI were measured for each CC. The read 205
doses by each CC were normalized to the reference beam quality routinely used: 1200.1+1.
Measured doses were normalized (DoseNorm) to the reference beam quality used routinely:
1200.1+1.
Finally, in clinical practice, PSD threshold can be used to trigger patient follow-up for doses 210
that might produce relevant injury in a normal size patient. Therefore, we have counted the
number of patient above 3Gy as recommended by the SIR guidelines 4, with each CC.
Statistics
Statistical analysis was performed using ‘Biostatgv’ (http://marne.u707.jussieu.fr/biostatgv). 215
was obtained using the paired MannWhitney-Wilcoxon test. A P-value < 0.01 (adjusted for multiple comparisons) was considered significant.
RESULTS
220
Monte Carlo Simulation
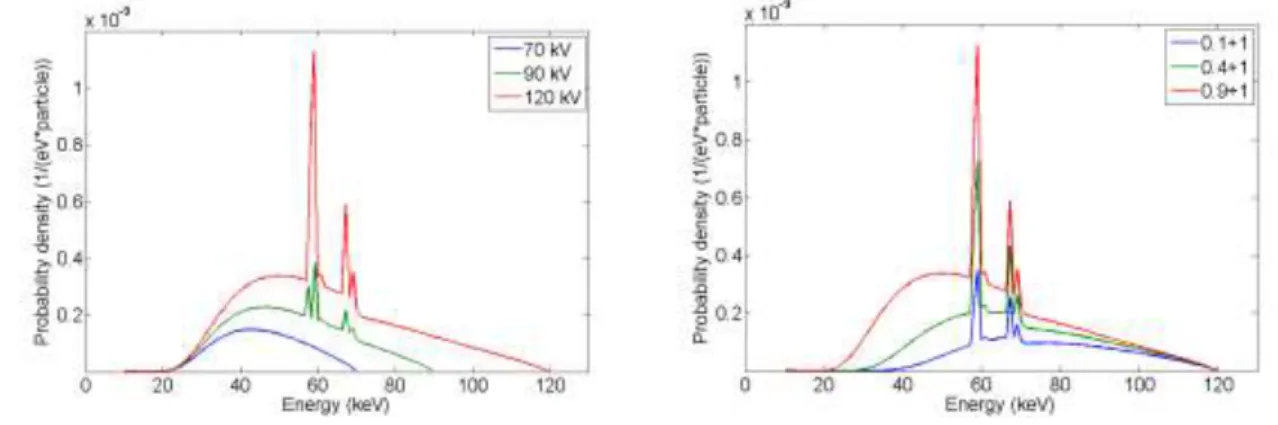
Figure 2 shows the influence of the filtration (2.a) and voltage (2.b) on the air photon spectra.
Figure 2: Air photon spectrum. Left: 0.1 mm Cu, 70/ 90/ 120 kVp. Right: 120 kVp, 0.1/ 0.4/0.9 Cu +1 mm Al
Figure 3 compares 6 MC-simulated spectra for 700.1+1 beam and for 1200.9+1 beam: in air, in air with
table, in air with table and at water phantom entrance.
Figure 3: Air photon spectrum. Left:700.1+1 Right: 1200.9+1 in Air/Air+Table/Air+Table+patient 225
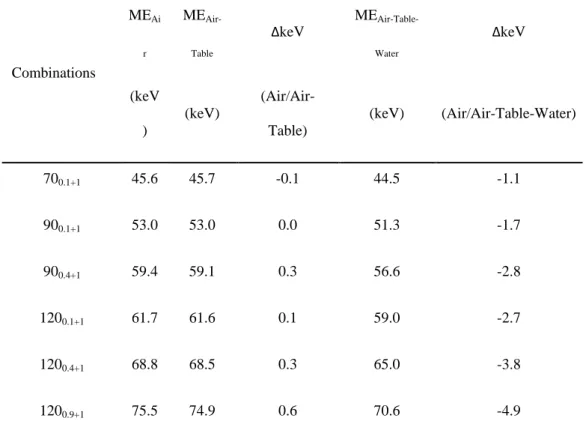
MEair, MEair-table, MEair-table-water are listed in Table 3 for each studied beam. The table reduces
the amount of photon. However, the ME is only slightly affected (less than 1 keV). The presence of backscattered photons results in a decrease of the ME. The highest decrease of 4.9 keV is observed for the highest beam quality (1200.9+1). Our results show that for a higher
MEair, more pronounced decrease of MEAir-Table-Water is observed.
Table 3: Mean keV in air, with table pad, with table and water phantom.ΔkeV corresponds to the difference between mean energy in air and other simulations.
Combinations MEAi r MEAir-Table ΔkeV MEAir-Table-Water ΔkeV (keV ) (keV) (Air/Air-Table) (keV) (Air/Air-Table-Water) 700.1+1 45.6 45.7 -0.1 44.5 -1.1 900.1+1 53.0 53.0 0.0 51.3 -1.7 900.4+1 59.4 59.1 0.3 56.6 -2.8 1200.1+1 61.7 61.6 0.1 59.0 -2.7 1200.4+1 68.8 68.5 0.3 65.0 -3.8 1200.9+1 75.5 74.9 0.6 70.6 -4.9 235 Free-in-air calibration
Each « free-in-air » calibration took less than two hours depending on the combination kVp/Filtration (Table 1). The fastest calibration (37 min) was obtained with a dose rate of
0.222 Gy/min for 900.1+1 and 1200.1+1 beam. The slowest calibration (118 min) was obtained
with a dose rate of 0.070 Gy/min for 700.1+1 beam.
240
Figure 4 shows the CC obtained for the various beam qualities. For the same dose, the measured optical density decreased with the reduction of the ME of the beam.
Dose cross- readings in air
245
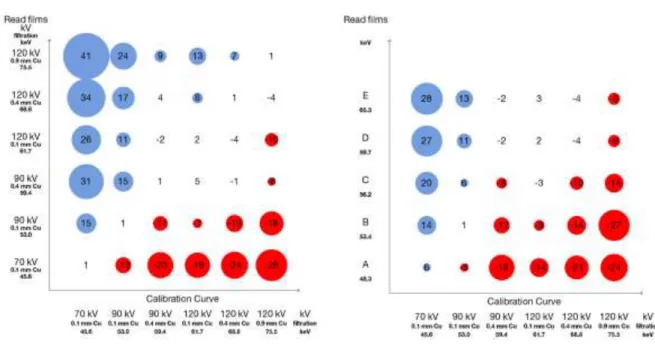
The average difference between the read and measured dose in air was 1 to 2% when exposed films were read with the associated CC. The read dose was overestimated when the ME of the film was greater than the ME of the CC used and vice versa (Figure 5.a). For example, when the 1200.9+1 films (ME of 75.3 keV) were read with the 700.1+1 CC (ME of 45.2 keV) the
measured dose was overestimated by 41%. Conversely, the read dose was underestimated by 250
28% when the 700.1+1 films are read with 1200.9+1 CC.
Figure 5b shows the reading variations of mixed films using different CC. The maximum deviation was -12 % if the exposed film was read with the two CC closest in terms of ME. A general trend was observed: for a wider ME difference between the exposed film and the CC used, a larger deviation was observed.
255
Figure 5: Mean reading deviations (in percentage) in air. Left (5.a): Cross reading between the 6 calibration curves Right (5.b): reading of mixed quality beam with 6 calibration curves.
Patient’s film reading
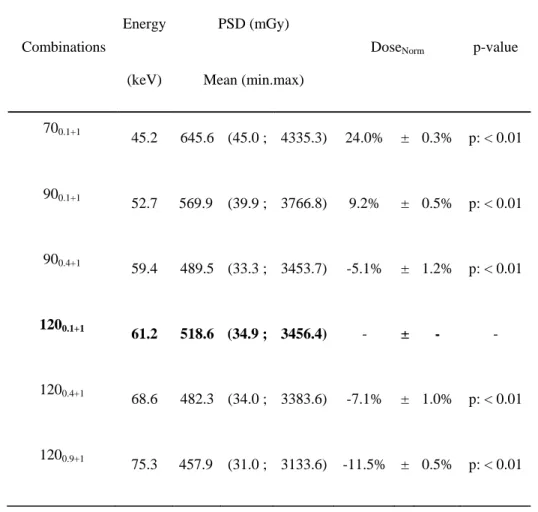
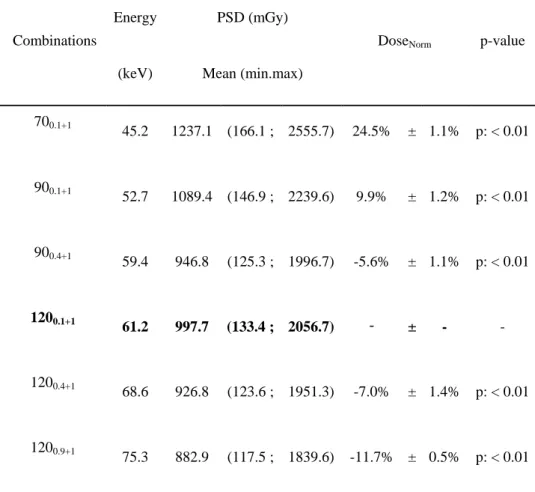
Dose reading variations are equivalent for cardiac and vascular patients depending on CC 260
(Tables 4 and 5). The measured dose was overestimated when films were read with a CC with a lower voltage than the reference voltage for the same additional filtration. At 90 kVp and 70 kVp, the skin dose was overestimated by 10% and 25%, respectively. Conversely, exposed films read using a CC with a higher filtration than the reference voltage for the same filtering the measured dose was underestimated. Skin doses were underestimated by -7% and -12% for 265
1200.4+1 and 1200.9+1, respectively. A general trend was observed: PSD tends to be
underestimated when the CC used has a higher ME than the reference and vice versa, except for 900.4+1 beam quality.
Table 4: Cardiology PSD reading
Combinations
Energy PSD (mGy)
DoseNorm p-value (keV) Mean (min.max)
700.1+1 45.2 645.6 (45.0 ; 4335.3) 24.0% ± 0.3% p: < 0.01 900.1+1 52.7 569.9 (39.9 ; 3766.8) 9.2% ± 0.5% p: < 0.01 900.4+1 59.4 489.5 (33.3 ; 3453.7) -5.1% ± 1.2% p: < 0.01 1200.1+1 61.2 518.6 (34.9 ; 3456.4) - ± - -1200.4+1 68.6 482.3 (34.0 ; 3383.6) -7.1% ± 1.0% p: < 0.01 1200.9+1 75.3 457.9 (31.0 ; 3133.6) -11.5% ± 0.5% p: < 0.01 270
Table 5: Vascular PSD reading
Combinations
Energy PSD (mGy)
DoseNorm p-value (keV) Mean (min.max)
700.1+1 45.2 1237.1 (166.1 ; 2555.7) 24.5% ± 1.1% p: < 0.01 900.1+1 52.7 1089.4 (146.9 ; 2239.6) 9.9% ± 1.2% p: < 0.01 900.4+1 59.4 946.8 (125.3 ; 1996.7) -5.6% ± 1.1% p: < 0.01 1200.1+1 61.2 997.7 (133.4 ; 2056.7) - ± - -1200.4+1 68.6 926.8 (123.6 ; 1951.3) -7.0% ± 1.4% p: < 0.01 1200.9+1 75.3 882.9 (117.5 ; 1839.6) -11.7% ± 0.5% p: < 0.01 275
Out of the 155 patients included in this study (admitted for AS and abdominal embolization since May 2013), only one patient was triggered for a follow-up using calibration routine CC (1200.1+1) with a 3 Gy PSD threshold. The number of patients followed would have reached
six patients using 700.1+1 CC and would have been zero using 1200.9+1 CC.
DISCUSSION
The reflective-type XR-RV3 Gafchromic® films have many advantages and represent the 285
most effective and most appropriate solution to estimate and locate PSD during interventional radiology procedure. These films have a large size and a high spatial resolution and are simpler to use than other routinely detectors (TLDs or diodes). However, PSD reading is carried out in deferred time. Indeed, the films are read 24 hours after exposure, and a CC has to be assigned to correlate the measured optical density to the delivered dose. Film calibration 290
is a critical step to ensure a reliable PSD measurement. Calibration is mostly performed according to the manufacturer's recommendations, in air, with the higher dose rate (>1
Gy/min). However, according to Farah et al18, dose rate variation does not have influence on
film calibration.
Our study was performed with films white facing towards x-ray source, following ISP 295
recommendation. However, as some groups work using the other side facing the source, it
would be interesting to evaluate the orange side facing source18. We used our flatbed scanner
without uniformity correction. Hence, our scanner related uncertainty is up to 7% (k=1). However, we used the same scanner and read all films with the same procedure, our mean deviation was note affected by the film reading procedure.
300
Films calibration in air does not consider patient backscattered photons nor table attenuation. MC simulations were conducted to quantify the impact of these two factors on film calibration in terms of beam ME. The results of these simulations showed that the impact on the beam ME is relatively low taking into account the attenuation of the table (-0.3% ± 0.3%) and slightly more important with the backscattered issued by the water phantom (-4.4% ± 305
1.3%). In both cases, the reduction of the ME tended to increase when beam energy increases. Our simulation results are in agreement with the MC simulation conducted by McCabe et
al.14. Indeed, the ME was reduced by 3.4 keV for 120 kVp with a first HVL of 6.96 mm Al and a ME of 49.9 keV.
To obtain a high dose rate, film calibration is usually performed in service mode with the 310
highest voltage and the lowest additional filtration, corresponding to 1200.1+1. With the energy
dependence of the films14, the measured doses may be over- or under-estimated in function of
the beam quality used during clinical procedure. To clinically evaluate this energy dependence, five calibration energies different from the energy typically used in calibration routine (1200.1+1) were studied and compared. Our results confirm that dose measurements
315
with Gafchromic® films are dependent on the beam energy and in particular to kVp and filtration variations. McCabe et al.14 showed that for the same filtration, 500cGy to 100kV gave 670cGy (+ 34%) at 80 kVp and t 420cGy (-16%) at 120kV. The same trend was found in this study in air. With the same additional filtration, for 200cGy measured at 900.1+1, the
measured dose is increased by +14% (228cGy) at 700.1+1 and decreased -11% (178cGy) at
320
1200.1+1. Furthermore, our study also evaluated the filtration influence on the measured dose.
For 1200.4+1 exposed films, the measured dose is underestimated by -4% with 1200.9+1 CC and
CONCLUSION
325
In the air, discrepancies between read and measured dose may even reach -28% and +41%. It is observed that the more the ME of the beam increases, relative to the ME of the CC, the more the measured dose is overestimated and vice versa.
During an interventional radiology procedure, the use of fluoroscopy and digital acquisition modes results in different kVp/filtration selection. Moreover, this combination depends on the 330
patient's morphology, the procedure, and the incidence used. As found by McCabe et al.14, limitation to a single calibration energy for PSD reading leads to an error in the measurement of the dose to the skin. PSD measured doses on patients for cardiology and vascular procedures confirmed these results. Similar differences are found for both types of procedures. Discrepancies between -12% and +25% were found between our reference CC 335
and 5 other calibration energies. For one CTO, a PSD of 346 cGy was measured with
reference CC but PSD ranged from 314cGy to 434cGy with the other CC. Observed
discrepancies in air are larger than for PSD measured discrepancies. This can be correlated to the range of ME in air and with water phantom. The range of ME CC is reduced by the contribution of backscattered photons.
340
The beam quality choice for the calibration is a key point to establish reliable patient follow-up when additional filtration and kVp are automatically controlled. In clinical practice, film calibration should be performed after analyzing kVp and filtration used for the target
procedure. A CCcan also be defined based on the specialty studied (vascular, cardiovascular
...) according to the variations of the parameters used in the X-ray system selected protocols. 345
In all cases, if single CCis constructed, the results of this study can be used to provide an estimate of the error associated with the beam quality dependence.
This study provides an estimate of the error depending on the voltage and filtration used in clinical conditions for two specialties studied.
ACKNOWLEDGEMENTS: We would like to thanks M. Lomma for this support in this
350
study.
The authors confirm that neither the submitted manuscript nor any similar manuscript, in whole or in part is under consideration, in press, or published elsewhere.
REFERENCES
355
1 T.R. Koenig, D. Wolff, F.A. Mettler, L.K. Wagner, "Skin injuries from fluoroscopically guided procedures: part 1, characteristics of radiation injury," AJR. American journal of roentgenology 177, 3-11 (2001).
2 D.L. Miller, S. Balter, P.E. Cole, H.T. Lu, B.A. Schueler, M. Geisinger, A. Berenstein, R. Albert, J.D. Georgia, P.T. Noonan, J.F. Cardella, J. St George, E.J. Russell, T.W. Malisch, R.L. Vogelzang, G.L.
360
Miller, 3rd, J. Anderson, R.-I. study, "Radiation doses in interventional radiology procedures: the RAD-IR study: part I: overall measures of dose," Journal of vascular and interventional radiology : JVRAD-IR 14, 711-727 (2003).
3 S. Balter, J.W. Hopewell, D.L. Miller, L.K. Wagner, M.J. Zelefsky, "Fluoroscopically guided interventional procedures: a review of radiation effects on patients' skin and hair," Radiology 254,
326-365
341 (2010).
4 M.S. Stecker, S. Balter, R.B. Towbin, D.L. Miller, E. Vano, G. Bartal, J.F. Angle, C.P. Chao, A.M. Cohen, R.G. Dixon, K. Gross, G.G. Hartnell, B. Schueler, J.D. Statler, T. de Baere, J.F. Cardella, S.I.R. Safety, C. Health, C.S.o.P. Committee, "Guidelines for patient radiation dose management," Journal of vascular and interventional radiology : JVIR 20, S263-273 (2009).
370
5 J. Farah, A. Trianni, E. Carinou, O. Ciraj-Bjelac, I. Clairand, J. Dabin, C. De Angelis, J. Domienik, H. Jarvinen, R. Kopec, M. Majer, F. Malchair, A. Negri, L. Novak, T. Siiskonen, F. Vanhavere, Z. Knezevic, "Measurement of maximum skin dose in interventional radiology and cardiology and challenges in the set-up of European alert thresholds," Radiation protection dosimetry 164, 138-142 (2015).
375
6 S. Balter, "Methods for measuring fluoroscopic skin dose," Pediatric radiology 36 Suppl 2, 136-140 (2006).
7 P.E. Antoniou, P. Bousbouras, R. Sandaltzopoulos, E. Kaldoudi, "Investigating the potential of polymer gel dosimetry for interventional radiology: first results," Physics in medicine and biology 53, N127-136 (2008).
380
8 A.K. Jones, A.S. Pasciak, "Calculating the peak skin dose resulting from fluoroscopically guided interventions. Part I: Methods," Journal of applied clinical medical physics / American College of Medical Physics 12, 3670 (2011).
9 A.K. Jones, J.E. Ensor, A.S. Pasciak, "How accurately can the peak skin dose in fluoroscopy be determined using indirect dose metrics?," Medical physics 41, 071913 (2014).
385
10 Y. Khodadadegan, M. Zhang, W. Pavlicek, R.G. Paden, B. Chong, E.A. Huettl, B.A. Schueler, K.A. Fetterly, S.G. Langer, T. Wu, "Validation and initial clinical use of automatic peak skin dose localization with fluoroscopic and interventional procedures," Radiology 266, 246-255 (2013).
11 V.K. Rana, S. Rudin, D.R. Bednarek, "Updates in the real-time Dose Tracking System (DTS) to improve the accuracy in calculating the radiation dose to the patients skin during fluoroscopic
390
procedures," Proceedings of SPIE--the International Society for Optical Engineering 8668, 86683Z (2013).
12 C. Bordier, R. Klausz, L. Desponds, "Accuracy of a dose map method assessed in clinical and anthropomorphic phantom situations using Gafchromic films," Radiation protection dosimetry 165, 244-249 (2015).
395
13 C. Bordier, R. Klausz, L. Desponds, "Patient dose map indications on interventional X-ray systems and validation with Gafchromic XR-RV3 film," Radiation protection dosimetry 163, 306-318 (2015). 14 B.P. McCabe, M.A. Speidel, T.L. Pike, M.S. Van Lysel, "Calibration of GafChromic XR-RV3
radiochromic film for skin dose measurement using standardized x-ray spectra and a commercial flatbed scanner," Medical physics 38, 1919-1930 (2011).
400
15 N. Khelassi-Toutaoui, A. Toutaoui, A. Merad, Z. Sakhri-Brahimi, B. Baggoura, B. Mansouri, "Assessment of Radiation Protection of Patients and Staff in Interventional Procedures in Four Algerian Hospitals," Radiation protection dosimetry2015).
16 J.G. M. Labattu, V. Chassin, L. Cassagnes, F. Magnier, D. Donnarieix, L. Boyer, L. Chabrot, "Assessment of skin dose in interventional radiology using radiochromic films," Radioprotection 48,
405
115-126 (2013).
17 K.A. Fetterly, "Investigation of the practical aspects of an additional 0.1 mm copper x-ray spectral filter for cine acquisition mode imaging in a clinical care setting," Health physics 99, 624-630 (2010). 18 J. Farah, A. Trianni, O. Ciraj-Bjelac, I. Clairand, C. De Angelis, S. Delle Canne, L. Hadid, C. Huet, H.
Jarvinen, A. Negri, L. Novak, M. Pinto, T. Siiskonen, M.J. Waryn, Z. Knezevic, "Characterization of
410
XR-RV3 GafChromic((R)) films in standard laboratory and in clinical conditions and means to evaluate uncertainties and reduce errors," Medical physics 42, 4211-4226 (2015).
19 R. Sanchez, E. Vano, J.M. Fernandez, A. Machado, N. Roas, "Visual and numerical methods to measure patient skin doses in interventional procedures using radiochromic XR-RV2 films," Radiation protection dosimetry 147, 94-98 (2011).
415
20 A. Blair, J. Meyer, "Characteristics of Gafchromic XR-RV2 radiochromic film," Medical physics 36, 3050-3058 (2009).
21 S.A. Dini, R.A. Koona, J.R. Ashburn, A.S. Meigoonia, "Dosimetric evaluation of GAFCHROMIC XR type T and XR type R films," Journal of applied clinical medical physics / American College of Medical Physics 6, 114-134 (2005).
420
22 O. Rampado, E. Garelli, S. Deagostini, R. Ropolo, "Dose and energy dependence of response of Gafchromic XR-QA film for kilovoltage x-ray beams," Physics in medicine and biology 51, 2871-2881 (2006).