HAL Id: cea-00563824
https://hal-cea.archives-ouvertes.fr/cea-00563824
Submitted on 16 Dec 2020HAL is a multi-disciplinary open access archive for the deposit and dissemination of sci-entific research documents, whether they are pub-lished or not. The documents may come from teaching and research institutions in France or abroad, or from public or private research centers.
L’archive ouverte pluridisciplinaire HAL, est destinée au dépôt et à la diffusion de documents scientifiques de niveau recherche, publiés ou non, émanant des établissements d’enseignement et de recherche français ou étrangers, des laboratoires publics ou privés.
Europium(III) Complexed by HPSEC Size-Fractions of
a Vertisol Humic Acid: Small Differences Evidenced by
Time-Resolved Luminescence Spectroscopy
Pascal E. Reiller, Julien Brevet, Antonio Nebbioso, Alessandro Piccolo
To cite this version:
Pascal E. Reiller, Julien Brevet, Antonio Nebbioso, Alessandro Piccolo. Europium(III) Complexed by HPSEC Size-Fractions of a Vertisol Humic Acid: Small Differences Evidenced by Time-Resolved Luminescence Spectroscopy. Spectrochimica acta. Part A: Molecular spectroscopy, Elsevier, 2011, 78 (3), pp.1173-1179. �10.1016/j.saa.2010.12.075�. �cea-00563824�
Europium (III) Complexes with Size-Fractions
Separated from a Humic Acid by HPSEC only
Evidence Few Differences in their Chemical
Environment by Time-Resolved Luminescence
Spectroscopy.
Pascal E. Reiller,a,* Julien Brevet2, Antonio Nebbioso3, Alessandro Piccolo3.
a CE Saclay, CEA/DEN/DANS/DPC/SECR, Laboratoire de Spéciation des Radionucléides et des Molécules, Bâtiment
391 – P.C. 33, F-91191 Gif-sur-Yvette CEDEX, France
b Université d’Evry Val d’Essonne, Laboratoire Analyse et Modélisation pour la Biologie et l’Environnement, CNRS
UMR 8587, Bâtiment Maupertuis, Boulevard François Mitterrand, F-91025 Evry CEDEX, France
c Dipartimento di Scienze del Suolo, della Pianta, dell’Ambiente e delle Produzioni Animali, Università di Napoli
Federico II, Via Università 100, I-80055 Portici, Italy
* Tel: +33 1 6908 4312, Fax: +33 1 6908 5411, email: pascal.reiller@cea.fr
Abstract.
The size fractionation of a humic acid (HA) by high performance size exclusion chromatography (HPSEC) was used as a proxy for the filtration effect during HA transport through a porous medium with minimum specific chemical interactions. The modification of the Eu(III)-HA complexes’ formation with the different size-fractions, as compared to the bulk HA, were studied in time-resolved luminescence spectroscopy (TRLS). Clear modifications in
Eu(III)-HA complexes’ structures were shown and related to the molecular characteristics of the separated size-fractions. The properties of most of size-fractions did not induce a major alteration of the affinity towards Eu(III). Only the most hydrophilic fractions eluted in the tail of the chromatographic peak, representing about 11% of total fractions-weight, gave some significantly different parameters. Using a simplistic complexation model, it was found that the available complexation sites decreased with the size reduction of humic fractions.
Keywords.
Humic acid, Europium, fractionation, complexation, luminescence, fluorescence
1. Introduction
Humic substances (HS), mainly composed of humic acids (HA) and fulvic acids (FA), are the main surrogate of natural organic matter. They play an important role in the transport of lanthanides (Ln) and actinides (An) in the environment (McCarthy, et al., 1998; Fujikawa, et al., 1999; Santschi, et al., 2002; Pourret, et al., 2010). The exact nature of the Ln/An-HS interactions during transport and especially during sorption mechanisms is still unclear. Particularly, the fractionation of natural organic matter on mineral surfaces introduces some difficulties in modelling sorption of metals in ternary system, i.e., metal/HA/surface. In the case of FA, the modelling approach was partly successful, although the FA’s sorptive behaviour may be explained with electrostatic considerations (Heidmann, et al., 2005; Weng, et al., 2008), and assumed to be more or less similar to that of simple organic molecules (Schulthess and McCarthy, 1990). The FA sorption is stable or tends to decrease with ionic strength (Schlautman and Morgan, 1994; Filius, et al., 2000; Weng, et al., 2006). Conversely, HA have a different behaviour since a sorption increase on oxides is occurring (Murphy, et al., 1994; Schlautman and Morgan, 1994; Weng, et al., 2006). Hence, it is still difficult to propose
sound interpretations of HA effects on the modelling of ternary systems in a wide parametric space (Vermeer, et al., 1999; Lippold and Lippmann-Pipke, 2009).
The intimate structure of HS is still a matter of debate. Nevertheless, a consensus is emerging from small-angle scattering methods (Tombácz, et al., 1997), atomic force microscopy (Österberg, et al., 1995; Balnois, et al., 1999), high-performance size-exclusion chromatography (HPSEC) (Piccolo, et al., 1999; Piccolo, et al., 2001), electrospray ionization mass spectrometry (Plancque, et al., 2001; These, et al., 2004), electrophoresis (Duval, et al., 2005), or nuclear magnetic resonance (Conte, et al., 2006; Conte, et al., 2007), on the fact that HS are formed of nanometric sub-entities that associate in larger bodies in the case of HA. The cohesion of these associations is assured through short range interactions, which can be largely modified in contact with strong sorbing mineral surfaces like Fe or Al oxides (Gu, et al., 1994; Hur and Schlautman, 2003; Reiller, et al., 2006; Claret, et al., 2008).
During transport in a particular environment, HA associations can be submitted to different interactions. First, a ‘simple’ filtration effect, which can alter the HA structure as by performing a size-exclusion ‘sorting out’ different constituents making up the associations. Second, a sorptive fractionation induced by chemical interactions with minerals in the environment, which induces a separation of constituents based on their affinity to the mineral phase (Gu, et al., 1994; Hur and Schlautman, 2003; Reiller, et al., 2006; Claret, et al., 2008). In fact, it is difficult to obtain these parameters independently. Christl et al. showed that the functionality (Christl and Kretzschmar, 2001) and metal binding (Christl, et al., 2001) of different size-fractions of a HA from ultrafiltration were comparable within a narrow range. Claret et al. (2008) noted that the influence of sorptive fractionation of HS on α-Al2O3 was
important from the evolution of the chemical environment of europium(III) by time-resolved luminescence spectroscopy (TRLS).
The aim of this work was to study the differences in chemical environment of Eu(III), if any, when complexed by HPSEC-separated humic size-fractions, as a proxy for the filtration effect during HA transport through a porous medium with minimum specific chemical interactions.
2. Material and Methods
2.1. Humic acid.
The humic acid from Ginchi (GHA) was extracted from a recently cultivated forested vertisol of Ethiopian highlands (09°01’N, 38°20’E, 2300 m asl, see Spaccini, et al., 2001, for further details). Soil properties, isolation and purification procedures, and GHA characteristics are reported elsewhere (Spaccini, et al., 2001; Spaccini, et al., 2006). The previously
freeze-dried GHA was suspended in distilled water and titrated to pH 7 with a CO2-free solution of
0.5 mol L-1 KOH by an automatic titrator (VIT 90 Videotitrator, Radiometer, Copenhagen,
Denmark) under N2 atmosphere and stirring. After having reached the constant pH 7, the
solution containing potassium-humates was left under titration for 2 more hours, filtered through a Millipore 0.45 µm, and freeze-dried. Potassium humates were pretitrated at pH 7 to limit HPSEC interferences.
2.2. Preparative HPSEC separation.
The mobile phase for HPSEC consisted of a 242 mg L-1 Na2HPO4, 248 mg L-1 NaH2PO4·2H2O,
820 mg L-1 CH3CO2Na, milli-Q water solution at pH 7 and added with 300 mg L-1 NaN3 as
bacteriostatic agent. The same solution was used to dissolve the potassium humates to a
concentration of 600 mg L-1. The humic solution was filtered through glass microfibre filters
(Whatman GF/C) and loaded into a rheodyne rotatory injector, equipped with a 5 mL sample loop. The HPSEC system consisted of a Gilson autosampler model 231, a Gilson 305 pump, a preparative Biosep SEC-S-2000 (600 mm, 21.2 mm id) column, preceded by a Biosep SEC-S-2000 guard column (78.0 mm, 21.2 mm id) both from Phenomenex (USA), a Gilson 116
UV detector set at 280 nm, and a Gilson FC205 fraction collector, to automatically collect
humic fractions in continuous. The elution flow-rate was set at 1.5 mL min-1 and all
chromatographic runs were automatically recorded by a Unipoint Gilson Software. Ten fractions were separated with HPSEC elution: within a 37.5-135.0 mL interval, nine fractions were collected changing vial every 7.5 mL, whereas 30.0 mL were collected for the tenth fraction. The ten isolated size-fractions were first freeze-dried to reduce their volume, resuspended in 5 mL of deionised water, dialyzed (Spectra/Por 6 dialysis tube, 1kDa MW cut-off) against deionised water, and freeze-dried again. Out of 110 injections of the HA solution (330.0 mg), the total weight recovered in the ten isolated fractions was about 90% (297.5 mg) of the initial injected weight. The preparative HPSEC profile of the Ginchi HA showed two main peaks (Figure 1a). The first one (Fraction G1-G4) encompassed the majority of the mass distribution (55%, see Figure 1b). Fraction G5 shows an increase in absorbance but it does not result in an increase in mass percentage relative to Fraction G4.
Typically, the HPSEC chromatograms of humics reported in literature do not show the resolution that is proper of homogeneous materials, since the large number of heterogeneous molecules, which is accounted to be more than 10000 in humic acids (Moulin, et al., 2001; Piccolo and Spiteller, 2003; Reiller, et al., 2006), and their absorption spectra overlapping is the very cause of the signal broadening in the chromatogram. Moreover, one must not forget that our separation of humic fractions was done in the preparative mode (5 mL of loading volume), that has an even lower resolution than analytical HPSEC, as reported elsewhere (Piccolo, et al., 2002; Conte, et al., 2006; Conte, et al., 2007). The preparative HPSEC has the goal to obtain quantitative amounts of humic fractions which can be subjected to further analysis more than determining the humic molecular size distribution. In the preparative mode also the notations of void and total volumes loose the importance that is commonly attributed to analytical HPSEC. The important issue is to obtain highly reproducible chromatograms in order to isolate meaningful and quantitative fractions during the repetitive
chromatographic runs. In preparative HPSEC mode, adsorption is concomitant with size-exclusion separation to a larger extent (mL vs. µL of loading volume) than in analytical HPSEC, thereby showing a longer tailing chromatogram.
a b 0 10 20 30 40 50 60 GH A1 GH A2 GH A3 GH A4 GH A5 GH A6 GH A7 GH A8 GH A9 GH A10 M a s s of f ra c ti on s 0% 20% 40% 60% 80% 100% C um ul a te d %
Figure 1. HPSEC profile of the Ginchi humic acid. The vertical bars mark the time intervals during which the ten fractions were collected (a), and mass of fractions (bar graph, left hand side ordinate) and cumulated percentage (square, right hand side ordinate) of the ten fractions of Ginchi HA separated by preparative HPSEC (b).
2.3. Solution
Europium (III) stock solution was obtained from the dissolution of Eu2O3 (Johnson
Matthey, 99.99%) in HClO4. It is assumed that the humic complexation is complete with C(Eu)
= 10 µmol L-1 and C(HS) = 200 mg L-1 (Marang, et al., 2008) at pH 5, even if the ratios between
Eu(III) and the number of available sites in the different fractions can be slightly different (Christl, et al., 2000; Christl and Kretzschmar, 2001; Christl, et al., 2001). The ionic strength
was fixed with 0.1 mol L-1 (NaClO4), and pH 5 was adjusted using freshly prepared NaOH and
HClO4. The dissolution of GHA, bulk and fractions, were done at pH 10 overnight and then
adjusted to pH 5. The pH measurements were done using a combined–glass electrode
(Radiometer Analytical XC111) calibrated for its linear response with a 0.01 mol L-1 HClO4
solution, an equimolar 0.02 mol L-1 NaH2PO4/Na2HPO4 solution and an equimolar 0.02 mol L-1
Na2CO3/NaHCO3 solution, all containing NaClO4 to keep [Na+] constant at 0.1 mol L-1 (pH = 2.0,
6.8, and 9.9, respectively). The electrode filling solution was modified with NaClO4 0.1 mol L-1,
NaCl 10-2 mol L-1 to prevent KClO4 precipitation in the frit of the electrode. The pH 5 value was
chosen to limit the formation of hydroxo and carbonato complexes of Eu(III).
2.4. Time-resolved luminescence spectroscopy
Europium (III) has been used to probe its laser-induced luminescence properties in contact with humic substances. This technique has been used to study the lanthanide (III)-HS interactions, and the rationale was to either determine interaction constants (Dobbs, et al., 1989; Chung, et al., 2005; Marang, et al., 2008), or gather information on the lanthanide (III) chemical environment (Thomason, et al., 1996; Shin and Choppin, 1999; Li and Korshin, 2002; Kumke, et al., 2005; Claret, et al., 2008; Brevet, et al., 2009; Marang, et al., 2009; Reiller and
Brevet, 2010). The observed luminescence corresponds to the 5D0→7F0 transition (electric and
magnetic dipole forbidden, maximum around 580 nm), the 5D0→7F1 transition (magnetic
dipole, maximum around 615 nm). These emission lines come from transitions of the 5D0
excited state to the ground 7Fj manifold (Bünzli, 1989).
The excitation laser beam was generated by a 355 nm tripled output of a Continuum Nd-YAG laser, coupled to an optical parametric oscillator system (Panther II, Continuum, USA).
The wavelength was tuned to 394 nm, which corresponds to the 7F0→5L6 transition of Eu(III),
providing about 1 mJ of energy in a 5 ns pulse with a repetition rate of 10 Hz. After inner conversion, the 5D1 level is transferring energy to the 5D0 level and the transitions to the 7Fj
manifold can be observed. Additionally, HS are able to absorb the laser emission at 394 nm
and part of the absorbed energy is transferred from the 3ππ* triplet level to the central
europium ion. The time-resolved luminescence signal is collected at 90° and focused into a
Acton spectrometer (slit 1 mm) using either a 600 lines mm-1 or a 1800 lines mm-1 grating.
The signal is collected during a gate width W = 300 µs, after a gate delay D = 10 µs after excitation by the laser flash. Emission spectra were recorded using a CCD camera cooled at -15°C.
3. Results and Discussions
3.1. 5D0→7F0 and 5D0→7F1 transitions at 1800 lines/mm.
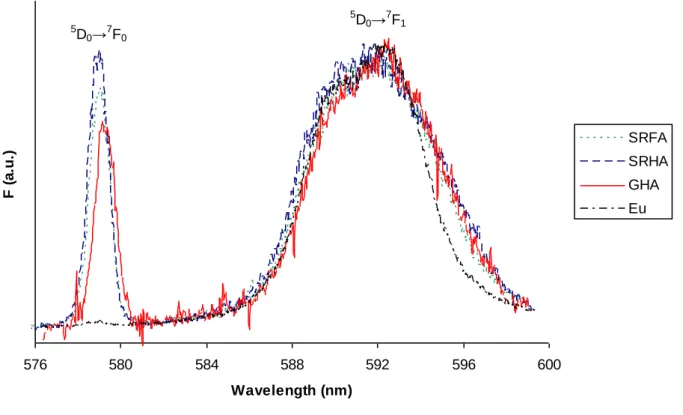
The 5D0→7F0 and 5D0→7F1 transitions of the Eu(III)-GHA complex is presented in Figure 2,
together with Eu(III) complexed by Suwannee River FA (SRFA), and HA (SRHA) spectra previously obtained (Reiller and Brevet, 2010). It can be noted that the 5D0→7F0 transition,
which is not apparent in the Eu3+ spectrum for magnetic and electric reasons, becomes
important in Eu(III)-HS complexes due to loss of symmetry (Judd, 1962; Ofelt, 1962). The transition is slightly redshifted in the Eu(III)GHA complex as compared to Eu(III)SRFA and -SRHA complexes. The maximum and full-width at mid-height (w) of this transition are obtained from a fitting with a Lorentzian-Gaussian peak (McNemar and Horrocks, 1989),
Ii = Imax,iexp -0.5 λi - λ0,i σLG,i ² λi - λ0,i σLG,i ² + 1 (1)
where Imax,I is the maximum intensity of the ith peak, λ0,i is the wavelength of this maximum,
and σLG,i is the ‘standard deviation’, which can be related to wi = 1.46 σLG,i.
576 580 584 588 592 596 600 Wavelength (nm) F (a .u. ) SRFA SRHA GHA Eu 5 D0→7F0 5 D0→7F1
Figure 2. Eu(II) 5D0 → 7F0 and 5D0 → 7F0 transitions at C(Eu) = 10-5 mol L-1, C(HS) = 200 mg L-1,
pH 5, I = 0.1 mol L-1 (NaClO4), λexc = 394.6 nm, D = 10 µs, W = 300 µs, 1800 lines mm-1 grating for different humic substances. Eu3+ (dot-dash), Eu(III)-SRFA (dotted), and -SRHA (dashed) from Reiller & Brevet (2010), and Eu-GHA (full line, this study).
As shown by Reiller & Brevet (2010), the mono-component fit of the transition is satisfactory in consideration of the existing signal-to-noise ratio (Figure S1 of SI). The peak
maximum gave the value of λEu-GHA = 579.26 nm with σLG = 0.75 nm. The red-shift of the peak
maximum was significant in comparison to λEu-SRHA = 579.03 nm and λEu-SRHA = 578.98 nm
ligands and wave number of the 7F0→5D0 transition υ0 (17263.5 cm-1), i.e., CN = 0.237 Δυ +
0.638 (Choppin and Wang, 1997), yielded a CN = 3.6 ± 0.7. This was slightly larger than for both Eu-SRFA and -SRHA complexes, i.e. CN = 2.0 and 1.6 (± 0.7), respectively (Reiller and Brevet, 2010). This suggests that the chemical environment for Eu(III) in complexes with GHA may be somewhat different from those with Suwannee River extracts.
The σLG value, resulting in wGHA = 1.1 nm, compared well with those obtained with
Suwannee River extracts, i.e., σLG,SRFA = 0.71 nm (wSRFA = 1.04 nm) and σLG,SRHA = 0.72 nm
(wSRHA = 1.05 nm) (Reiller and Brevet, 2010) or other humic extracts (Shin and Choppin,
1999). This further confirmed the large distribution of this transition in humic solution, as compared to simple molecules (Horrocks and Sudnick, 1981; Yeh, et al., 2000) or virus binding sites (Burroughs, et al., 1992), and also revealed the general large distribution of chemical environments in HS.
The peak ratios 5D0→7F0/5D0→7F1 are also noticeably different between Eu(III)-SRFA and
-SRHA complexes and Eu(III)-GHA complex. The value of the maximum intensity ratio of the
peaks, I(7F0/7F1) = 0.77, is lower than the one obtained for Eu(III)-SRFA and -SRHA, i.e., 0.87
and 0.99, respectively (Reiller and Brevet, 2010). This suggests that the loss of symmetry in the case of Eu(III)-GHA is lesser than for Eu(III)-SRFA and -SRHA. However, the area ratio
(trapezoid method) of Eu(III)-GHA, i.e. A(7F0/7F1) = 0.134, is comparable to those of
Eu(III)-SRFA and -SRHA that showed values of 0.139 and 0.150, respectively (Reiller and Brevet,
2010). This illustrates that 5D0→7F0 FWMH is slightly greater than Eu(III)-SRHA and -SRHA,
and that 5D0→7F1 transition of Eu(III)-GHA is visually narrower than the Eu(III)-SRHA
transition. The magnetic dipole transition 5D0→7F1 is not supposed to be largely influenced by
the subtle changes in symmetry (Richardson, 1982) that seem to exist among the different chemical environments provided by the different humic fractions. Only a close inspection at
1800 lines mm-1 permits to reveal these modifications directly in aqueous solution at ambient
temperature.
3.2. 5D0→7F2 at 1800 lines/mm.
The 5D0→7F2 hypersensitive transition of the Eu(III)-GHA complex is shown in Figure 3, as
compared to Eu(III)-HS complexes previously obtained with Suwannee River HA and FA (Brevet, et al., 2009; Reiller and Brevet, 2010), Gorleben AH, and Leonardite HA (Brevet, et al., 2009). The modification of the transition’s structure is even more spectacular, as compared to
5D0→7F1. The most outstanding difference among the different complexes was the shoulder ca.
612 nm that was more prominent for Eu(III)-SRFA than for any other extract. The HS from purely aquatic medium, i.e. SRHA (Figure 3), and Kleiner Kranichsee bog HA and FA (Germany, see Fig. 4 in Brevet, et al., 2009), exhibited mostly the same transition shape, with a lower 612 nm shoulder. Finally, Leonardite HA and Gorleben HA, together with commercial Aldrich HA, showed a narrow-shaped transition with the lowest intensity for 612 nm shoulders.
605 610 615 620 625 630 Wavelength (nm) F( a.u.) Leonardite SRFA SRHA Gohy573 GHA
Figure 3. Eu(III) 5D0 → 7F2 transitions at C(Eu) = 10-5 mol L-1, C(HS) = 200 mg L-1, pH 5, I = 0.1 mol L-1 (NaClO4), λexc = 394.6 nm, D = 10 µs, W = 300 µs, 1800 lines mm-1 grating for different humic acids. Eu–HS complexes with Eu(III)SRFA (empty square), SRHA (empty triangle), -Leonardite HA (empty circle), and -Gorleben HA (filled circle) from Brevet et al. (2009), and Eu(III)-GHA (filled diamond, this study).
The origin of these different 612 nm shoulders is not easily settled. One can be tempted to attribute this shoulder to the result of a Stark level. A Stark level can be identified in solid state or in solution at low temperature (4K). In aqueous solution we do not have the possibility to decompose the signal in overlapping Stark levels which are broadened with temperature. In addition, HS are composed of aggregates of molecules which offer distributions of functionality that lead to overlapping. Hence, the origin of the 612 nm shoulder is not easily settled and would need further developments that are out of the scope of this study.
Our results show that the 612 nm shoulder of GHA is comparable to other ‘terrestrial’ HA extracts. Nevertheless, the wavelength span greater than 615 nm is not comparable to Leonardite HA nor to Gorleben HA (see Brevet, et al., 2009, and reference therein). This part
interpret these differences in peak’s shapes with the degree of humification. Since GHA is originated from a forest soil, its diagenesis is presumably more advanced than in Suwannee River, although it should be less advanced than in a lignite like Leonardite HA, or in an oxidized extract from a sedimentary deposit like Gorleben (Buckau, et al., 2000).
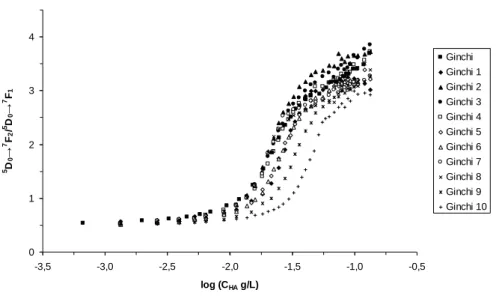
3.3. Comparisons of the complexometric titrations.
The complexometric titration curves for the different extracts are reported in Figure 4. These curves were obtained from the evolution of the 5D0→7F2/5D0→7F1 peak area ratios
(Dobbs, et al., 1989; Claret, et al., 2008). Three groups of fractions can be proposed. First, the fractions for which complexation properties were mostly identical to the original bulk GHA,
i.e. G2, G3, G4, G7, and G8. Second, G1, G5, and G7 showed only slightly lower complexation
strengths, as compared to bulk GHA. Third, the most retarded G9 and G10 fractions appeared increasingly different from bulk GHA. It can then be seen that most of fractions could be fairly well compared with the bulk GHA, except for the ‘smallest’ or ‘lightest’ fractions, which were significantly different in terms of complexation strength.
The interactions can be quantified using a simplistic model (Moulin, et al., 1992), where humic substances are considered as mixture of discrete sites omitting the charges,
Eu + HA ⇄ EuHA β (L mg-1) = C(EuHA)
C(Eu) C(HA) (2)
0 1 2 3 4 -3,5 -3,0 -2,5 -2,0 -1,5 -1,0 -0,5 log (CHA g/L) 5D 0 → 7F 2 / 5D 0 → 7F 1 Ginchi Ginchi 1 Ginchi 2 Ginchi 3 Ginchi 4 Ginchi 5 Ginchi 6 Ginchi 7 Ginchi 8 Ginchi 9 Ginchi 10
Figure 4. Comparison of the complexometric titration curves of C(Eu) = 10-5 mol L-1 with increasing concentration of GHA fractions, pH 5, I = 0.1 mol L-1 (NaClO4), based on area ratios.
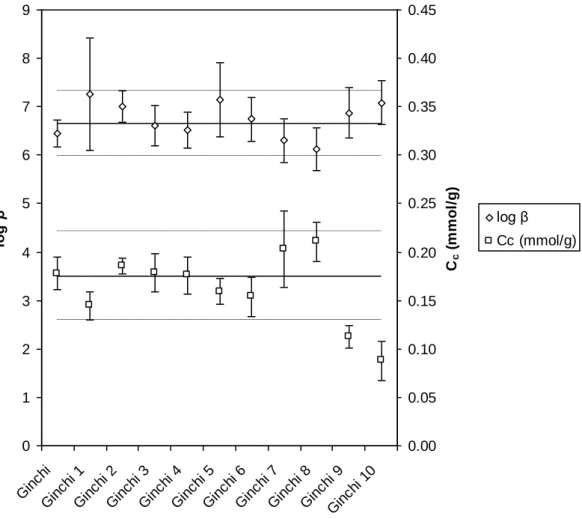
The obtained parameters, namely the complexation constant β, and complexation capacity
of the extracts Cc (mmol g-1), are reported in Figure 5. This model may appear too simplistic,
but (i) the amount of the different fractions were not sufficient to perform reliable acid-base titrations (Janot, et al., 2010), and (ii) the application of generic parameters, as those selected otherwise (Christl and Kretzschmar, 2001; Christl, et al., 2001; Milne, et al., 2001), may not be directly applied to our case. As by our approach, the magnitude of log β (complexation strength) was not the most influencing parameter, while it was instead the number of available complexation sites that explained most of modifications in GHA separated fractions. A complexation constant with a mean value of log β = 6.7 ± 0.7 (2σ) can be proposed for the bulk GHA and the ten different size-fractions. This value is in agreement with other determination under comparable total europium concentration and pH (Caceci, 1985; Bidoglio, et al., 1991; Yamamoto, et al., 2005; Kautenburger and Beck, 2007). A mean value of
0.18 ± 0.05 mmol g-1 was calculated for the Cc complexing capacity of bulk GHA, and the G1 to
G8 fractions. The Cc values of 0.11 ± 0.01 and 0.09 ± 0.02 mmol g-1 were obtained for the G9
These findings may be related to the modification of HS during the size fractionation. The low molecular-weight molecules are assumed to be more retarded in the gel structure. When the low molecular weight molecules finally reaches the outlet, their complexation strength seems to be weaker than that of materials that has move more freely through the gel. This effect is nevertheless less intense in this case than observed in a previous work after the sorptive HS fractionation on α-alumina (Claret, et al., 2008).
0 1 2 3 4 5 6 7 8 9 Gin chi Gin chi 1 Gin chi 2 Gin chi 3 Gin chi 4 Gin chi 5 Gin chi 6 Gin chi 7 Gin chi 8 Gin chi 9 Gin chi 1 0 log β 0.00 0.05 0.10 0.15 0.20 0.25 0.30 0.35 0.40 0.45 Cc ( m m ol /g) log β Cc (mmol/g)
Figure 5. Comparison of complexation parameters for the different HPSEC fraction of GHA obtained from the titration curves in Figure 4.
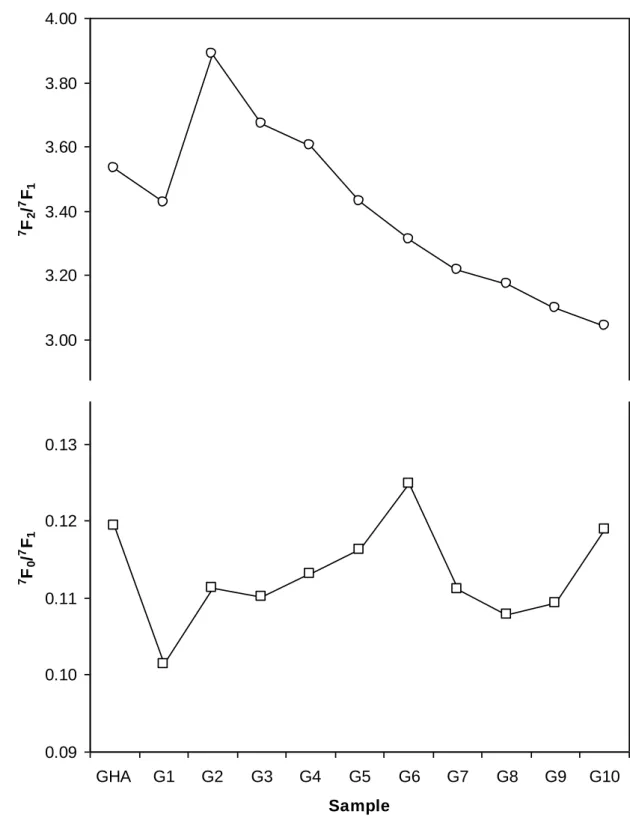
3.4. Evolutions of spectra for the different fractions.
The chemical environments provided by the different size-fractions were also estimated from changes in luminescence spectra of different complexes. Spectra of solutions containing
10µmolEu L-1 and 200 mgHA L-1 were acquired using the 600 lines mm-1 grating. The different
spectra are shown in Figure S2 of SI, and the different A(7F2/7F1) and A(7F0/7F1) values are
reported in Figure 6. The shape of both 5D0→7F1 and 5D0→7F0 transitions did not evolve. This
was expected for the former magnetic transition, and suggests a small if not absent modification in the centro-symmetry of complexes from the latter transition. While the evolution of A(7F0/7F1) was absent, A(7F2/7F1) decreased from 3.6-4.0 to 3.2 with decreasing
size of separated fractions (Figure 6). This effect cannot be attributed to a difference in the saturation of humic sites since it appeared to be already attained (Figure 4). Although log β
and Cc values were almost identical for bulk GHA and the G1 to G8 fractions, the symmetry
around Eu(III) was clearly and progressively evolving with changes in fractions’ sizes. This could be interpreted as a gradual modification in the composition of the different fractions.
Smaller-sized HPLC-fractions are known to be increasingly enriched in carbohydrate-like molecules, whereas a progressive decrease in the amount of aromatic structure was found
(Piccolo, et al., 2002; Conte, et al., 2007). Thus, the observed decrease of A(7F2/7F1) may be
due to both an increasing number of carbohydrate molecules, exhibiting much lower A(7F2/7F1) value (Plancque, et al., 2005), and a decreasing number of aromatic molecules
(Conte, et al., 2007). This varying molecular distribution during GHA fractionation modifies
the indirect excitation of the central europium (III) atom via the 3ππ* triplet level. We must
also precise here that no assumption is made hitherto on the functionality of these aromatic molecules. The influence of aromatic moieties on Eu(III) luminescence do not mean that europium(III) is linked to phenolic moieties at pH 5, which is unlikely (ca. 1% of the total Eu-HS complex following Milne, et al., 2003 for a generic HA), but that aromatic moieties contribute to the excitation. The energy transfer could be due to a resonance phenomenon or due to an exchange mechanism, i.e., Förster resonance energy transfer (FRET) or Dexter energy transfer, respectively (Turro, 1991). FRET can be operative over distances as long as
Dexter requires an overlap of the electron orbital of the donor and the acceptor. As the distance between the ligands and Eu(III) is relatively short, the Dexter energy transfer could be favoured. So far, in the case of HA, the link between the binding sites and the chromophores engaged in the energy transfer has not been demonstrated unequivocally. Thus, the resonance phenomenon cannot be ruled out.
The evolution of the 5D0→7F2 transition was further checked using a grating of 1800 lines
mm-1. The main difference among fractions was the 612 nm shoulder, as already discussed for
2.80 3.00 3.20 3.40 3.60 3.80 4.00 GHA G1 G2 G3 G4 G5 G6 G7 G8 G9 G10 Sample 7 F 2 / 7 F 1 0.09 0.10 0.11 0.12 0.13 0.14 GHA G1 G2 G3 G4 G5 G6 G7 G8 G9 G10 Sample 7 F 0 / 7 F 1
Figure 6. Evolution of A(7F2/7F1) (up) and A(7F0/7F1) (down) of Eu(III) complexed by the different Ginchi fractions: C(Eu) = 10-5 mol L-1, C(HS) = 200 mg L-1, pH 5, I = 0.1 mol L-1 (NaClO4), 600 lines mm-1 grating. Original data in Figure S4 of SI.
3.5. Luminescence decay-times analyses of GHA.
The luminescence decays of the Eu(III)-HS complexes are generally described by a bi-exponential function, which is described for our fully integrative system by
F =
i=1 n D D+W Foi exp – tτ i dt =
i=1 n Foi i exp– D i 1 – exp – W i (3) F = F° x1 τ1 exp – Dτ 1 1 – exp – Wτ 1 + (1 – x1) τ2 exp – Dτ 2 1 – exp – Wτ 2where F is the luminescence signal, F°I, and τi are the initial luminescence and the decay time
of component i, respectively, x1 the proportion of the first decay in the global signal, D the
delay after the laser excitation, and W the gate width. The possible influence of photochemical reactions of humic substances on the complexation strength can be neglected out under our experimental conditions as seen previously (Monsallier, et al., 2003; Reiller and Brevet, 2010).
The decay time evolution was obtained from the 5D0→7F2 peak area for different
Eu(III)-GHA complexes at delays between 10 and 505 µs (Figure S3 and Table S1 of SI). The inevitable correlation between the parameters is shown in Table S1 of the SI. This showed, as for other extracts (Chung, et al., 2005; Brevet, et al., 2009; Marang, et al., 2009; Reiller and Brevet, 2010), a bi-exponential decay with τ1 = 44 ± 2 µs and τ2 = 184 ± 3 µs. The
bi-exponential decay can only happens if two deexcitation processes from two different excited states are occurring. In our case the deexcitation states seem to be very close in structure
(Reiller and Brevet, 2010), and τ1, seemed to be characteristic of a fast reaction in the excited
state for Ln(III) and An(III) (Billard and Lützenkirchen, 2003; Freyer, et al., 2009; Reiller and Brevet, 2010). Hence this ‘species’ only occurs during the excitation and is not involved in the environmental reaction without direct excitation.
Conversely, τ2 could be interpreted as a function of Eu(III) chemical environment in
humic-complexes. The differences in spectra at low and high delay were evidenced in Reiller and
Brevet (2010). The application of the relation between τ2 and the number of water molecules
in the first hydration sphere proposed by Kimura et al. (1998), yielded a number of 5 ± 0.5 remaining water molecules out of 9. This is in agreement with the coordination number of 3.6, as determined from λmax(7F0). It is to be pointed out that the particular dependence of
Eu(III)-HS complexes on the number of remaining water molecules in the first coordination sphere, has not been verified up to now. Moreover, the possibility of internal quenching leading to a different expression is possible (Horrocks and Sudnick, 1979; Supkowski and Horrocks, 2002; Kuke, et al., 2010).
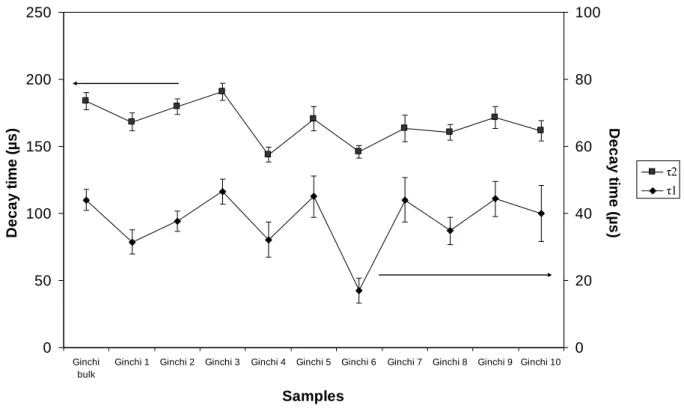
The fitting of the luminescence decays obtained for the Eu(III) complexes are reported in Table S1 of the SI. The evolution of decay times with different GHA size-fractions are reported on Figure 7. In line with previous studies in aqueous solution (Brevet, et al., 2009; Marang, et
al., 2009; Reiller and Brevet, 2010), τ1 did not show a major trend. We also verified this lack of
dependence in Eu-HA sorbed on α-alumina (Janot, et al., submitted). If this fast decay time was due to a fast exchange, then its lack of modification with origin or mode of preparation of
humic size-fraction would be explainable. The very slight decrease observed for τ2 could
eventually be reconciled with a difference of one H2O molecule in the first hydration sphere.
However, the uncertainty of this determination (σ = 0.5) prevents the reliability of the trend. Hence, there is not a major difference between all these samples.
0 50 100 150 200 250 Ginchi bulk
Ginchi 1 Ginchi 2 Ginchi 3 Ginchi 4 Ginchi 5 Ginchi 6 Ginchi 7 Ginchi 8 Ginchi 9 Ginchi 10
Samples D e c a y t im e ( µs ) 0 20 40 60 80 100 D e c a y ti m e (µs ) τ2 τ1
Figure 7. Evolution of fluorescence decay times of Eu(III) complexed by the different size-fractions as compared to bulk Ginchi HA, C(Eu) = 10-5 mol L-1, C(HS) = 200 mg L-1, pH 5, I = 0.1 mol L-1 (NaClO4), 600 lines mm-1 grating. Original data in Table S1 of SI.
3.6. Link with the structure of HPSEC-fractions.
Conte et al. (2006; 2007) have shown the structural modification of size-fractions during HPSEC separation for two different humic acids. Enrichment in aliphatic carbon and a
decrease in aromatic carbon were assessed by 13C-CPMAS-NMR spectra as humic
size-fractions were progressively eluted in HPSEC. In our study, we noted that the evolution of
A(7F2/7F1) followed closely the expected change in aromatic content during the HPSEC
separation of size-fractions (Conte, et al., 2006). In fact, we found an initial decrease for the first size-fraction relative to the bulk sample, and then a peak followed by a monotonous decrease. Comparison with HPSEC separation from a lignite humic acid is more difficult since the smallest-sized fractions were not collected and analyzed (Conte, et al., 2007).
Conte et al. (2006; 2007) also found that the smaller molecular-sized molecules were chemically alike and different from previously eluted fractions (Conte, et al., 2006). Our complexation results indicate that fractions G9 and G10 behaved differently from the rest of size-fractions. Our findings also relate the decrease in number of complexation sites to the decrease of carboxylic carbons as shown by Conte et al. (2006), even though the evolution is not as spectacular. We noted that the lower-size fractions used by Conte et al. (2006) were also poorer in aromatic molecules than other fractions.
Finally, the G9 and G10 fractions were the least abundant among the GHA fractions, i.e., 4% and 7% in weight, respectively. Hence, from a complexation point of view, 89% of fractions behaved similarly to the bulk GHA, despite the evident modifications found for the Eu(III) complexation environment.
4. Conclusion
Structures of the Eu(III) complexes of Ginchi HA and of its HPSEC-fractions, probed using TRLS, are slightly but significantly different. Nevertheless, these differences are not sufficient to changes the decay time of the Eu(III) luminescence within the complexes. Hence, even if the HPSEC processes induce changes within the structure of the fraction as compared to the bulk HA, ca. 90% of the Eu(III) complexes with the HA fractions are very much similar and could be considered as equivalent to bulk HA in a first approximation. Only ca. 10% of HA fractions can be considered to present a somewhat stronger affinity for Eu(III). They represent the lighter fractions which are retarded in the structure of the immobile phase of HPSEC.
HPSEC can be considered as a forced migration process which minimizes chemical interactions between the mobile (HS) and the immobile phase, i.e., mostly physical interactions are in stakes in a dynamic system. Hence, one can also consider that even if the HS fractions submitted to this physical ‘sorting out’ are different, they share mostly the same
type of interaction strength with the bulk HA. These subtle structural modifications are less important than those evidenced on oxides (Hur and Schlautman, 2003; Reiller, et al., 2006; Claret, et al., 2008). Particularly, the modification of the Eu(III) environment is clearly less important after a ‘physical’ sorptive fractionation as compared to a ‘real’ or ‘chemical’ sorptive fractionation evidenced by Claret et al. (2008).
Acknowledgment.
This work was financed through the MRISQ (DEN/DISN/AvC) and RBPCH (DEN/DISN/RSTB) projects of CEA.
References
Balnois, E., Wilkinson, K.J., Lead, J.R., Buffle, J., 1999. Atomic force microscopy of humic substances: Effect of pH and ionic strength. Environ. Sci. Technol. 33 (21), 3911.
Bidoglio, G., Grenthe, I., Qi, P., Robouch, P., Omenetto, N., 1991. Complexation of Eu and Tb with fulvic acids as studied by time-resolved laser-induced fluorescence. Talanta 38 (9), 999-1008.
Billard, I., Lützenkirchen, K., 2003. Equilibrium constants in aqueous lanthanide and actinide chemistry from time-resolved fluorescence spectroscopy: The role of ground and excited state reactions. Radiochim. Acta 91 (5), 285-294.
Brevet, J., Claret, F., Reiller, P.E., 2009. Spectral and temporal luminescent properties of Eu(III) in humic substances solutions from different origins. Spectrochim. Acta A 74 (2), 446-453. Buckau, G., Artinger, R., Fritz, P., Geyer, S., Kim, J.I., Wolf, M., 2000. Origin and mobility of humic colloids in the Gorleben aquifer system. Appl. Geochem. 15 (2), 171-179.
Bünzli, J.-C.G., 1989. Luminescent probes. In: Bünzli, J.-C.G., Choppin, G.R. (Eds.), Lanthanides probe in life, chemical and earth sciences - Theory and practice. Elsevier, Amsterdam, pp.
Burroughs, S.E., Eisenman, G., Horrocks, W.D., Jr., 1992. Characterization of the 5-fold Ca2+
binding-site of satellite tobacco necrosis virus using Eu3+ luminescence spectroscopy - A
marked size-selectivity among rare-earth ions. Biophys. Chem. 42 (3), 249-256.
Caceci, M.S., 1985. The interaction of humic acid with europium (III). Complexation strength as a function of load and pH. Radiochim. Acta 39 (1), 51-56.
Choppin, G.R., Wang, Z.M., 1997. Correlation between ligand coordination number and the
shift of the 7F0→5D0 transition frequency in europium(III) complexes. Inorg. Chem. 36 (2),
249-252.
Christl, I., Knicker, H., Kogel-Knabner, I., Kretzschmar, R., 2000. Chemical heterogeneity of humic substances: characterization of size fractions obtained by hollow-fibre ultrafiltration. Eur. J. Soil Sci. 51 (4), 617-625.
Christl, I., Kretzschmar, R., 2001. Relating ion binding by fulvic and humic acids to chemical composition and molecular size. 1. Proton binding. Environ. Sci. Technol. 35 (12), 2505-2511. Christl, I., Milne, C.J., Kinniburgh, D.G., Kretzschmar, R., 2001. Relating ion binding by fulvic and humic acids to chemical composition and molecular size. 2. Metal binding. Environ. Sci. Technol. 35 (12), 2512-2517.
Chung, K.H., Lee, W., Cho, Y., Choi, G., Lee, C., 2005. Comparison of synchronous and laser-induced fluorescence spectroscopy applied to the Eu(III)-fulvate complexation. Talanta 65 (2), 389-395.
Claret, F., Schäfer, T., Brevet, J., Reiller, P.E., 2008. Fractionation of Suwannee River fulvic acid
and Aldrich humic acids on α-Al2O3: spectroscopic evidence. Environ. Sci. Technol. 42 (23),
8809-8815.
Conte, P., Spaccini, R., Piccolo, A., 2006. Advanced CPMAS-13C NMR techniques for molecular
characterization of size-separated fractions from a soil humic acid. Anal. Bioanal. Chem. 386 (2), 382-390.
Conte, P., Spaccini, R., Smejkalova, D., Nebbioso, A., Piccolo, A., 2007. Spectroscopic and
conformational properties of size-fractions acid separated from a lignite humic. Chemosphere 69 (7), 1032-1039.
Dobbs, J.C., Susetyo, W., Knight, F.E., Castles, M.A., Carreira, L.A., Azarraga, L.V., 1989.
Characterization of metal binding sites in fulvic acids by lanthanide ion probe spectroscopy. Anal. Chem. 61 (5), 483-488.
Duval, J.F.L., Wilkinson, K.J., van Leeuwen, H.P., Buffle, J., 2005. Humic substances are soft and permeable: evidence from their electrophoretic mobilities. Environ. Sci. Technol. 39 (17), 6435-6445.
Filius, J.D., Lumsdon, D.G., Meeussen, J.C.L., Hiemstra, T., van Riemsdijk, W.H., 2000. Adsorption of fulvic acid on goethite. Geochim. Cosmochim. Acta 64 (1), 51-60.
Freyer, M., Walther, C., Stumpf, T., Buckau, G., Fanghänel, T., 2009. Formation of Cm humate
complexes in aqueous solution at pHc 3 to 5.5: The role of fast interchange. Radiochim. Acta 97
(10), 547-558.
Fujikawa, Y., Zheng, J., Cayer, I., Sugahara, M., Takigami, H., Kudo, A., 1999. Strong association
of fallout plutonium with humic and fulvic acid as compared to uranium and 137Cs in
Gu, B., Schmitt, J., Chem, Z., Liang, L., McCarthy, J.F., 1994. Adsorption and desorption of natural organic matter on iron oxide: Mechanisms and models. Environ. Sci. Technol. 28 (1), 38-46.
Heidmann, I., Christl, I., Kretzschmar, R., 2005. Sorption of Cu and Pb to kaolinite-fulvic acid colloids: Assessment of sorbent interactions. Geochim. Cosmochim. Acta 69 (7), 1675-1686. Horrocks, W.D., Jr., Sudnick, D.R., 1979. Lanthanide ion probes of structure in biology. Laser-induced luminescence decay constants provide a direct measure of the number of metal-coordinated water-molecules. J. Am. Chem. Soc. 101 (2), 334-340.
Horrocks, W.D., Jr., Sudnick, D.R., 1981. Lanthanide ion luminescent probes of the structure of biological macromolecules. Accounts of Chemical Research 14 (12), 384-392.
Hur, J., Schlautman, M.A., 2003. Molecular weight fractionation of humic substances by adsorption onto minerals. J. Colloid Interface Sci. 264 (2), 313-321.
Janot, N., Reiller, P.E., Korshin, G.V., Benedetti, M.F., 2010. Using spectrophotometric titrations to characterize humic acid reactivity at environmental concentration. Environ. Sci. Technol.,
http://dx.doi.org/10.1021/es1012142.
Janot, N., Benedetti, M.F., Reiller, P.E., Submitted. Surface and organic speciation of
europium(III) in the α-Al2O3 - humic acid system: Macroscopic and spectroscopic evidence.
Environ. Sci. Technol.
Judd, B.R., 1962. Optical absorption intensities of rare-earth ions. Phys. Rev. 127 (3), 750-761. Kautenburger, R., Beck, H.P., 2007. Complexation studies with lanthanides and humic acid analyzed by ultrafiltration and capillary electrophoresis-inductively coupled plasma mass spectrometry. J. Chromatogr. A 1159 (1-2), 75-80.
Kimura, T., Kato, Y., Takeishi, H., Choppin, G.R., 1998. Comparative study on the hydration states of Cm(III) and Eu(III) in solution and in cation exchange resin. J. Alloys Comp. 271/273, 719-722.
Kuke, S., Marmodee, B., Eidner, S., Schilde, U., Kumke, M.U., 2010. Intramolecular deactivation processes in complexes of salicylic acid or glycolic acid with Eu(III). Spectrochimica Acta Part A: Molecular and Biomolecular Spectroscopy 75 (4), 1333-1340.
Kumke, M.U., Eidner, S., Kruger, T., 2005. Fluorescence quenching and luminescence
sensitization in complexes of Tb3+ and Eu3+ with humic substances. Environ. Sci. Technol. 39
(24), 9528-9533.
Li, C.W., Korshin, G.V., 2002. Studies of metal-binding sites in natural organic matter and their role in the generation of disinfection by-products using lanthanide ion probes. Chemosphere 49 (6), 629-636.
Lippold, H., Lippmann-Pipke, J., 2009. Effect of humic matter on metal adsorption onto clay materials: Testing the linear additive model. J. Contam. Hydrol. 109 (1-4), 40-48.
Marang, L., Reiller, P.E., Eidner, S., Kumke, M.U., Benedetti, M.F., 2008. Combining
spectroscopic and potentiometric approaches to characterize competitive binding to humic substances. Environ. Sci. Technol. 42 (14), 5094-5098.
Marang, L., Eidner, S., Kumke, M.U., Benedetti, M.F., Reiller, P.E., 2009. Spectroscopic characterization of the competitive binding of Eu(III), Ca(II), and Cu(II) to a sedimentary originated humic acid. Chem. Geol. 264 (1-4), 154-161.
McCarthy, J.F., Sanford, W.E., Stafford, P.L., 1998. Lanthanide field tracers demonstrate enhanced transport of transuranic radionuclides by natural organic matter. Environ. Sci. Technol. 32 (24), 3901-3906.
McNemar, C.W., Horrocks, W.D., Jr., 1989. The resolution of laser-induced europium(III) ion excitation-spectra through the use of the Marquardt nonlinear-regression method. Appl. Spectrosc. 43 (5), 816-821.
Milne, C.J., Kinniburgh, D.G., Tipping, E., 2001. Generic NICA-Donnan model parameters for proton binding by humic substances. Environ. Sci. Technol. 35 (10), 2049-2059.
Milne, C.J., Kinniburgh, D.G., van Riemsdijk, W.H., Tipping, E., 2003. Generic NICA-Donnan model parameters for metal-ion binding by humic substances. Environ. Sci. Technol. 37 (5), 958-971.
Monsallier, J.M., Schüßler, W., Buckau, G., Rabung, T., Kim, J.I., Jones, D., Keepax, R., Bryan, N., 2003. Kinetic investigation of Eu(III)-humate interactions by ion exchange resins. Anal. Chem. 75 (13), 3168-3174.
Moulin, V., Tits, J., Moulin, C., Decambox, P., Mauchien, P., de Ruty, O., 1992. Complexation behaviour of humic substances towards actinides and lanthanides studied by time-resolved laser-induced spectrofluorimetry. Radiochim. Acta 58/59, 121-128.
Moulin, V., Reiller, P., Amekraz, B., Moulin, C., 2001. Direct characterization of iodine covalently bound to fulvic acids by electrospray mass spectrometry. Rapid Commun. Mass Spectrom. 15 (24), 2488-2496.
Murphy, E.M., Zachara, J.M., Smith, S.C., Phillips, J.L., Wietsma, T.W., 1994. Interaction of
hydrophobic organic compounds with mineral bound humic substances. Environ. Sci. Technol. 28 (7), 1291-1299.
Ofelt, G.S., 1962. Intensities of crystal spectra of rare-earth ions. J. Chem. Phys. 37 (3), 511-520.
Österberg, R., Mortensen, K., Ikai, A., 1995. Direct observation of humic-acid clusters, a nonequilibrium system with a fractal structure. Naturwissenschaften 82 (3), 137-139. Piccolo, A., Conte, P., Cozzolino, A., 1999. Effects of mineral and monocarboxylic acids on the molecular association of dissolved humic substances. Eur. J. Soil Sci. 50 (4), 687-692.
Piccolo, A., Conte, P., Cozzolino, A., 2001. Chromatographic and spectrophotometric properties of dissolved humic substances compared with macromolecular polymers. Soil Sci. 166 (3), 174-185.
Piccolo, A., Conte, P., Trivellone, E., Van Lagen, B., 2002. Reduced heterogeneity of a lignite humic acid by preparative HPSEC following interaction with an organic acid. Characterization of size-separates by Pyr-GC-MS and H-1-NMR spectroscopy. Environ. Sci. Technol. 36 (1), 76-84.
Piccolo, A., Spiteller, M., 2003. Electrospray ionization mass spectrometry of terrestrial humic substances and their size fractions. Anal. Bioanal. Chem. 377 (6), 1047-1059.
Plancque, G., Amekraz, B., Moulin, V., Toulhoat, P., Moulin, C., 2001. Molecular structure of fulvic acids by electrospray with quadrupole time-of-flight mass spectrometry. Rapid Commun. Mass Spectrom. 15 (10), 827-835.
Plancque, G., Maurice, Y., Moulin, V., Toulhoat, P., Moulin, C., 2005. On the use of spectroscopic techniques for interaction studies, part I: Complexation between europium and small organic ligands. Appl. Spectrosc. 59 (4), 432-441.
Pourret, O., Gruau, G., Dia, A., Davranche, M., Molenat, J., 2010. Colloidal control on the
Reiller, P., Amekraz, B., Moulin, C., 2006. Sorption of Aldrich humic acid onto hematite: Insights into fractionation phenomena by electrospray ionization with quadrupole time-of-flight mass spectrometry. Environ. Sci. Technol. 40 (7), 2235-2241.
Reiller, P.E., Brevet, J., 2010. Bi-exponential decay of Eu(III) complexed by Suwannee River humic substances: Spectroscopic evidence of two different excited species. Spectrochim. Acta A 75 (2), 629-636.
Richardson, F.S., 1982. Terbium(III) and europium(III) ions as luminescent probes and stains for biomolecular systems. Chem. Rev. 82 (5), 541-552.
Santschi, P.H., Roberts, K.A., Guo, L.D., 2002. Organic nature of colloidal actinides transported in surface water environments. Environ. Sci. Technol. 36 (17), 3711-3719.
Schlautman, M.A., Morgan, J.J., 1994. Adsorption of aquatic humic substances on colloidal-size aluminum oxide particles: Influence of solution chemistry. Geochim. Cosmochim. Acta 58 (20), 4293-4303.
Schulthess, C.P., McCarthy, J.F., 1990. Competitive adsorption of aqueous carbonic and acetic acids by an aluminium oxide. Soil Sci. Soc. Am. J. 54 (3), 688-694.
Shin, H.S., Choppin, G.R., 1999. A study of Eu(III)-humate complexation using Eu(III) luminescence spectroscopy. Radiochim. Acta 86 (3-4), 167-174.
Spaccini, R., Zena, A., Igwe, C.A., Mbagwu, J.S.C., Piccolo, A., 2001. Carbohydrates in water-stable aggregates and particle size fractions of forested and cultivated soils in two contrasting tropical ecosystems. Biogeochemistry 53 (1), 1-22.
Spaccini, R., Mbagwu, J.S.C., Conte, P., Piccolo, A., 2006. Changes of humic substances characteristics from forested to cultivated soils in Ethiopia. Geoderma 132 (1-2), 9-19.
Supkowski, R.M., Horrocks, W.D., Jr., 2002. On the determination of the number of water molecules, q, coordinated to europium(III) ions in solution from luminescence decay lifetimes. Inorg. Chim. Acta 340, 44-48.
These, A., Winkler, M., Thomas, C., Reemtsma, T., 2004. Determination of molecular formulas and structural regularities of low molecular weight fulvic acids by size-exclusion
chromatography with electrospray ionization quadrupole time-of-flight mass spectrometry. Rapid Commun. Mass Spectrom. 18 (16), 1777-1786.
Thomason, J.W., Susetyo, W., Carreira, L.A., 1996. Fluorescence studies of metal humic complexes with the use of lanthanide ion probe spectroscopy. Appl. Spectrosc. 50 (3), 401-408.
Tombácz, E., Rice, J.A., Ren, S.Z., 1997. Fractal structure of polydisperse humic acid particles in solution studied by scattering methods. ACH-Models Chem. 134 (6), 877-888.
Turro, N.J., 1991. Modern molecular photochemistry. University Science Books, Sausalito, CA, USA.
Vermeer, A.W.P., McCulloch, J.K., van Riemsdijk, W.H., Koopal, L.K., 1999. Metal ion adsorption to complexes of humic acid and metal oxides: Deviation from the additivity rule. Environ. Sci. Technol. 33 (21), 3892-3897.
Weng, L.P., van Riemsdijk, W.H., Koopal, L.K., Hiemstra, T., 2006. Adsorption of humic substances on goethite: Comparison between humic acids and fulvic acids. Environ. Sci. Technol. 40 (24), 7494-7500.
Weng, L.P., van Riemsdijk, W.H., Hiemstra, T., 2008. Cu2+ and Ca2+ adsorption to goethite in the
Yamamoto, Y., Takahashi, Y., Shimizu, H., 2005. Systematics of stability constants of fulvate complexes with rare earth ions. Chem. Lett. 34 (6), 880-881.
Yeh, M.F., Riedener, T., Bray, K.L., Clark, S.B., 2000. A spectroscopic investigation of
temperature effects on solution complexation in the Eu3+-acetate system. J. Alloys Comp. 303,
37-41.
Supporting Information Available.
The HPSEC profile of the Ginchi HA; the proportion in weight and cumulated percentage of
the ten HPSEC size-fractions; the 5D0→7F0 transition, fit and residuals, with one component for
Eu(III)-Ginchi AH complexes; the normalized spectra of Eu(III) complexed by the different size-fractions; The time-resolved luminescence spectra as a function of delay time of Eu-GHA complex; the fitting and correlation matrices of the luminescence decays of Eu(III) complexed by the GHA bulk and size-fractions.