HAL Id: tel-03215958
https://tel.archives-ouvertes.fr/tel-03215958
Submitted on 3 May 2021
HAL is a multi-disciplinary open access
archive for the deposit and dissemination of sci-entific research documents, whether they are pub-lished or not. The documents may come from teaching and research institutions in France or abroad, or from public or private research centers.
L’archive ouverte pluridisciplinaire HAL, est destinée au dépôt et à la diffusion de documents scientifiques de niveau recherche, publiés ou non, émanant des établissements d’enseignement et de recherche français ou étrangers, des laboratoires publics ou privés.
Diodes and optical glasses
Timothe Allanche
To cite this version:
Timothe Allanche. Effect of high radiation doses (MGy) on light Emitting Diodes and optical glasses. Optics [physics.optics]. Université de Lyon, 2020. English. �NNT : 2020LYSES039�. �tel-03215958�
N°d’ordre NNT : 2020LYSES039
THESE de DOCTORAT DE L’UNIVERSITE DE LYON
opérée au sein du
Laboratoire Hubert Curien
Ecole Doctorale
N° 488
(SCIENCES, INGÉNIERIE, SANTÉ)
Spécialité / discipline de doctorat
:Optique-photonique
Soutenue publiquement le 09/11/2020, par :
Timothé ALLANCHE
Effect of high radiation doses (MGy) on Light
Emitting Diodes and optical glasses
Devant le jury composé de :
Paillet, Philippe Directeur de recherche CEA DAM Président Bouazaoui ,Mohamed Professeur Univ Lille, PhLAM Rapporteur Van Uffelen, Marco, Dr, Expert F4E Rapporteur Rizzolo, Serena Dr, Ingénieur R&D Airbus Toulouse Examinatrice Virmontois, Cedric Expert CNES Examinateur Beaumel, Matthieu Expert SODERN Examinateur Ouerdane, Youcef Professeur UJM, LabHC Directeur de thèse Clerc, Raphaël Professeur UJM, LabHc Co-directeur de thèse Boukenter, Aziz Professeur UJM, LabHc Invité
Table of Contents
Table of Contents ... i
Glossary ... v
Introduction 1 Chapter A. Project’s framework 4 A.1 Project description ... 4
A.2 CAMRAD organization... 7
A.3 State of the art ... 7
Conclusion Chapter A ... 9
Chapter B. LEDs selection for the illumination system 10 Project requirement for the illumination system ... 11
B.1. LEDs basics ... 13 Colored LEDs ... 14 B.1.1. White LEDs ... 15 B.1.2. Power supply ... 17 B.1.3. Temperature ... 18 B.1.4. Efficiency droop and ABC model ... 20
B.1.5. Emission angle ... 24
B.1.6. Radiation effect on LEDs ... 25
B.1.7. Conclusion Section B.1 ... 31
B.2. Materials and methods for LED characterization ... 32
Gamma irradiation (color & white LEDs) ... 32
B.2.1. X-ray irradiation (White LEDs) ... 33
B.2.2. Flux measurement with an integrating sphere ... 34
B.2.3. Angular luminous intensity measurement by goniometer ... 37
B.2.4. Setup for LED online characterization under X-rays ... 38
B.2.5. Conclusion Section B.2 ... 40
B.3. LEDs results ... 41
Spectral measurements after the first (2017) gamma irradiation ... 41
B.3.1. B.3.1.1 RGB LEDs 42 B.3.1.2 White LEDs 44 Spectral measurements after the second gamma irradiation run (2018) and B.3.2. comparison with X-ray measurement ... 45
Analysis of the impact of gamma irradiation using the ABC model ... 47
B.3.3. Angular luminous intensity results ... 50
B.3.4. Online measurement results under X-rays ... 53
B.3.5. Conclusion Section B.3 ... 59
C.1. Basic properties of optical systems in absence of radiations ... 62 Chromatic aberration ... 62 C.1.1.
Abbe number and chromatic correction ... 63 C.1.2.
Radiation effects on optical glasses ... 65 C.1.3.
C.1.3.1 Radiation Induced Attenuation (RIA) 67
C.1.3.2 Radiation Induced Emission (RIE) 68
C.1.3.3 Radiation Induced Refractive Index Change (RIRIC) 69
C.1.3.4 Consequences for CAMRAD 72
Available radiation hardened commercial glasses and attenuation related to C.1.4.
some dopants... 75
C.1.4.1 SCHOTT radiation hardened glasses 75
C.1.4.2 Attenuation related to Silica defects 76
E‘ defect 77
NBOH Center 77
C.1.4.3 Attenuation in borosilicate 78
C.1.4.4 Attenuation related to sodium 82
Reduction of RIA by Cerium doping ... 84 C.1.5.
C.1.5.1 Cerium atom and spectroscopy 84
C.1.5.2 Type of defects inhibited by Cerium 89
C.1.5.3 Effect of Cerium concentration 90
C.1.5.4 RIA of Cerium doped commercial glasses after gamma irradiation 94 C.1.5.5 Limitation of Cerium hardening against radiation effects 99 Conclusion Section C.1 ... 100 C.2. Materials and methods for measurement on glasses ... 101 Samples preparation and description ... 101 C.2.1. Irradiation conditions ... 102 C.2.2. Refractometer ... 103 C.2.3. Spectrophotometry ... 104 C.2.4.
Online RIA in glass measurement set-up ... 105 C.2.5.
C.2.5.1 Description 105
C.2.5.2 Temperature management 106
C.2.5.3 X-Ray penetration depth and dose 108
C.2.5.4 Validation of the RIA measurement 109
C.2.5.5 Effect of radiation on the set up 110
C.2.5.6 Effect of the probing light on the RIA 112
C.2.5.7 Gamma irradiation responses and comparison with the X-Rays 113
C.2.5.8 Limitations & possible improvements 114
Conclusion Section C.2 ... 115 C.3. Radiation responses of optical glasses ... 116 Radiation-induced refractive-index change results ... 116 C.3.1.
Online RIA of radiation hardened glasses up to 1 MGy and its dose rate & C.3.2.
temperature dependence ... 118
C.3.2.1 BK7G18 120
C.3.2.3 K5G20 124
C.3.2.4 LaK9G15 126
C.3.2.5 LF5G19 128
C.3.2.6 SF6G05 130
C.3.2.7 Summary of online measurements 132
Comparison between radiation hardened glasses and standard ones ... 133 C.3.3.
Standard glasses at high doses ... 136 C.3.4.
Conclusion Section C.3 ... 144
Main conclusion and Perspectives 145
Appendix A. Redrawn graphics 139
Appendix B. List of LED references 142
Appendix C. Roentgens to Gray relation 143
References 144
List of related papers and communication 153
Glossary
ANDRA French National Agency for Radioactive Waste
Management Agence Nationale pour la gestion des Déchets RAdioactifs
CEA French Alternative Energies and Atomic Energy
Commission
Commissariat à l‘énergie atomique et aux énergies alternatives
CFL Compact Fluorescent Lamp
CID Charge Injection Devices
CIGEO Industrial Centre for Geological Disposal
Centre industriel de stockage géologique
CIS CMOS Image Sensors
CMOS Complementary Metal Oxide Semiconductor
COTS Components Off The Shelf
EDF Electricity of France
Électricité de France
EQE Eternal Quantum Efficiency
ESA European Space Agency
GaAs Gallium arsenide
GaN Gallium nitride
Gy Gray:
⁄ , 1 Gy = 100 rad
IR Infrared
IRMA IRradiation of MAterials is a panoramic irradiation cell for
studying how materials or equipment react to the effects of dose and dose rate due to exposure to gamma radiation
IRradiation de MAtériaux
IRSN Radioprotection and Nuclear Safety Institute
Institut de radioprotection et de sûreté nucléaire ISAE- SUPAERO National Higher French Institute of Aeronautics and
Space
Institut Supérieur de l‘Aéronautique et de l‘Espace
ITER International Thermonuclear Experimental Reactor
LabHC Laboratoire Hubert-Curien (Saint-Etienne, France)
LFL Linear Fluorescent Lamp
LMJ Laser Megajoule
Online measurement Used for measurement performed during the irradiation (and optionally during the recovery) contrast to Post-Mortem measurement
OS Optical System
PIA Investment program for the future
Programme d‘investissement d‘avenir After irradiation
measurement
Used for measurement performed after the end of irradiation in contrast to Online measurement
RadHard Radiation hardened
Recovery Refer to the time after the end of the irradiation during which a part of the radiation effects disappear
RGB Red, Green and Blue
RIA Radiation Induced Attenuation
RIE Radiation Induced Emission
RIRIC Radiation Induced Refractive Index Change
Standard glasses Refer to a glass that is not designed to be radiation hardened
TID Total Ionizing Dose
UJM Jean Monnet University (Saint-Etienne, France)
/Université Jean Monnet
Introduction
This PhD work was carried out as part of the CAMRAD project funded by the French-PIA (Programme d’investissement d’avenir). It is a collaborative work involving several partners such as: ANDRA, CEA DAM, ISAE SUPAERO, IRSN, Optsys, Orano and the Laboratoire Hubert-Curien. The objective is to develop a HD color camera able to withstand at least a cumulative irradiation dose of 1 MGy and to become a commercial product (manufactured by Optsys). Thanks to its capacity to tolerate a total dose ten times higher than other existing radiation hardened cameras it will fit the need of the geological storage of nuclear waste (CIGEO managed by Andra) and the ones of customers that deal with high irradiation doses. The work will focus on the effect of radiation on commercial Light Emitting Diodes and optical glasses.
After a review of the radiation hardened camera market and some CAMRAD project specifications, we will remind LEDs basics and their responses in gamma-ray environment. I carried out both after irradiation and online experiments. Thanks to the after irradiation analysis, we measured the optical power evolution, spectral and angular luminous intensity after gamma and X-ray irradiations. The online ones were carried out to highlight the temperature influence as well as the potential transient radiation effects on the LEDs operation. In addition, these different irradiation types allow us to compare X-rays and gamma ray effects on LEDs at the MGy dose level.
The third chapter addresses the radiation effects on optical glasses for the optical system. After a reminder on the materials optical responses as well as their combination to design an optical system, I presented some optically active defects generated in a radiative environment and which are harmful for our application. I have paid particular attention to the optical responses of several hardened glasses manufactured by Schott. This highlights the positive effect of Ce-doping via the darkening reduction level of the studied materials during the irradiation. The last two sections focus on the description and the validation the optical set-up we developed to measure the spectral darkening of glasses during the irradiation. We performed online measurement on both Cerium doped materials and on their standard counterparts. In the end we showed that well-chosen standard glasses can be equivalent or better than ―radiation hardened glasses‖ in radiation environments.
Introduction
Le travail présenté dans cette thèse de doctorat a été effectué dans le cadre du projet CAMRAD financé par PIA (Programme d’investissement d’avenir) pour lequel ANDRA, CEA DAM, ISAE SUPAERO, IRSN, Optsys, Orano et le Laboratoire Hubert-Curien ont collaboré. Son objectif est le développement d‘une caméra HD couleurs gardant ses performances jusqu‘à une dose cumulée minimum de 1 MGy. Cette caméra deviendra un produit commercial fabriqué et vendu par Optsys. Grâce à sa résistance à une dose dix fois supérieure aux autres caméras du marché, elle conviendra notamment aux besoins particuliers liés au stockage géologique profond (Projet CIGEO) et aux projets faisant face à la question des hautes doses. Les recherches menées étudient les effets des radiations sur des LEDs et les verres optiques.
Après une étude du marché des caméras résistantes aux radiations et une description du projet CAMRAD, nous rappelons quelques connaissances de base sur les LEDs et leurs comportements sous rayonnement gamma. J‘ai réalisé des mesures pendant et post-irradiation : les post-irradiations pour déterminer les modifications spectrales de puissances et de direction d‘émission causées par les rayons-X et gamma ; et les mesures pendant les irradiations pour quantifier les modifications de température et les potentiels effets transitoires pouvant affecter le fonctionnement des LEDs. Ces différentes expériences nous ont permis de comparer les effets des rayonnements gamma et X sur les puissances émises et les cônes d‘émissions après 1 MGy.
Le troisième chapitre est dédié à nos travaux sur les verres optiques. Après des rappels sur la combinaison des verres pour la conception de systèmes optiques, je présente certains défauts optiques causés par les radiations pouvant affecter notre application. J‘ai concentré mes travaux sur les verres dits « durcis » fabriqués par SCHOTT pour mettre en avant leur résistance aux radiations. Nous détaillons les mécanismes qui permettent à ces verres de moins se noircir sous radiation grâce à leur dopage au Cérium. Les deux dernières parties se concentrent sur le montage optique que nous avons conçu pour mesurer le noircissement des verres pendant l‘irradiation et les mesures réalisées sur les verres durcis et leurs équivalents standards. Enfin nous
montrons que la transmission de certains verres standards est équivalente ou meilleure en milieux radiatifs que celle des verres dit « durcis ».
Chapter A. Project’s framework
A.1 Project description
In France, 25 nuclear plants are currently being in dismantling including power and reseach reactors, 16 belonging to the CEA (French Alternative Energies and Atomic
Energy Commission / Commissariat à l’énergie atomique et aux énergies alternatives)
and 9 to EDF (Electricity of France / Electricité de France) [1]. At the end of 2017 in Europe there were 46 nuclear power plants in dismantling or decontamination [2] and in the future more will follow at least in France as its Government decided to decrease the part of the nuclear in the energy mix [3]. Between 2022 and 2030 the CIGEO (Industrial
Centre for Geological Disposal / Centre industriel de stockage géologique) project should
receive its first nuclear wastes [4]. These activities and others (such as nuclear safety) require the use of radiation resistant imaging systems and sensors to monitor the radioactive wastes, remote handling operations such in ITER [5],[6], to inspect reactors, plants or laboratories and to control robots. Tube based cameras currently offer the highest radiation hardness but are fragile, bulky and limited in terms of performances and image resolution [7]. Other types of sensors as CID (Charge Injection Devices) or CMOS (Complementary Metal Oxide Semiconductor), CIS (CMOS Image Sensors), are limited to a maximum TID (Total Ionizing Dose) of 100 kGy(SiO2) when no shielding and no
thermal annealing techniques are used to extend their lifetimes. Fig. 1 illustrates one of the radiation effects on the image quality. More images illustrating the various possible failures of COTS (Components Off The Shelf) cameras under radiation can be found in [8].
CAMRAD is a mixed project between academics and industrialists aiming to define a prototype of a camera resistant to severe environments that will then be manufactured at a larger scale by Optsys [10], with the ambition to lower the prices compared to existing radiation tolerant products. Therefore we had to adapt our strategie and choices to fit this context. The CIS is the only part of the camera that will not be COTS, it is developed by the ISAE- SUPARERO (National Higher French Institute of
Aeronautics and Space / Institut Supérieur de l’Aéronautique et de l’Espace). By using
radiation hardening techniques at the device and system levels, they greatly enhance the capacity of CIS to withstand high doses, up to several MegaGray (MGy). A preliminary design of the CAMRAD camera is presented in Fig. 2 with its synoptic diagram in Fig. 3.
As it will be more developed in this PhD thesis, there is a tremendous lack of data about radiation effects on LEDs and optical glasses at relatively high irradiation dose levels (MGy). So, an important part of the work was to select and characterize LEDs and glass materials especially their optical responses at high doses and ensure that their performances fulfill the target dose levels.
Fig. 2: CAMRAD camera prototype preliminary design made by Optsys.
Illumination System
Camera On-a-Chip Optical System
Fig. 3: CAMRAD camera prototype synoptic diagram.
CAMRAD‘s goal is to develop a CIS-based camera autonomous in terms of light sources and able to sustain at least 1 MGy(SiO2) dose of ionizing radiation. Moreover
this project will extend the knowledge on radiation effects over all the camera‘s components to higher dose levels with publications in the open literature [11], [12], [7], [13], presentations and posters in conferences (DEM, ANIMMA, RADECS, NSREC and IISW see references flowed by ҉ in the list of related conferences), one patent [14] and two PhD thesis (this one and [15]). Ultimately, the final camera prototype will be evaluated at the IRMA (IRradiation of MAterials / IRradiation de MAtériaux) [16] irradiation facility (Fig. 4) of IRSN (Radioprotection and Nuclear Safety Institute / Institut
de Radioprotection et de Sûreté Nucléaire). This final test has been designed as a
worst-case scenario compared to the real conditions encountered for example by Orano company.
Fig. 4: IRMA irradiation room. Figure adapted from [17].
For the final test, at IRMA, the camera will be positioned, in active mode, close to the
60Co source without any shielding. It will operate for nearly two weeks until all the 60Co source
camera‘s head (red rectangle of Fig. 3) will be exposed to 1 MGy dose of gamma irradiation. At this position, the expected maximum dose rate will be close to 3 kGy/h (or 0.8 Gy/s). The radiation tolerant electro-optic conversion will be located further from the source and exposed to an accumulated dose limited to around 1 kGy. The experimental run will be performed at room temperature with online image acquisitions. After the test, images will be analyzed to determine the color rendering and contrast variation as a function of the dose.
A.2 CAMRAD organization
CAMRAD organization is described in Fig. 5. Work packages were shared between the different institutions of the consortium. This PhD work focuses on both the illumination system and the optical materiel exploration while another PhD student, Cyprien Muller, mainly worked on the photometry budget simulation and the optical system design [15].
Fig. 5: CAMRAD project organization overview. The red square highlights the work packages on which this PhD focuses.
A.3 State of the art
Table 1 reviews the major brands selling cameras adapted for radiation environments and pointed out, for each company, the characteristics of their products. We chose to
select for each company the reference that presents the highest radiation tolerance and is using an electronic image sensor. Products from the major radiation camera suppliers are reported while Dekra products are not listed as the datasheet of their best reference (VT XLRAD-10PTZ) in term of total dose is unclear on the maximal dose. Public data are not exhaustive and do not show cameras performances close to their maximal TID. To the best of our knowledge there is no public demonstration of a camera‘s capacity to really sustain 1 MGy dose, manufacturers demand to the buyer an act of faith. The only public demonstration we found was realized by Thermo Scientific [18] up to 10 kGy.
Table 1: Radiation resistant camera available on the market information are based on camera makers’ datasheets. Mirion technologies Thermo Scientific Ermes-electronics Ahlberg
cameras Diakont CAMRAD
Product Hyperion CID8825D Viza Z160 Proton CAMERA protype Radiation Tolerance 1 MGy 3×10⁻² MGy 0.5MGy without shielding
0.2 MGy 2×10⁻³ MGy >1 MGy
Radiation
Dose Rate 1 kGy/h 2.8 kGy Unknown 10 kGy/h 50 Gy/h 1 kGy/h
Resolution 960*540 710x484 1280*960 720x1280 progressiv e scan 1080p 720p Image sensor solid-state 1 megapixel sensor Charge Injection Device
CMOS Unknown CMOS CMOS
Color No Yes Yes Yes Yes Yes
Public
Fig. 6: CID8825D camera response by Thermo Scientific before and under gamma irradiation (60Co) at 10 kGy. Figure adapted from [18].
The only camera that claim to resist to 1 MGy without thermal annealing is the Mirion Tech one whose weight is 23.5 kg (that is probably due to a shielding) and Mirion Tech did not published a test report.
All the performances of the cameras which exist on the market are below that aimed in this CAMRAD project
Conclusion Chapter A
The ―radiation hardened camera‖ market is heterogeneous. These cameras really differ in terms of radiation resistance and image quality. There is nearly no information in open literature to confirm the datasheets information. While in a near future, there will be more and more nuclear plants that will need to be dismantled and a lot of nuclear waste to inspect. For these operations, cameras able to sustain high doses and dose rates will be required as the one developed during our CAMRAD project. In addition to providing an industrial camera with the best performances on the market, with the publication of our results, CAMRAD will help the community to move forward.
Chapter B. LEDs selection for the illumination
system
CAMRAD camera must be able to operate autonomously in an extreme environment comprising radiations and eventually in complete darkness. So, it is necessary to include an illumination system powerful enough to acquire images using low integration times (to reduce the image radiation induced degradation). The study of radiation effects on LEDs, carried out within the framework of CAMRAD, aimed to provide a database of usable commercial LEDs with the necessary information for both photometric calculations and the design of the illumination system for our targeted application. Two examples of these calculations can be found in [12] and [19], this part of the project will be discussed in details in Cyprien Muller‘s the PhD thesis [15].
Since the beginning of the project, LED technology had been considered as the most promising solution for the building block of the illumination system. There are several reasons for this choice: their easy integration thanks to their small size and volume, their luminance efficiency, their reduced cost and, of course, their already reported good resistance to ionizing radiations such as gamma-rays at moderate dose levels. As it will be developed later in this chapter, the LEDs are indeed intrinsically quite resistant to energetic radiations and their responses are marginally affected by -rays.
In order to respond to the different configurations suggested during the CAMRAD project, we tested both RGB and white LEDs. We were interested in the modification of the three following LEDs parameters:
- The emitted light power, and its evolution versus irradiation dose (whether after irradiation or during the irradiation runs).
- The spectrum shape.
- The LED emission cones (LED intensity diagram).
This chapter provides the necessary information to address the emission properties of white and colored LEDs. After that, the literature regarding the impact of radiation, and in particular gamma rays, will be discussed. Finally, it describes the
selected characterization methods used, the obtained results and outcomes for CAMRAD.
Project requirement for the illumination system
As it will be developed in Chapter C, the transmission of glass lenses will decrease under irradiation. Indeed, even with a set of the most adequate glasses, the optical system without anti-reflection coating will feature non-negligible losses, close to 3 dB @ 800 nm [12]. However, the major constraint is associated with the CIS which should be used at low integration time (between 1 and 3 ms) to keep at reasonable levels both the dark current [9] [20] [21] (see Fig. 7) and the photo-induced current [22] [23] (see Fig. 8).
Fig. 7: Evolution of the dark current as a function of the integration time: before and after gamma irradiation (at a cumulated dose of 1 MGy) in a RadHard CMOS with a full capacity of 105 electrons. Figure adapted
from [12]1.
1
Appendix A details the different notations “Redrawn from”, “Adapted from”, “Created from”
and presents an example for each case.
100 101 102 103 104
102 103 104 105
10 % of the full pixel capacity
1 MGy 0 MGy
Dark c
urrent
(
el
ec
tron
s)
Integration time (ms)
Fig. 8: Photo-induced current in a CMV2000 image sensor (CMOS) exposed to radiations at different dose rates (60Co). Images recorded at the very beginning of the irradiation run with an integration time of 20 ms.
Images are 1/3 of the sensor. Figure adapted from [24].
A mock-up, reported in Fig. 9, was developed to highlight the effects of camera‘s aperture, the field of view, the light power and especially the integration time on the image brightness. We used a camera with a tunable integration time, objects with different albedos (proportion of reflected light) and one LED with an output power of 1.1 W / 93.9 lm (object distance and camera‘s aperture are the same as for the final camera test). We kept all parameters constant and we have varied the integration time (which is equivalent to the exposure time in photography). When the integration time is doubled the sensor will receive two times more photons for one image. It is nearly equivalent to double the quantity of light on the scene.
Fig. 9: Mock-up of the CAMRAD final test at 1:1 ratio. The image on the top is a picture of the room only enlighted by the one LED. Images below are camera pictures made with the same aperture than the final camera at different integration times. The scene is at ≈1.5 m from the first optical lens. The used LED is a XPEBWT with an output power of 1.1 W or 93.9 lm.
Fig. 9 shows that for a camera – with the same opical parameters as the ones expected for CAMRAD final test, and even in the case where the scene seems well enlightened (Fig. 9 room) – integration time around a hundred ms is required to obtain an image. Of course it is possible to increase the gain (ISO in photography) to obtain a
brighter picture, but it will also increase the noise. Another possibility is not to use all the sensor dynamics and scale it on the display/screen. Nevertheless, the photometric calculations were made in the hypothesis that the illumination system will be able to entirely fill the sensor pixels without additional gain. So in Fig. 9 we have chosen not to modify the gain and to use all the sensor dynamics to highlight the effect of the integration time. However, this remains useful to adapt the image display during the operating time where other parameters could vary such as the illumination.
Considering all camera parameters and an exposure time of 1 ms, we should use a power of around 90 W for the scene lighting [15]. Consequently, we will study the responses of LEDs with more than one thousand lumen flux.
B.1.
LEDs basics
The mechanism of light emission significantly differs between the LEDs (electroluminescence in a solid-state semiconductor material) and the more conventional light sources such as halogen lamps (incandescent lamp, black body radiation), or discharge lamps (LFL (Linear Fluorescent Lamp), CFL (Compact Fluorescent Lamp) …). As shown in Fig. 10, LED is composed of a P-N junction obtained by doping a III-V semiconductor crystal, the P zone is an electron acceptor (therefore in excess of holes) while the N zone is an electron donor (therefore in excess of electrons). The light is emitted by radiative recombination of a hole-electron pair, when the device is biased in direct, in the central area, called the depletion zone, where the carriers will be able to meet and recombine.
Fig. 10: Diagram for a P-N junction for a LED. Figure redrawn from [25].
désertion
P type electrode P type semiconductor
N type semiconductor
N type electrode Depletion zone
For the emission, the LED must be polarized directly to its operating voltage (this concept will be discussed in the section B.1.3) and the process is controlled by the injected current level. This current is driven by the free carriers in motion (electrons in the N-zone and holes in the P zone). To return to a state closer to equilibrium, recombination of excess holes and electrons will spontaneously occur. In the case of LEDs, the materials and their arrangement in layers have been designed to promote radiative recombination, to the detriment of other non-radiative recombination (such as trap assisted recombination and Auger recombination [26], discussed in the section B.1.5). This is achieved by using direct gap materials (where radiative recombination is favored), and by judiciously introducing electron barriers and multiple quantum wells to promote radiative transitions.
Colored LEDs
B.1.1.
LED is essentially a quasi-monochromatic light source, the emission wavelength depends on the energy gap value of the material where the emission takes place. In order to obtain polychromatic sources, it is therefore necessary to precisely adjust the gap value, which is achieved by changing the composition of the emission material. There are two main families: the family commonly named GaN (Gallium nitride), where the emission occurs in an InXGa1-XN heterostructure sandwiched with GaN, and a family
commonly named GaAs, where the emission occurs in a (AlXGa1-X)0.52In0.48P
heterostructure sandwiched with GaAs. The first GaN family allows an emission from blue to amber, while the second GaAs from amber to infrared. There is also a third family for ultraviolet emission. Some examples are given in Table 2.
Table 2: Semiconductor associated to LEDs colors. Table from [25].
Color Emission peak (nm) Structure
Red 660 GaAlAs/GaAlAs
Yellow 585 GaAsP/GaP
Green 555 GaP/GaP
Blue 430 GaN/SiC
Spectral bandwidth of LEDs spectrum is driven by the thermal agitation that causes dispersion centered in the band gap value. The full width at half maximum stays within [20 - 80] nm range [25].
White LEDs
B.1.2.
LEDs do not directly emit white light. To design a white source using LEDs, a first approach, leading to the best efficiency in lm/W, consists in combining several monochromatic LEDs (the simplest set being RGB (Red, Green and Blue) LEDs). However, this solution is also the most expensive and raises several issues. First, it is necessary to use an optical system to mix the emissions of the different LEDs, second, it is necessary to manage the drifts of the characteristics of each LED with heating and ageing, in order to maintain the same ―white‖ color.
The second and more common approach, consists in depositing a fluorescent material (as in Compact Fluorescent CFL lamps), commonly called ―phosphor‖ (phosphor-converted white LED), such as for instance Cerium-doped Yttrium Aluminum Garnet (Ce3+:YAG). This material converts high energy photons (blue in practice, but also UV (Ultraviolet) in some cases) into lower energy photons (by fluorescence). Since this conversion is not ideal (because of heat loss from the Stokes shift), some blue photons are absorbed without being converted into photons of lower energy. Consequently, this solution degrades the quantum efficiency (emitted photons divided by injected electrons) of white LEDs compared to blue ones. The typical appearance of a white LED emission spectrum obtained by a phosphor conversion is reported in Fig. 11. One challenge is to decrease the size of the spectral gap between the blue LED and the converted light.
Fig. 11: Typical white LED spectrum by phosphorus conversion. Figure adapted from [25].
The spectrum emitted by fluorescence depends on the type of phosphor material, its thickness, its grain size distribution, and the shape given to the deposit. Of course, the composition of the phosphor and its deposition technique are manufacturer dependent. One of the issues penalizing the quality of the white light is the spectral gap (between 470 and 520 nm) between the emission spectrum of the blue LED and the fluorescence spectrum. Techniques based on UV LEDs to excite the fluorescence of phosphors have been suggested (that suppress the spectral gap in the visible range), but the low efficiency of UV LEDs remains an issue [25]. Examples of phosphor emission spectrum used in LED are given in Fig. 12 and examples of white LED spectrum are reported in Fig. 13. It is possible, by combining several phosphors, to create white LEDs with several emission peaks, adjusting color rendering, at the expense of a decrease in luminous efficiency (lm/W) and of a cost increase.
400 450 500 550 600 650 700 750 0.0 0.2 0.4 0.6 0.8 1.0
Norm
al
ize
d
en
ergy
Wavelength (nm)
Blue LED Phosphor Spectral gapFig. 12: Emission spectrum of phosphors. Figure adapted from [25].
Fig. 13: Examples of white LEDs emission spectrum, with different phosphors to optimize the color rendering depending on the application. Figure adapted from [25].
Power supply
B.1.3.
Most of LEDs operate with direct current (DC), there are also LEDs operating on alternating current, but their efficiency and life span are lower [25]. This PhD thesis presents only LEDs operating with direct current. Fig. 14 shows the classical I-V characteristic of a LED. 450 500 550 600 650 700 750 0.0 0.2 0.4 0.6 0.8 1.0
Norm
al
ize
d
in
te
ns
it
y
Wavelength (nm)
SrS:Ce SrS:Eu CaS:Eu CaS:Ce 400 500 600 700 800 0.0 0.2 0.4 0.6 0.8 1.0Norm
al
ize
d
in
te
ns
it
y
Wavelength (nm)
White (color rand: c) White (color rand: sw35) Warm White (color rand: e)
Fig. 14: Typical Current-Tension (I-V) diagram of a LED in linear regime. Figure adapted from [25].
This characteristic response can be divided in four zones:
- (1) From 0 to the threshold voltage (here approximately 1.6 V), nearly no current passes through the LED (it is in reverse regime),
- (2) Just above the threshold, the current appears: the LED I-V response is strongly non linear (exponential),
- (3) The third zone is characterized by a linear response which is the operation regime (probably due to series resistance),
- (4) At higher current, the LED would be damaged (not shown in Fig. 14). LEDs have to be driven in current (and not in voltage) because a small increase in applied voltage generates a large increase in current. As the threshold voltage varies with temperature (it decreases as the temperature increases), in the case of voltage control, the increase in temperature will generate a higher current supply than necessary and cause heating. This impacts the emission spectrum and can possibly damage the LED.
Temperature
B.1.4.
The emission spectrum, efficiency and lifetime of LEDs strongly depend on temperature. The impact of temperature slightly differs between LED technologies due to difference in used materials, in manufacturing processes, and thermal properties of the
0.0 0.5 1.0 1.5 2.0 2.5 0 100 200 300 400 500 (4) (3) (2)
Curr
en
t
(mA)
Voltage (V)
Real curve Ideal curve (1)LED packaging. This is one of the main differences between LEDs and other lighting sources, such as incandescent lamps for instance, that are relatively insensitive to temperature variations.
Fig. 15: Temperature effect on the LED light flux (reference temperature is 25°C). Figure adapted from [25].
The operating temperature of LED is not a priori know, since the LEDs heat up during operation. It also depends on their environment, particularly their packaging. It is sometimes necessary to thermally control – to cool – them to stabilize their performance. To have an idea of the LED internal temperature, it is mandatory to measure its junction temperature [27].
As far as the emission spectrum is concerned, an increase in temperature leads to a global shift of the spectrum toward higher wavelengths (―red shift‖) up to ten nanometers for amber LEDs (with a variation of the temperature junction from 25 to 125°C), which is mostly due to the decrease of semiconductor bandgap with temperature.
Regarding the efficiency, an increase in temperature will promote non-radiative recombination and joule effect, and will reduce the emitted light power, as shown in Fig. 15. This effect is more pronounced for low-power LEDs. The blue LEDs used as a "pump" for the white LEDs are among the ones that lose the least amount of flux with increasing temperature. -20 0 20 40 60 80 100 0.2 0.4 0.6 0.8 1.0 1.2 1.4 1.6
Norm
al
ize
d
fl
ux
Junction temperature (°C)
Amber WhiteA high temperature will also shorten the LEDs lifetime. However, the overall lifetime remains good compared to the lifetime of most lighting device (Fluorescent tubes typically are rated at about 10,000 to 25,000 hours, and incandescent light bulbs at 1,000 to 2,000 hours), even at high temperatures (above 100°C), as shown in Fig. 16.
Fig. 16 Lifetime and loss of luminous flux for different junction temperatures for CREE Inc. LEDs. Figure adapted from [25].
Efficiency droop and ABC model
B.1.5.
LEDs and especially InGaN blue emitting LEDs are known to be affected by the phenomena of ―efficiency droop,‖ i.e. a detrimental decrease of quantum efficiency at high injected current [28], observed mostly for GaN LED and attributed to Auger recombination [26]. The phenomenon of efficiency droop is visible since the efficiency (radiation flux divided by electrical power) tends to decrease when increasing the drive current. To clarify the notion of external quantum efficiency, we first have to define different LED figures of merits. Fig. 17 is used to illustrate them.
103 104 105 106 60 70 80 90 100 Norm al is ed f lu x (%) Lifetime (Hours) 45°C 75°C 105°C Active zone
(1)
(2)
(3)
(4)
(5)
N zone P zoneFig. 17: Illustration of the different steps between charge injection and the emitted photons
- The injection efficiency ( ) is the ratio between the number of electron reaching the LED‘s active zone per second by the total number of electron injected in the LED per second (current / e) → ⁄
- Radiative efficiency ( ). It is the ratio of radiative recombination by the total number of recombination within the LED‘s active zone during per second → ⁄
- Internal Quantum Efficiency: is the ratio between the number of radiative recombination by the number of charges per second → ⁄
(1)
- Extraction efficiency ( ): It is the ratio between the number of photons per second extracted and the number of photons generated per second →
⁄
- External Quantum Efficiency ( ): is the number of extracted photons per second by the number of injected electrons in the LED per second. → ⁄
(2)
As a consequence, results from a trade-off between charge injection, radiative recombination efficiency and light extraction. The is the quantity that can be measured with the flux measurement, see section B.2.3.
An example of efficiency droop from [29] is presented in Fig. 18. At low level of current, the efficiency increases with the current, then decreases at high level of current.
This effect is usually explained by the competition between several recombination mechanisms impacting the radiative efficiency: non-radiative recombination Shockley-Read-Hall (trap assisted), radiative recombination and Auger recombination.
Fig. 18: External quantum efficiency of commercial green LEDs @530 nm (Philips Lumileds’Luxeon line) as a function of operating current. Figure adapted from [29]
The Auger recombination is not the only effect that may cause non-radiative recombination and decrease the LED efficiency, there also is the non-radiative recombination Shockley-Read-Hall (trap assisted). The Fig. 19 illustrate the different types of recombinations.
Fig. 19: Band diagram illustrating recombination mechanism in LED: a) via Shockley-Read-Hall (trap assisted), b) via Auger process, c) radiative recombination. Figure adapted from [27].
A simple model can capture the impact of traps and Auger recombinations on the quantum efficiency. Indeed, the radiative efficiency (RE) is by definition equal to:
1 10 100 1000 0.02 0.04 0.06 0.08 0.10 0.12 0.14 0.16 0.18 0.20 EQE (%) Current (mA) Luxeon I LED EConduction EFermi ETrap EValence
≈
≈
a) b) c)∫
∫ ∫ ∫
Where Rtrap (resp. Rrad, Rauger) is the trap assisted (resp. radiative, auger)
recombination rate within the active layer of thickness W.
Replacing the recombination rates by their standard expressions, and assuming that the injected electron and holes concentrations are equal and uniform within the active layer (a reasonable assumption for quantum well LEDs), the internal quantum efficiency reduces to:
(3)
Where represent the Shockley-Read-Hall, the radiative recombination and the Auger coefficient. Finally, the current flowing through the LED can be expressed as:
(4)
Where depend on the LED dimensions (quantum well thickness and current section). Combining these two equations, it is possible to compute the vs current curves.
Fig. 20 shows a comparison from the literature between experimental data and the model. In this paper [30], the ABC model is used to analyze the impact of lateral recombinations on LEDs pixels of different sizes. Indeed, the ABC model has been modified to account for an hypothetical dependency of trap assisted recombination with the perimeter / area ratio, according to :.
(5)
Where is the perimeter of the LED and its surface. Model and experiments are in qualitative good agreement, even though less accurate for smaller pixel.
Fig. 20: External quantum efficiency versus current density for different LED sizes. Some difference are yet observable between measurement and simulation, due to the ABC model approximation on the LED current
modeling. Figure adapted from [30]
This model will be used in the section B.3.3 to give an understanding of the radiation effects in LEDs.
Emission angle
B.1.6.
In absence of additional optical elements or surface texturing, the light emission from a high refractive index medium to the air (planar diopter) follows a light intensity (cd or W/str) distribution of the Lambertian type, i.e.:
(6)
With the intensity in the normal direction to the LED and the angle between and as shown in Fig. 21. The half of the normalized intensity is obtained for a particular value of ( 1/2) given by:
(7)
For a Lambertian source, . Manufacturers often report, in their datasheet, 2 , (120° for a Lambertian source). The intensity I() indicates how the luminous flux is dispersed in the 2 solid angles of the half-space, it can often be
10-4 10-3 10-2 10-1 100 101 102 103 0.00 0.02 0.04 0.06 0.08 0.10 0.12 0.14 model 10m 50m 500m 10m 50m 500m EQE (a. u)
Current density (A/cm2)
interesting to concentrate this flux in a given direction, which can be done by means of a lens (often in silicone) placed on the top of the LED or by using a reflector.
Fig. 21: Normalized intensity diagram of a Lambertian source.
Radiation effect on LEDs
B.1.7.
The effects of radiation on LEDs have already been studied in the literature, particularly for low-dose space applications (a few tens of kGy) and mainly under ionizing particles [31] [32]. In addition, CERN is currently working on the effects of high proton flux on LEDs in order to optimize the lighting in its accelerator tunnels [33] [34]. It is admitted that the degradation of LEDs by irradiation is mainly due to atomic displacements caused by particles such as protons or neutrons [13], [16], [17]–[23]. Gamma radiation is mainly associated with ionization processes but can possibly cause rare atomic displacements by side effect (Compton electron). Johnston (who wrote two major reviews on radiation effect in optoelectronic devices [35] [36]) attributed LEDs degradation ―to displacement damage from Compton electrons produced by gamma rays, not ionization damage‖, [36] nevertheless many authors attributed a part of the degradation to ionization process. We will compare both hypothesis with our results. In the context of CAMRAD, we limited our study to gamma radiation effects and focused our attention on the articles dealing with this type of radiation.
It is known that LED technologies have greatly improved in past decades. So we decided to not review papers older than the ones quoted in the 2013 review [41]. In it two articles address gamma effects on LED, the first one [42] focused only on the electrical modifications of n-GaN LEDs irradiated at 0.21 MGy. The second one [43] studied the optical power loss of InGaN/GaN LEDs in the 410-510 nm spectral range irradiated up to
20 MGy. To the best of our knowledge, since 2013, just few studies have been published on the modification of the optical power emitted by high-dose gamma irradiated LEDs: one on 590 nm AlGaInP LEDs irradiated at 0.3 MGy [44], the second [45] on red LEDs for signal transfers and the last [33] on luminaire, which have a packaging that mainly explain their degradation. Main optical characteristics from these articles are reported in Table 3.
Table 3: Main characteristics of gamma irradiated LEDs in the literature
Fig. 22: Emission spectra evolution at different gamma ray (60Co) doses. The 410 nm (InGaN∕GaN) LED was biased during irradiation. Figure redrawn from [43].
390 395 400 405 410 415 420 0 20 40 60 80 100 In te ns it y (A.U.) Wavelength (nm) Pristine 1 MGy 2.5 MGy 5 MGy 7.5 MGy
Ref Type Spectral
range (nm) Maximum dose Power change (%) Year Silicon lens
[43] InGaN 410 to 510 7.5 MGy -80 2005 With and without
[44] AlGaInP 590 0.3 MGy - 35 2013 unknow
[45]
AlGaInP 575 1 MGy - 90 2016 with
AlGaInP 609 1 MGy - 80 2016 with
AlGaInP 635 1 MGy - 40 2016 with
[33] Cree XP-G white light (phosphors converting) 100 kGy -79 2016 Full illuminator packaging Cree XP-E white light (phosphors converting) 100 kGy -73 2016 Full illuminator packaging
All the LEDs from Table 3 present non-negligible losses. So, their intrinsic resistance to gamma radiation is not perfect at high doses. The loss of emission power is most often attributed to the creation of recombination centers that will cause non-radiative effects. An example, from [43], is reported in Fig. 22, showing the spectral flux degradation of a blue LED at 410 nm (without lenses) at different gamma radiation doses. Despite irradiation up to 7.5 MGy, the authors didn‘t find any visible degradation of the LED appearance. Fig. 23 shows the time dependency of the forward voltage before and after irradiation. The small voltage increase may be due to a higher number of traps in the p-side leading to a decrease of the hole concentration.
Fig. 23: LED’s voltage time evolution before and after irradiation (gamma). Figure adapted from [43].
The studied LED is a blue one, similar to that typically used in white LEDs to pump the phosphor materials. It should be noted that for radiation dose lower than 1 MGy, the degradation of the light flux remains limited, but can reach 80 % for the high dose of 7.5 MGy. In this paper, the LED was driven at a constant current: a decrease of the applied voltage and more importantly a significant instability over time were observed with radiation, even at low doses. This phenomenon was not discussed in the article, and no recovery phenomena was neither reported nor discussed.
An interesting conclusion from [44] is that if the LED is driven with high current, less degradation seems to occur. According to the authors, it is attributed to the operating current density. This effect is highlighted in Fig. 24.
0 1000 2000 3000 4000 3.1 3.2 3.3 3.4 3.5 5 MGy 2.5 MGy Pristine
Volt
ag
e
(V)
Time (s)
Fig. 24: Power variation @ 590 nm at different gamma doses for 2 currents. Figure redrawn from [44].
Authors analyzed their results as follows:
- First the degradation is driven by the conversion of the existing defects (precursors) into non-radiative centers. This effect saturates at a cumulative gamma dose of about 0.15 MGy,
- Then the degradation slows down and is driven by the creation of traps without precursors.
In Fig. 25, the power of the blue LED, reported in Fig. 22, has been plotted versus dose, illustrating this slowdown of the degradation.
Fig. 25: Output power evolution as a function of the dose for a blue LED. Figure created from [43].
0.0 0.1 0.2 0.3 0.4 0.5 0.6 0.7 0.8 0.9 1.0
Powe
r variat
io
n
Dose (MGy)
5 mA 50 mA 0.0 2.5 5.0 7.5 200 300 400 500 600 700 800 900 1000 1100 Output PowerOu
tp
ut
Pow
er (A.U.
)
Dose (MGy)
In a previous study [46] (founded by F4E), our consortium studied the effects of gamma radiation on white and amber LEDs of low and medium output powers (0.22 to 1.73 W before irradiation for white LEDs). The results can be summarized as follow.
First, by removing silicone lens before irradiation and comparing the same LED with and without its lens, the impact of irradiation on the output power was monitored. We showed that even if the transparent silicon lens turns to brownish color during the irradiation, the LED output power is higher with the lens than without (see Fig. 26). Consequently, it may not be mandatory to remove the LED‘s lens for its use in a harsh environment.
Fig. 26: Flux ratio between the same white LED with and without a silicon lens before and after gamma irradiation up to a cumulative dose of 1.1 MGy. Figure from [46].
Second, we showed that high-power LED (supplied with high DC electrical power) seems less impacted by radiation, in agreement with [44].
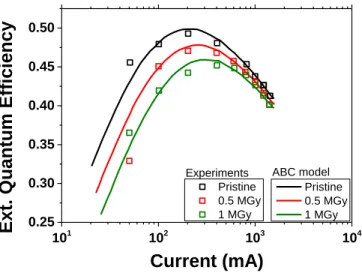
Third, we investigated the ―efficiency droop‖. This phenomenon consists in a penalizing decrease of quantum efficiency at high injected current [28] observed mostly for GaN LED, attributed to Auger recombination [26]. The phenomenon of efficiency droop is expected in all tested samples, since the efficiency (radiation flux divided by electrical power) tends to decrease when increasing the driving current. However, if the irradiation indeed decreases the output power, it does not significantly affect the slope of the efficiency versus current curve, suggesting that the efficiency droop remains
450 500 550 600 650 700 0.0 0.5 1.0 1.5 2.0 2.5
ratio
wi
th
SL
/ Wit
ho
ut
SL
Wavelength (nm)
Pre-Irr 1.1MGyunaltered [20]. Regarding AlInGaP amber devices (Fig. 27), an efficiency droop is observed in the unirradiated device, however, its amplitude is less pronounced than in InGaN white devices. In the literature, this phenomena is usually not observed for AlInGaP, except in [47], but only at low temperatures. Indeed, after irradiation, contrary to the case of InGaN (Fig. 28), the efficiency droop in AlInGaP amber devices almost disappears. One possible explanation for this unexpected observation is that recombination may be so enhanced by radiation that the level of electrons and holes concentrations required for Auger recombination to occur is no longer achieved, removing efficiency droop. The overall low efficiency level and strong impact of radiation on AlInGaP amber devices are in favor of this hypothesis.
Fig. 27: Impact of radiation on the “efficiency droops” (Efficiency=photons emitted/electrons injected) for amber LEDs. Amber 1 is an AlInGaP LED and Amber 2 is a InGaN one. Figure adapted from [46].
Fig. 28: Impact of radiation on the “efficiency droops” (Efficiency=photons emitted/electrons injected) for 2 different white LEDs (White 1 and White 4). Both LED are InGaN devices. Figure adapted from [46].
Finally, even if LEDs are considered to be intrinsically resistant to gamma radiation, which is true for some references, we also measured losses up to 58% @ 1.1 MGy for amber LEDs and up to 33% @ 1.1 MGy for white LEDs (our results are
0 100 200 300 0.0 0.1 0.2 0.3 0.4 a) Amber 1 Effi ci en cy Current (mA) Prisitne 1.1MGy 0 100 200 300 400 500 600 700 800 0.00 0.05 0.10 a) Amber 2 Effi ci en cy Current (mA) Prisitne 1.1MGy 0 200 400 600 800 1000 1200 0.3 0.4 0.5 0.6 0.7 0.8 Effi ci en cy Current (mA) Prisitne 1.1MGy a) White 1 0 100 200 300 400 0.3 0.4 0.5 0.6 0.7 0.8 b) White 4 Effi ci en cy Current (mA) Prisitne 1.1MGy
presented in Table 4). So it‘s still mandatory to test COTS LEDs before using them in a radiation-rich environment, as it is also the case for integrated circuit in general.
Table 4: Evolution of some LED output powers after 1.1 MGy, data from [46]
LED reference Amber 1 Amber 2 Amber 3 White 1 White 2 White 3 White 4 White 5 Power before irradiation (W) 0.07 0.12 0.46 1.73 0.33 0.22 0.39 0.51 Power after 1.1 MGy (W) 0.04 0.05 0.44 1.65 0.24 0.15 0.26 0.36 Change after 1.1 MGy (%) - 43 - 58 - 4 - 4 - 27 -32 - 33 - 29
Conclusion Section B.1
In this chapter, we explained how the constraints on the image sensor impact the requirements for the illumination set up for CAMRAD system (which was set to 90 W).
Then, we gathered LEDs basic knowledge to give the reader all the needed information to understand the two next chapters about LED characterization set up and results. In particular, it may be useful to keep in mind that LEDs output power decreases when the LEDs temperature increases.
Finally, we presented a literature review on the effect of gamma radiation on LEDs. LEDs are known to be intrinsically resistant to gamma radiation, so there are only a few papers dealing with it especially for commercial LED. Nevertheless, we can estimate that LEDs may lose more than half of their output power after 1 MGy. Hence, they have to be tested before being implemented in a radiation environment. Gamma radiation affects more the output power of the LEDs than their electrical responses. In the next chapter we will describe our protocol to measure this parameter on the selected CAMRAD LED references.
B.2.
Materials and methods for LED
characterization
Gamma irradiation (color & white LEDs)
B.2.1.
In the CAMRAD project, we had access to gamma irradiation campaigns (60Co) at IRMA [16] (IRSN, Saclay, France) the first at the end of 2017 and the second at the end of 2018. LEDs from Table 5 and Table 62 have been irradiated at three dose levels: 0.1, 0.5 and 1 MGy (the irradiation campaign was ≈2 weeks long). All LEDs were unbiased during the gamma irradiation runs by material constraint (we used X-ray to compare biased and unbiased cases)
Table 5: Product number of RGB and RGB White LEDs irradiated at the first IRMA campaign (2017), all data come from manufacturer specification sheets
2
The full reference of each LED is available in Appendix B.
Product
number Manufacturer Color
Nominal current (mA) Nominal voltage (V) Maximal optical power Dissipated power (W) RTDUW OSRAM Red Green Blue White 700 2.50 3.60 3.45 3.45 112 lm 180 lm 900 mW 224 lm N.C F50360 Seoul Semiconductor Inc Red Green Blue 350 2.0 ~ 3.0 3.0 ~ 4.2 3.0 ~ 4.1 35 lm 57 lm 13 lm 1.68 W Z power F50360R LS Seoul Semiconductor Inc Red Green Blue 800 2.3 3.25 3.25 48 lm 70 lm 22 lm 2.4 W 4.0 W 4.0 W SML LX1610 Lumex Red Green Blue 300 350 350 2.1 3.5 3.5 25 lm 25 lm 8.0 lm 3.5 W
Table 6: Product number of White LEDs irradiated at the first IRMA campaign (2017), all data come from specification sheets Product number Manufacturer Nominal current (mA) Nominal voltage (V) Optical Power (lm) CXA3590 CREE 1100 34 9 000 CXA2590 CREE 1200 36 7 945 MKRBWT CREE 400 36 870 MKRAWT CREE 1400 11.7 840 MCE4WT CREE 700 3.1 260 XMLAWT CREE 700 2.9 220 XPEBWT CREE 700 3.05 93.9 XPEWHT CREE 350 3.05 93 LHC1-3090 LUMILED 1200 36 3 750 SDW84F1C SEOUL SEMICONDUCTOR 700 35.6 3 000
After the first set of measurements which was not consistent with the literature (cf. B.3.1.1 & B.3.1.2), we performed new tests in the same conditions. Products numbers irradiated during the second campaign are listed in Table 7.
Table 7: Product number of White LEDs irradiated at the second IRMA campaign (2018).
Product number
LCH1 3090 MKRBWT SDW84FC MKRAWT XPEBWT
X-ray irradiation (White LEDs)
B.2.2.
For radiation tests, we used the LabHC MOPERIX machine (100 kV X-ray tube with W-target filtered by 4 mm thick of Beryllium material) that delivers X-rays beam, spectrum Fig. 29. All doses and dose rates measured under X-ray are converted in SiO2
equivalent. Irradiations were performed at room temperature. Product number and irradiation condition are in Table 8.
Fig. 29: Emitted X-ray spectrum with an accelerating voltage of 100kV, computed with SpekCalc [48]–[51] with the following parameters: Beryllium thickness = 4 mm, air thickness = 0 mm and theta = 30°(X-ray
emission angle). Table 8: LEDs irradiated with X-ray up to a cumulative dose of 1 MGy
Product number LCH1 3090 MKRBWT SDW84FC
Irradiation conditions Biased and Unbiased
Biased and Unbiased
Biased and Unbiased
We also made radiation characteristics measurement on the LEDs of Table 9
Table 9: type and conditions of irradiated LEDs which radiation characteristic was measured.
Product number LCH1 3090 MKRBWT SDW84FC Type and Irradiation conditions 1 MGy ϒ Unbiased 1 MGy X Unbiased 1 MGy X Biased 1 MGy ϒ Unbiased 1 MGy X Unbiased 1 MGy X Biased 1 MGy ϒ Unbiased 1 MGy X Unbiased 1 MGy X Biased
Flux measurement with an integrating sphere
B.2.3.
First step is to measure the total flux emitted by each LED (W or lm). We used a
Labsphere Ltd LCS-100 allowing an accurate measurement of the LED optical power. An
integrating sphere was chosen for two main reasons:
10 20 30 40 50 60 70 80 90 100 0.00 0.05 0.10 0.15 0.20 0.25 0.30
Norm
al
ize
d
sp
ec
trum
Energy (eV)
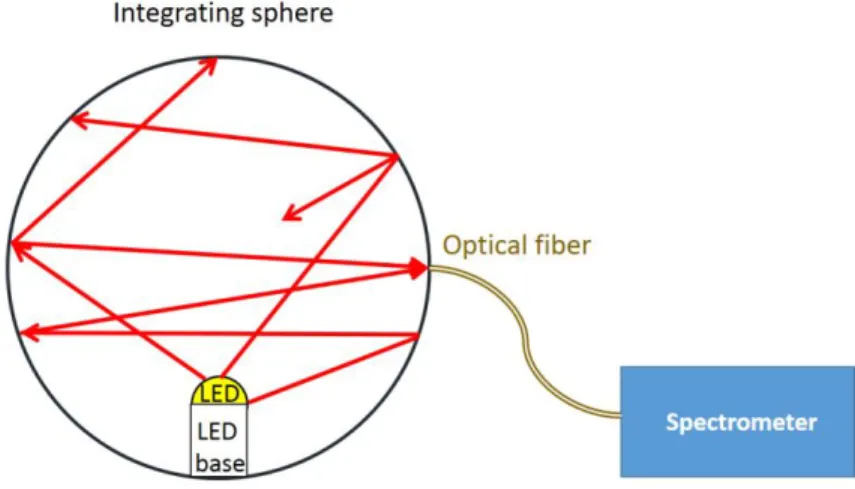
- It collects the entire flux emitted by the LEDs (independently of their directions of emission);
- The illumination at any point on the surface of the sphere is identical and Lambertian, thanks to the sphere internal coating made of white barium sulfate (BaSO4).
This coating presents the advantage of scatter in an isotropic way almost all the radiations in the visible domain, regardless its wavelength. That means that the position of the detector in the sphere does not need to be finely controlled.
Accurate measurement using an integrating sphere requires a calibration of the "sphere→ optical fiber→ spectrophotometer" response to a calibration lamp. Thank to this calibration, we directly obtain results in Watt/nm after correction of the signal deformations induced by the fiber and the spectrometer/detection spectral response. The calibration process and associated calculations are explained in more details in [46]. In addition, this calibration allows us to compare the measurements even after an assembly and disassembly of the experimental bench. The principle of the integrating sphere is illustrated in Fig. 30. Following the first measurement campaign at the end of 2017, results showed a surprising slight increase of the emitted light after irradiation for some LEDs (see section B.3.1). So, we carried out a second measurement campaign. To avoid the difficulties encountered previously, we improved the measurement method by leaving one minute between each current level and making five measurements per step (≈ 1 every 10 seconds) to ensure similar thermal effects from LED to LED. This method was used to perform the repeatability tests (see below) and measurements shown in section B.3.2. The sphere allows recovering a constant part of the LED flux: this is shown in Fig. 31 which was obtained by removing and replacing the LED in the sphere and then performing new measurements at three different currents (100, 500 and 1000 mA). The coefficients of variation are then given by:
. (8)
Fig. 30: Representation of a LED in an integrating sphere and its spectral power measurements .
Fig. 31: Repeatability of the LED positioning in the sphere and power steps. Between each measurement, the LED was shut down, removed from the sphere then replaced again. The power measurement was made
at three different current levels.
Fig. 31 also shows the repeatability between each current rise (the LED is placed
unbiased in the sphere, then the current is rising step by step leaving the voltage free).
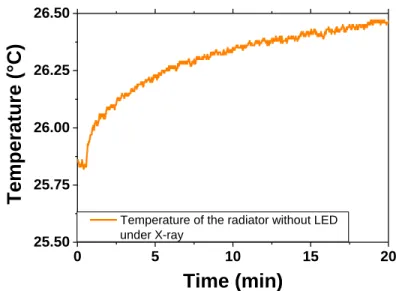
We can note that for all tests, values at each step are really close. Nevertheless at 1000 mA the emitted power decreases from measures 5 to 10, which can be related to the increase of the LED temperature that did not decrease exactly back to initial room temperature between each measurement. As shown in Fig. 49 temperature stabilization can take up to 1 hour. This duration will make the measurement quite time consuming. But above all we were concerned by the risk that the temperature damages the sphere coating, because of the radiator temperature (see Fig. 35) that rises up to 70°C at the
0 2 4 6 8 10 0 1 2 3 4 5 6 7 cV=0.05 cV=0.02 1000 mA 500 mA 100 mA
![Fig. 11: Typical white LED spectrum by phosphorus conversion. Figure adapted from [25]](https://thumb-eu.123doks.com/thumbv2/123doknet/14556736.726126/23.918.273.620.138.404/fig-typical-white-spectrum-phosphorus-conversion-figure-adapted.webp)
![Fig. 24: Power variation @ 590 nm at different gamma doses for 2 currents. Figure redrawn from [44]](https://thumb-eu.123doks.com/thumbv2/123doknet/14556736.726126/35.918.260.617.133.402/power-variation-different-gamma-doses-currents-figure-redrawn.webp)
![Fig. 29: Emitted X-ray spectrum with an accelerating voltage of 100kV, computed with SpekCalc [48]–[51]](https://thumb-eu.123doks.com/thumbv2/123doknet/14556736.726126/41.918.257.621.133.400/fig-emitted-ray-spectrum-accelerating-voltage-computed-spekcalc.webp)


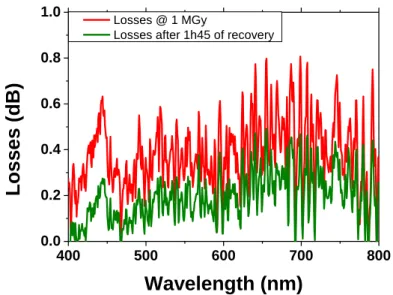
![Fig. 54: Temperature and losses as a function of time (& dose) of pump [420 to 475 nm] and full spectrum of the SDW84F1C LED under X-rays (25 Gy/s) and during the recovery](https://thumb-eu.123doks.com/thumbv2/123doknet/14556736.726126/64.918.242.640.106.422/fig-temperature-losses-function-time-dose-spectrum-recovery.webp)