HAL Id: tel-02152372
https://tel.archives-ouvertes.fr/tel-02152372
Submitted on 11 Jun 2019HAL is a multi-disciplinary open access archive for the deposit and dissemination of sci-entific research documents, whether they are pub-lished or not. The documents may come from teaching and research institutions in France or abroad, or from public or private research centers.
L’archive ouverte pluridisciplinaire HAL, est destinée au dépôt et à la diffusion de documents scientifiques de niveau recherche, publiés ou non, émanant des établissements d’enseignement et de recherche français ou étrangers, des laboratoires publics ou privés.
performance data centers
Emna Baccour
To cite this version:
Emna Baccour. Network architectures and energy efficiency for high performance data centers. Networking and Internet Architecture [cs.NI]. Université Bourgogne Franche-Comté, 2017. English. �NNT : 2017UBFCK009�. �tel-02152372�
U.F.R. SCIENCES ET TECHNIQUE
ECOLE DOCTORAL SPIM
THESIS
Presented by:
Emna Baccour
Submitted in fulfilment of the requirements for the degree of:
DOCTOR OF THE UNIVERSITY OF BURGUNDY
NETWORK ARCHITECTURES AND ENERGY EFFICIENCY FOR HIGH
PERFORMANCE DATA CENTERS
ARCHITECTURES RÉSEAUX ET OPTIMISATION D’ÉNERGIE POUR LES
CENTRES DE DONNÉES MASSIVES
Defended on 30-06-2017
Jury :
Mme. Nadia BOUKHATEM, Professeur, Telecom ParisTech, Rapporteur.
M. Hamameche KHEDDOUCI, Professeur, Université Claude Bernard Lyon 1, Rapporteur.
M. Bernard TOURANCHEAU, Professeur, Université Grenoble Alpes, Examinateur.
M. Sebti FOUFOU, Professeur, Université de Bourgogne, Directeur de thèse.
M. Ridha HAMILA, Professeur, Université de Qatar, Co-encadrant.
The increasing trend to migrate applications, computation and storage into more ro-bust systems leads to the emergence of mega data centers hosting tens of thousands of servers. As a result, designing a data center network that interconnects this mas-sive number of servers, and providing efficient and fault-tolerant routing service are becoming an urgent need and a challenge that will be addressed in this thesis. Since this is a hot research topic, many solutions are proposed like adapting new intercon-nection technologies and new algorithms for data centers. However, many of these solutions generally suffer from performance problems, or can be quite costly. In ad-dition, devoted efforts have not focused on quality of service and power efficiency on data center networks. So, in order to provide a novel solution that challenges the drawbacks of other researches and involves their advantages, we propose to develop new data center interconnection networks that aim to build a scalable, cost-effective, high performant and QoS-capable networking infrastructure. In addition, we suggest to implement power aware algorithms to make the network energy effective. Hence, we will particularly investigate the following issues: 1) Fixing architectural and topo-logical properties of the new proposed data centers and evaluating their performances and capacities of providing robust systems under a faulty environment. 2) Proposing routing, load-balancing, fault-tolerance and power efficient algorithms to apply on our architectures and examining their complexity and how they satisfy the system require-ments. 3) Integrating quality of service. 4) Comparing our proposed data centers and algorithms to existing solutions under a realistic environment.
In this thesis, we investigate a quite challenging topic where we intend, first, to study the existing models, propose improvements and suggest new methodologies and algo-rithms.
L’évolution des services en ligne et l’avènement du big data ont favorisé l’introduction de l’internet dans tous les aspects de notre vie : la communication et l’échange des in-formations (exemple, Gmail et Facebook), la recherche sur le web (exemple, Google), l’achat sur internet (exemple, Amazon) et le streaming vidéo (exemple, YouTube). Tous ces services sont hébergés sur des sites physiques appelés centres de données ou data centers qui sont responsables de stocker, gérer et fournir un accès rapide à toutes les données. Tous les équipements constituants le système d’information d’une entreprise (ordinateurs centraux, serveurs, baies de stockage, équipements réseaux et de télécom-munications, etc) peuvent être regroupés dans ces centres de données. Cette évolu-tion informatique et technologique a entrainé une croissance exponentielle des cen-tres de données. Cela pose des problèmes de coût d’installation des équipements, d’énergie, d’émission de chaleur et de performance des services offerts aux clients. Ainsi, l’évolutivité, la performance, le coût, la fiabilité, la consommation d’énergie et la maintenance sont devenus des défis importants pour ces centres de données. Mo-tivée par ces défis, la communauté de recherche a commencé à explorer de nouveaux mécanismes et algorithmes de routage et des nouvelles architectures pour améliorer la qualité de service du centre de données. Dans ce projet de thèse, nous avons développé de nouveaux algorithmes et architectures qui combinent les avantages des solutions proposées, tout en évitant leurs limitations. Les points abordés durant ce projet sont: 1) Proposer de nouvelles topologies, etudier leurs proprietés, leurs performances, ainsi que leurs coûts de construction. 2) Conception des algorithmes de routage et des mod-èles pour réduire la consommation d’énergie en prenant en considération la complex-ité, et la tolérance aux pannes. 3) Conception des protocoles et des systèmes de gestion de file d’attente pour fournir une bonne qualité de service. 4) Évaluation des nou-veaux systèmes en les comparants à d’autres architectures et modèles dans des envi-ronnements réalistes.
Mot clés: centres de données, algorithmes de routage, qualité de service, consomma-tion d’énergie.
First of all, I would like to thank my supervisor Prof. Sebti Foufou for his kindness, help, support and guidance. You have offered me the most valuable advises through all these three years. Your comprehensive research methodologies and dedicated re-search attitudes have benefited me a lot.
I would like also to thank Prof. Ridha Hamila for his important contributions, com-ments and ideas. At many stages of this thesis I benefited from his advice. I express my deep and sincere gratitude.
Prof. Nadia Boukhatem and Prof. Hamamache Kheddouci have made me honored by reviewing my thesis. I would like also to thank Prof. Bernard Tourancheau for being a member of my Jury.
All my thanks also go to my teammate and lovely friend Zina Chkirbene. Being a mem-ber of a research team with her for three years has been a wonderful experience. Special thanks go to my friends Abir and Raghda, my cousin Zeineb and all of the oth-ers I do not mention here who definitely deserve my sincere acknowledgments.
I wish to give my heartfelt thanks to my very special person, my husband Ahmed, for his love, understanding, unlimited patience, and constant source of support and en-couragement during the challenges of this thesis. You were always around at times I thought that it is impossible to continue. I am very grateful to have you in my life.
I would like also to thank my parents, grandmother and my brother for giving me the love, strength and patience to work through all these years so that today I can stand proudly with my head held high. I will never be able to pay back this love and sacrifice.
Abstract iii
Résumé iv
Acknowledgements v
Contents vi
List of Figures xi
List of Tables xiii
Abbreviations xiv
1 Introduction 1
1.1 Data Centers evolution . . . 1
1.2 Data Center design challenges. . . 2
1.3 Contributions . . . 3
1.3.1 Enhance the latency: Wireless technology (wFlatnet) . . . 3
1.3.2 Enhance the scalability: Paramatrizable topology (PTNet) . . . . 4
1.3.3 Greening the network: Power aware approaches. . . 4
1.4 Thesis organization . . . 5
2 State of the art 6 2.1 Introduction . . . 6
2.2 Examples of existing data centers . . . 6
2.2.1 Google DCs . . . 6
2.2.2 Microsoft DCs. . . 7
2.3 Hardware of data center networks . . . 8
2.3.1 Switch . . . 9 2.3.2 Server . . . 10 2.3.3 Storage . . . 10 2.3.4 Rack . . . 10 2.3.5 Cable . . . 11 2.3.6 cooling machines . . . 11 2.3.7 Power production . . . 11 2.4 Definitions . . . 11
2.4.1 Average path length . . . 12
2.4.2 Diameter. . . 12
2.4.3 Throughput . . . 12
2.4.4 Average network latency . . . 12
2.4.5 Aggregate bottleneck throughput . . . 13
2.4.6 Bisection width . . . 13
2.4.7 Oversubscription . . . 13
2.4.8 Degree of the server . . . 13
2.4.9 Number of switches, wires and servers . . . 14
2.4.10 Disjointed node/edge paths. . . 14
2.4.11 Traffic matrix/pattern . . . 14
2.5 Architectures of data center networks . . . 14
2.5.1 Wired data centers . . . 16
2.5.1.1 Hierarchical designs. . . 16
2.5.1.2 Non-hierarchical designs . . . 19
2.5.2 Wireless designs . . . 22
2.5.2.1 Completely wireless data centers . . . 22
2.5.2.2 Adding wireless links to data centers . . . 23
2.5.3 Optical designs . . . 24
2.5.4 Green data centers . . . 25
2.5.4.1 Usage of renewable sources of energy. . . 25
2.5.4.2 Energy aware hardware. . . 26
2.5.4.3 Energy aware architecture . . . 26
2.5.4.4 Usage of virtual machines technology . . . 26
2.5.4.5 Routing level power aware approaches. . . 27
2.5.4.6 Queuing analysis for power aware approaches . . . 31
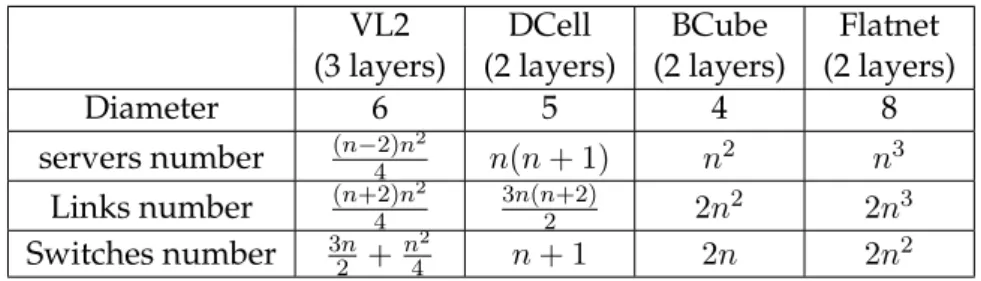
2.6 Comparison of data center architectures . . . 32
2.6.1 Comparison of wired designs . . . 32
2.6.1.1 Comparison of network diameter . . . 32
2.6.1.2 Comparison of scalability. . . 33
2.6.1.3 Comparison of cost . . . 34
2.6.1.4 Comparison of bisection width . . . 34
2.6.1.5 Comparison of cabling complexity . . . 34
2.6.2 Comparison of wireless designs . . . 35
2.7 Conclusion . . . 37
3 Improving the QoS of data center networks 39 3.1 Introduction . . . 39
3.2 Improving the latency: wireless technology (wFlatnet). . . 40
3.2.1 Motivation. . . 40
3.2.1.1 Flatnet: A long average path length . . . 40
3.2.1.2 Availability of 60 GHz wireless technology. . . 41
3.2.2 wFlatnet network structure . . . 42
3.2.2.1 Physical structure . . . 42
3.2.2.2 Radio Interference . . . 44
3.2.2.3 Wireless adapted shortest path routing scheme . . . 44
3.2.3 System evaluation . . . 44
3.2.3.2 Network average latency . . . 46
3.2.3.3 Aggregate bottleneck throughput . . . 47
3.2.3.4 Performance under faulty conditions . . . 48
3.2.3.5 Cost . . . 49
3.2.3.6 Power consumption . . . 50
3.3 Improving the scalability: Parametrizable topology (PTNet) . . . 51
3.3.1 Motivation. . . 51
3.3.1.1 Trade-off between scalability, path length and cost . . . 51
3.3.1.2 Gradual scalability. . . 52
3.3.2 PTNet network structure . . . 53
3.3.2.1 Physical structure . . . 53
3.3.2.2 PTNet gradual scalability. . . 56
3.3.2.3 PTNet shortest path routing scheme . . . 57
3.3.3 System evaluation . . . 60
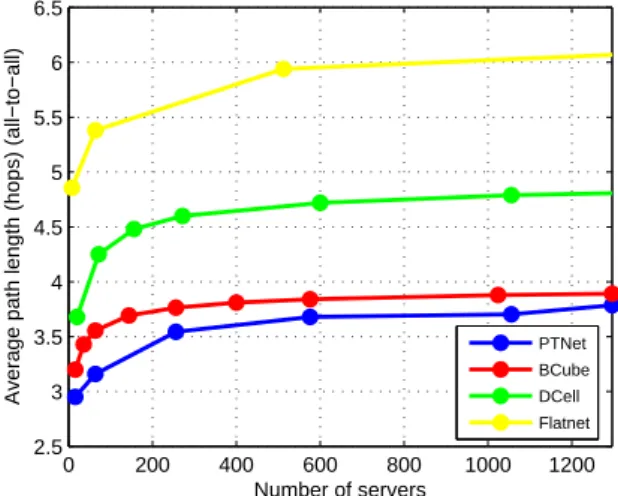
3.3.3.1 Average path length and Diameter . . . 60
3.3.3.2 Network average latency . . . 61
3.3.3.3 Aggregate bottleneck throughput . . . 62
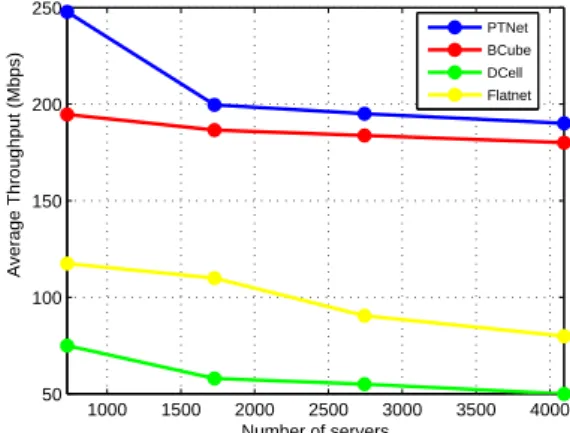
3.3.3.4 Throughput. . . 63
3.3.3.5 Bisection width. . . 63
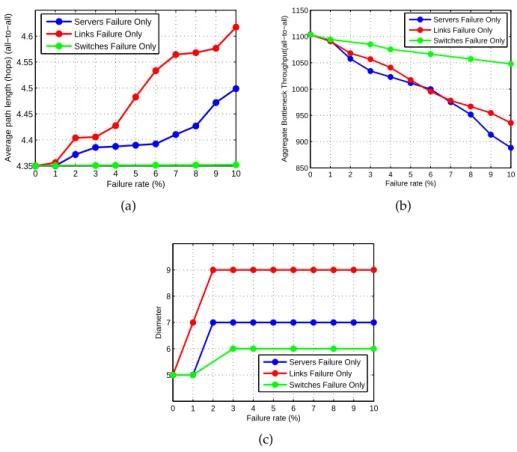
3.3.3.6 Performance under faulty conditions . . . 64
3.3.3.7 Cost . . . 65
3.3.3.8 Power consumption . . . 66
3.3.3.9 Performance of master servers . . . 67
3.4 Further discussion . . . 67
3.5 Conclusion . . . 68
4 Greening data center networks: Power aware routing algorithms 69 4.1 Introduction . . . 69
4.2 Motivation and problem formulation. . . 70
4.2.1 Motivation. . . 70
4.2.2 Problem formulation . . . 70
4.3 Power aware design . . . 73
4.4 Power saving strategy . . . 73
4.5 Power aware routing algorithm . . . 74
4.6 Power saving evaluation . . . 75
4.7 Power aware routing algorithm for PTNet data center . . . 76
4.7.1 PTNet power aware routing algorithm . . . 76
4.7.1.1 Choosing nodes to disable . . . 78
4.7.1.2 Fixing thresholds . . . 79
4.7.1.3 Disabling network devices and performance adjustment 80 4.7.2 System evaluation . . . 81
4.7.2.1 Average path length . . . 81
4.7.2.2 Network average latency . . . 82
4.7.2.3 Throughput. . . 82
4.7.2.4 Performance under faulty conditions . . . 83
4.7.2.5 Power consumption . . . 84
4.8.1 Calculate vital nodes . . . 86
4.8.1.1 Rules to select vital nodes. . . 86
4.8.1.2 Formalizing the rules . . . 87
4.8.2 Vital nodes power aware routing algorithm. . . 92
4.8.2.1 Choosing nodes to disable . . . 92
4.8.2.2 Fixing thresholds . . . 93
4.8.2.3 Disabling network devices and performance adjustment 93 4.8.2.4 Reliability . . . 93
4.8.3 System evaluation . . . 95
4.8.3.1 Trade-off between power saving and system performance 96 4.8.3.2 Trade-off between power saving and reliability . . . 97
4.8.3.3 Different network loads. . . 99
4.8.3.4 Different threshold percentages . . . 100
4.8.3.5 Computation efficiency . . . 101
4.9 Further discussion . . . 101
4.10 Conclusion . . . 103
5 Greening data center networks: Vacation Queuing model 105 5.1 Introduction . . . 105
5.2 Motivation . . . 106
5.3 Proposed approach . . . 106
5.3.1 Re-architecturing the network devices . . . 106
5.3.2 Vacation/Service algorithm . . . 107
5.3.3 Vacation Queuing model for a single processing unit . . . 108
5.3.3.1 Expectation of waiting time and size of the queue. . . . 110
5.3.3.2 Expectation of vacation period . . . 116
5.3.3.3 Expectation of service period. . . 117
5.3.3.4 Expectation of energy gain . . . 117
5.3.4 The distribution of data rate among different processing units . . 119
5.4 System evaluation. . . 121
5.4.1 Simulation environment . . . 121
5.4.2 Power saving strategy . . . 122
5.4.3 Traffic indicator . . . 122
5.4.4 Simulation results . . . 123
5.4.4.1 Constrained optimization problem . . . 123
5.4.4.2 Evaluation of one unit performance . . . 127
5.4.4.3 Evaluation of multiple processing units performance . . 128
5.5 Further discussion . . . 131
5.6 Conclusion . . . 132
6 Conclusion and future works 133 6.1 Conclusion . . . 133
6.2 Future works. . . 134
List of Publications 138
2.1 Google data centers. . . 7
2.2 Microsoft data centers. . . 8
2.3 Data center. . . 9 2.4 Classification of architectures. . . 15 2.5 Fat-tree topology. . . 16 2.6 VL2 topology. . . 17 2.7 Diamond topology. . . 17 2.8 DCell topology. . . 18 2.9 FiConn topology. . . 19 2.10 BCube topology. . . 19 2.11 Flatnet topology.. . . 20 2.12 SprintNet topology. . . 21 2.13 CamCube topology. . . 21 2.14 Hexagonal arrangement. . . 22
2.15 Cayley wireless Data Center[1]. . . 23
2.16 3D beam-forming.. . . 24
2.17 Hypac topology. . . 25
2.18 Elastic tree power aware topology. . . 30
2.19 Comparison of Diameter among different topologies. . . 33
2.20 Comparison of scalability. . . 34
2.21 Comparison of number of switches. . . 35
2.22 Comparison of bisection width. . . 35
2.23 Comparison of number of links.. . . 36
3.1 Comparison of number of links among various topologies. . . 41
3.2 wFlatnet. . . 42
3.3 wFlatnet average path length compared to the Flatnet. . . 46
3.4 Average network latency.. . . 47
3.5 Performance of a 1728-servers wFlatnet under faulty conditions com-pared to the Flatnet. . . 49
3.6 Number of operations completed by switches, servers and links. . . 50
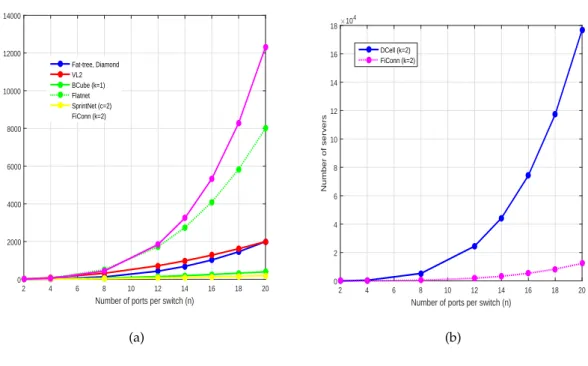
3.7 Scalability of DCell and Flatnet. . . 53
3.8 An inter-cells connection of a 16-servers PTNet using one 4-port switch in each Cell. . . 55
3.9 An intra-cell connection of a PTNet where s=4 and n=4. . . 55
3.10 PTNet size according to the number of switches per cell. . . 57
3.11 Average path length compared to different topologies.. . . 61
3.12 PTNet average latency compared to different topologies. . . 62
3.13 PTNet average throughput compared to different topologies.. . . 63
3.14 PTNet bisection width compared to different topologies. . . 64
3.15 The performance of a 1200-servers PTNet under various faulty condi-tions (All-to-all communication pattern).. . . 65
3.16 Number of operations among different topologies. . . 67
4.1 Modules of the power-aware routing Algorithm. . . 76
4.2 The importance of the master server in PTNet. . . 78
4.3 Guaranteeing a non-partitioned network. . . 80
4.4 Minimum number of active nodes. . . 80
4.5 Average path length . . . 81
4.6 Average packet delay.. . . 82
4.7 Average throughput. . . 83
4.8 The performance of a 1200-servers of the PTNet vs Green PTNet under various faulty conditions (Some-to-some communication pattern).. . . . 84
4.9 Power saved by the power aware routing algorithm of PTNet. . . 85
4.10 Clusters of FiConn data center topology (n=4). . . 90
4.11 Articulation nodes in FiConn in case of v10failure. . . 92
4.12 Trade-off between energy saving and system performance (Flatnet).. . . 97
4.13 Trade-off between energy saving and system performance (PTNet). . . . 98
4.14 Energy saved (Watts).. . . 98
4.15 Reliability vs energy (Watts). . . 99
4.16 Reliability vs energy (%). . . 99
4.17 Load vs energy (%). . . 100
4.18 Threshold vs energy (Flatnet). . . 100
4.19 Threshold vs energy (PTNet). . . 101
5.1 Re-architecturing the network devices. . . 107
5.2 Interaction between components of the re-architectured device. . . 108
5.3 Processing unit state diagram. . . 109
5.4 The queue size and corresponding status. . . 110
5.5 Imbedded Markov points for M/G/1/K queue. . . 112
5.6 Power-aware system. . . 119
5.7 Always-on system. . . 119
5.8 Distribution of effective data rate between units. . . 120
5.9 Enlargement of mean vacation times.. . . 121
5.10 Impact of Tminon the waiting time and energy gain. . . 124
5.11 Impact of m on the waiting time and energy gain. . . 124
5.12 Impact of l on the waiting time and energy gain. . . 124
5.13 Contribution of the optimization in the energy gain. . . 128
5.14 Effective data rate. . . 129
5.15 Distribution of data rates between ports when n=6. . . 129
5.16 Number of active ports. . . 130
5.17 Energy Gain. . . 130
2.1 Quantitative comparison of different data centers. . . 32
2.2 Comparison of scalability. . . 33
2.3 Comparison between wireless DCs. . . 36
2.4 Cost comparison of wired and wireless data centers ($)[2]. . . 37
3.1 Properties of different network architectures. . . 41
3.2 Ethernet vs 60 GHz links. . . 41
3.3 Number of racks to host wFlatnet. . . 43
3.4 Comparison of APL and Diameter among different topologies. . . 46
3.5 Simulation settings. . . 47
3.6 Average transmission delay. . . 47
3.7 Properties of different network architectures. . . 56
3.8 Flows distribution in all-to-all communication for 1200-servers PTNet (n=20, s=3).. . . 58
3.9 Simulation settings used for the development of different topologies. . . 61
3.10 Cost comparison between different topologies. . . 66
3.11 wFlatnet Vs PTNet. . . 68
4.1 Summary of notations used in section 4.2.2. . . 71
4.2 Summary of notations used in the routing algorithms. . . 75
4.3 Importance evaluation. . . 91
4.4 Comparison between the power aware algorithms.. . . 103
5.1 Summary of notations. . . 111
5.2 Energy consumed in different states of the processing unit [3]. . . 122
5.3 Optimized parameters for QoS = 30. . . 126
5.4 Optimized parameters for QoS = 40. . . 126
5.5 Mean vacation time. . . 126
ABT Aggregate Bottlneck Throughput APL Average Path Length
BI Blocking Island
CPU Central Processing Unit DC Data Center
DCN Data Center Network DFS Depth First Search
DVFS Dynamic Voltage and Frequency Scaling HLSDB Historical Link and State Data Base IP Internet Protocol
IT Information Technology LF Least Flow
LL Least Link LOS Line Of Sight
Mac Media access control NIC Network Interface Card NSA Network State Advertisement NSDB Network State Data Base
OE Opt Edge
OSPF Open Shortest Path First protocol PCA Principal Component Analysis QoS Quality of Service
R Random
SDN Software Defined Network ToR Top of Rack
VM Virtual Machine VOVO Vary On Vary Off
Introduction
In the last few years, data centers become the backbone of the world business, economy, communication, and consumer services. All online activities, including web searching (e.g., Google), social networking (e.g., Facebook), video streaming (e.g., Youtube), gam-ing (e.g., Steam), shoppgam-ing (e.g., Amazon) are hosted in large data centers. However, few decades ago, business relied only on paper and pencil documentation methods. Data centers improved largely the creation, the usability, the maintenance and the stor-age of the data. In this way, with a browser or a software installed on any device, we can use data center services freely.
1.1
Data Centers evolution
The concept of data centers (DCs) was proposed in 1990. However, the features and requirements of the data centers appeared in the early 1960s with the first computer operations deployed in a computing center of some university laboratories. During the 1980s, people started to deploy computers everywhere but with no care about qual-ity of service and operating requirements[4]. Then, the computing operations became more and more complex and the organizations became aware that the information tech-nology (IT) needs to be controlled. Hence, since network equipment were inexpensive, specific rooms inside the companies were built and an hierarchical design was pro-posed. In this time, the term “data center” began to be used and studies were con-ducted in this field. The boom of data centers came between 1997 and 2000 where companies needed fast internet connection and high performance to deploy heavy ap-plications. Therefore, they migrated to private networks. New technologies and prac-tices were designed also to handle the scale and the requirements of the network. Then, as computation moved into the cloud, Google CEO proposed that the data services and
architectures should be on the cloud. After that, Amazon installed its web services on the cloud and Wikipedia introduced the virtualization on its networks as a service over cloud. Nowadays, the term “cloud” is integrated into the term “data center” and data centers begin to play more and more important role in web searching, social network-ing, large scale computations, online gaming and so on.
1.2
Data Center design challenges
To support the growing needs of cloud computing need, such data centers should host hundreds of thousands of servers, processing different types of services such as MapReduce[5], GFS[6], BigTable[7]. This huge number of servers is growing every day[8]. For example, Microsoft is doubling the number of servers in its data centers ev-ery 14 months[9], which is faster than Moore’s Law[10]. This is resulting in enormous challenges to design a robust interconnected network with a cost-effective deployment and maintenance. In addition, with data availability and security at stake, the robust-ness of data center network becomes more critical than ever. Generally, the design goals of data center networks are: high scalability, good fault tolerance, low latency, high network capacity, load balancing, low cost, energy consumption and virtualiza-tion if necessary.
High scalability: A scalable system is a system that meets three requirements: first, the network must be able to connect millions of servers at a reasonable cost, simple instal-lation and small number of wires. Second, the scalability must be gradual. It means the topology must be able to offer different sizes of the network. Third, the routing algorithm must be itself scalable and efficient to be processed in a large network. Fault tolerance: With a growing number of equipment and cables in data center net-work, failures can become common rather than exception. A robust data center is the one that continues working without being affected by failures due to its fault-tolerant routing algorithm and its design that offers multiple connections between nodes. Low latency and short path length: To offer faster services, communication between servers must be as rapid as possible. So, a short path length between any two nodes must be provided by the network design. The low latency must remain valid even for the large scale data centers.
High capacity: large data centers composed of millions of servers need high band-width to offer a sufficient runtime performance. As an example, The mapReduce is one of the applications that requires a large amount of bandwidth. Indeed, in the reduce operation, the reduce agents communicate with many servers in the network. So, an all-to-all communication is adopted by this application and requests consequently a high network capacity.
Load balancing: load balancing techniques are conceived to improve the distribution of workloads across multiple computing resources. It ensures better link utilization and higher throughput and capacity.
Cost: A convenient data center should interconnect a large number of servers using the minimum number of network equipment (switches, cables, ...). Hence, the simpler the architecture is, the less cost the network has.
Power consumption: a green data center is a network that consumes energy propor-tionally to the traffic workload and meets in the same time reliability and high perfor-mance requirements.
Virtualization: a well virtualized network is the one where virtual machines (VMs) can migrate to any physical machine without changing the IP address. This migration should be also well supported which means the performance should not be affected.
1.3
Contributions
Many research efforts focused on finding both efficient network interconnections that satisfy QoS requirements as well as satisfying the requirements of data center networks. The followings are some examples of well known data center designs: FatTree[11], DCell[9], BCube[12], ElasticTree[13], and wireless topologies[14]. However, gathering all data center requirements in one topology was not addressed by these solutions. Ex-isting solutions either scale too fast (but suffer from a large latency and a long path length), offer a high performance in term of latency (but fail to construct a scalable topology), inherit poor availability, or can be too complex/expensive to be constructed. In this thesis, we address these aforementioned issues by conducting series of analyses and developing novel algorithms/architectures, where the ultimate goal is to build a scalable, high capacity, energy efficient and cost-effective data center networking in-frastructure. The contributions that we have made are summarized as follows:
1.3.1 Enhance the latency: Wireless technology (wFlatnet)
First, we tackled two challenges which are latency and average path length taking into consideration the load balancing and fault tolerance properties. An intuitive idea would be to add some switches and links to the network which may reduce the path length at a price of high complexity of wiring and installation not to mention the cost of cabling that represents 7-8 % of the overall infrastructure cost[14]. So, our contribu-tion is to add wireless links to existing networks as a solucontribu-tion to reduce the transmis-sion path. This new designed topology, called wFlatnet, introduces shortcuts between
nodes through the wireless connections without burdening the network with wiring and maintenance complexity.
1.3.2 Enhance the scalability: Paramatrizable topology (PTNet)
Second, we handled the problem of scalability. Thus, we proposed a novel server-centric network topology, called PTNet, characterized by its parameterizable architec-ture that allows constructing a scalable or a small network according to the applications need. In addition, PTNet makes a trade-off between scalability, low latency and power consumption. To meet such a goal, PTNet enjoys a new network interconnection that connects servers directly by using their capacity of routing packets. This approach re-duces the number of switches and consequently rere-duces path length, packet delay and the cost of the extra-machines. PTNet rich physical connection allows to have different routes between nodes to improve the performance and fault-tolerance of the system. It is also based on clusters to build its topology. The size of each cluster can be adjusted by a parameter s to make PTNet a parameterisable architecture that constructs different network sizes.
1.3.3 Greening the network: Power aware approaches
Finally, we investigated the problem of power consumption in data centers. In fact, it is noted that a typical data center operates only at 5% to 25% of its maximum capacity de-pending on the period where the utilisation of the network fluctuates according to the incoming loads[13][15]. If the load is low, the servers are kept idle and they may still consume up to 70% of their peak power which causes a great waste of energy[16]. This situation is worsened by the traditional routing algorithms that do not take into consid-eration the non-proportionality between the traffic load and the energy consumption. Based on these observations, we can deduce that when the network is under-utilized, the traffic can be satisfied by only a subset of devices and the idle ones can be powered off to save the energy. In this thesis, we focused on designing power aware routing algorithms that switches on only ports of servers contributing to the traffic load and the critical nodes maintaining the system non-partitioned. Then unneeded devices are deactivated. Two routing level approaches were proposed to handle the power ineffi-ciency in the network. But, since these two solutions are traffic load dependent which is a random factor, we proposed, also, a queuing model approach to make greening the network independent from the traffic matrix. The idea is to consolidate the arriving traffic into few ports of the networking device and switch off the rest of interfaces. In this way, we do not need to know the traffic matrix and to define the idle devices.
1.4
Thesis organization
This thesis is organized as follows:
• Chapter 2 includes a literature review on recent data center networks with their clas-sification.
• Chapter 3 characterizes and describes two Data Center Interconnection networks (DCNs) termed wFlatnet and PTNet respectively. This chapter covers, also, the simulation of the new data centers followed by the performance results.
• Chapter 4 presents two routing aware algorithms that aim at making the power con-sumption proportional to the traffic load.
• Chapter 5 introduces a theoretical analysis of the queuing model proposed to make the network green and independent from the traffic load. An optimization ap-proach to ensure the performance of the data center is also described.
State of the art
2.1
Introduction
Recent researches have investigated various scientific challenges related to data center networks and addressed many of networking issues. A lot of innovative ideas are proposed such as creating novel data center designs, enhancing the performances of existing topologies by adding wireless links or virtual machines, proposing algorithms to make the network power efficient, etc. Based on these efforts, we have conducted, in this chapter, a deep study about existing data centers and investigated related works to describe the faced challenges, proposed solutions and critics that helped us to propose few contributions.
2.2
Examples of existing data centers
In this section, we briefly present data centers of two big companies: Google and Mi-crosoft.
2.2.1 Google DCs
Google data centers are the softwares and large hardware resources used by Google to offer their services to the clients. The first prototype of Google data center is called Backhub (see Figure 2.1(a)) and was placed in the dorm of one of the founders of Google, Larry Page. This prototype was simple. However, it met all the requirements of Google searching. Now, Google owns 36 data centers located in all over the world:
19 in the USA, 12 in Europe, 3 in Asia, 1 in Russia and 1 in South America. Addi-tionally, more than 10 data centers will be built before 2019[17]. The first scalable data center was constructed in Portland Dalles (see Figure2.1(b)), costed 600 $ millions, oc-cupied an area of 94 000 square feet and powered by Dalles dam. Then, another 600 $ was spent, in 2013, to build a second data center in Dalles occupying 164 000 square feet. Searching, emailing and maps are offered by Douglas data center which uses the recycled water system to provide cooling needs. Finland data center uses also environ-mental resources (sea water) to control the temperature of its buildings. As energy cost is the top priority of Google, Belgium data center, which costed 250€ millions, utilizes the gray water (clean water waste) to power its cooling systems. By using the renew-able energy, Google electrical power of its global operations ranges between 500 and 681 megawatts [18][4].
(a) (b)
FIGURE2.1: Google data centers.
Google uses commodity servers with a customized version of Linux. Their CPUs of-fer the best performance per dollar and not the absolute performance. The servers are open from the top so that a rack (see section 2.3.4) can contain more devices. Each server has an additional 12-volt battery to reduce the cost and the power consumption. Concerning the software, most of them are developed in-house.
Details of Google worldwide networks topology are not publicly available but Google publications make references to the Clos architecture (see section2.5.1.1) and recently the software defined networks (SDN).
2.2.2 Microsoft DCs
Microsoft [19] owns many data centers worldwide: USA, Europe and Asia. Washington Quincy hosts 2 data centers: the first one covers an area of 75 acres (see Figure2.2(a)) and the second one, which is a modular data center (the basic component of a DC is
a shipping container), covers 93 000 square feet. Microsoft owns also a data center in Texas San Antonio occupying half a million square feet and costing 550 $ millions. This data center uses the recycled water to control the temperature. The biggest data center of Microsoft, which is also one of the biggest DCs in the world, is located in Chicago, costs 500 $ millions and covers more than 700 000 square feet (see Figure2.2(b)) . The biggest oversea data center is placed in Dublin, Ireland covers 303 000 square feet and uses the natural wind for cooling purposes.
Microsoft DCs connect more than 1 million servers and support more than 200 online services such as Azure, skype, oneDrive, Bing, Office and Xbox live. More than 15000 $ millions are invested to build 1600 unique networks and 1.4 million miles of fibers. Microsoft network architecture is a Clos-based design. The company adopts also the virtualization in several components of the architecture in order to enhance the scala-bility, the flexibility and the CPU utilization.
Nowadays, approximately 44% of the electricity consumed by Microsoft data centers are produced from wind, solar and hydraulic energy. The target goal is to reach 50% of utilization of renewable energy by 2018. In addition, Microsoft achieves 100% of carbon neutrality since 2012.
(a) (b)
FIGURE2.2: Microsoft data centers.
2.3
Hardware of data center networks
A data center consists of several physical components including: switches, servers, storage, racks, cables, cooling machines and power production as presented in Figure
Racks, switches, servers, cables Cooling machines
Storage
Heat rejection
Power production
FIGURE2.3: Data center.
2.3.1 Switch
The switch is the principal component of many data center architectures such as the three-layered topologies and the virtualized networks. In fact, all the switches have a basic functionality which is providing a media access control (Mac) addresses to the ports. These ports are responsible for forwarding packets to the intended destinations, prevent network loops and segment the traffic. However, different types of switches have specific characteristics. For the tree-layered architectures, we distinguish 3 types: core, distribution and access switches[20]. Core switches are characterized by their speed, high throughput and high performance. Distribution switches connect core and access switches and aim to choose the optimal path to relay packets and have better quality of service and high memory. Access switches, which are directly connected to the end-users, are better from security perspective. However, since data center architec-tures are changing (eg. the growth of virtualized networks), new DC-class switches are continuously being designed. They are characterized by their higher availability, bet-ter fault tolerance, higher flexibility, compatibility with other configurations and easier control.
2.3.2 Server
Servers are the core of data center architectures that store, process, transmit and an-alyze the data. They can be categorized into three types: tower, rack and blade[21]. Tower servers are the first ones used in data centers. However, they can only satisfy the requirements of a small network. It means they are not appropriate for a high scale data center. Hence, rack servers are designed for modern DCs. They are highlighted by their space saving and their easy placement into a rack. In this way, a rack can con-tain multiple racks servers. However, they suffer from high cabling complexity. Blade servers are designed to overcome the drawbacks of the aforementioned servers. They are characterized by a low cost, high availability, reduced maintenance and simple in-stallation. Even though data center servers are standardized, IT companies such as Facebook and Google customize their servers software.
2.3.3 Storage
Data center storage refers to the devices, tools, technologies and software used to im-plement, manage and control the storage resources such as hard disk drivers, backup utilities, external storage, etc. It also includes the policies, procedures and security methodologies of the storage. Small data centers adapt a centralized storage man-agement. However, nowadays, the stored data is increasing rapidly (photos, voice, videos, etc). In this case, the centralized management is not suitable for the cloud data. Hence, a distributed storage management is adapted (eg. Amazon storage, Windows Azure storage). Another trend is the Software Defined Storage which is a form of stor-age virtualization that separates the storstor-age hardware from the software that manstor-ages it[21][22].
2.3.4 Rack
A rack in a data center is designed to house network equipment (rack servers, blade servers, switches and storage devices). Using the rack design, the management of the DC equipment is easier and the use of the room space can be more efficient. There are two types of racks commonly used in a data center which are the open racks and the cabinet racks. The open racks are easier to manage and install. However, the cabinets are more stable and secure. The dimensions of a rack are generally: height is between 42 U and 48 U (1U=44.45mm), width is between 600 and 800 mm and depth is between 1100 and 1200 mm [21]. Racks are placed in rows forming corridors (called aisles) between them to allow technicians to access to the front and near of each cabinet.
2.3.5 Cable
Nowadays, data centers house a huge number of networking devices including blade servers, efficient storage, virtualized devices that require all a physical cabling with a high performance, low cost, easy installation, reliability, high scalability and flexibility. In data centers, two methods of cabling are used: the backbone cabling and horizontal cabling. The backbone cables generally connect the equipment rooms and telecommu-nication rooms. However, the horizontal cables connect individual outlets to telecom-munication rooms. The Ethernet standards used in DCs are: 10GBASE, 40GBASE and 100GBASE[23]. Cables represent 7-8 % of the overall data center investment[14].
2.3.6 cooling machines
The air conditioning is used to control the temperature and the humidity in data cen-ters. The temperature in a data center room is generally raised because of electronic equipment[24]. By controlling the air temperature, the networking equipment are main-tained within the specified humidity/temperature range. Modern data centers are try-ing to decrease the cost of cooltry-ing by adapttry-ing new techniques such as outside air cooling, sea water cooling and renewable energy to operate air conditioner.
2.3.7 Power production
The power production part of a data center building consists of power supplies, gaz generators and battery banks. To prevent power failures, all electrical system elements are duplicated[24].
2.4
Definitions
To present existing data centers and the studies conducted in this field, some parame-ters should be defined as they will be used in further sections.
2.4.1 Average path length
The average path length (APL) is the average number of hops traveled by packets to reach the destinations. This metric is important to evaluate the efficiency of the trans-mission and the communication delay. It can be computed as follows:
AP L = P i,j li,j P i,j ρi,j (2.1)
where li,j represents the path length between the two nodes i to j, with ρi,j = 1if a
routing path exists between i and j and ρi,j = 0if not.
2.4.2 Diameter
The diameter represents the maximum shortest path between any two servers in the network. A smaller diameter helps to have a more effective routing algorithm and a lower latency.
2.4.3 Throughput
The throughput of the network depends on the packet delay, the data rate of the chan-nel and the rate of successful messages. Having multiple possible routing paths be-tween nodes leads to less traffic congestion and more available bandwidth which im-proves the throughput. The throughput can be obtained as follows:
Tavg = 1 np np X i=1 (ρi∗ δi di ) (2.2)
where Tavg is the average throughput of the network, ρi ∈ [0, 1], with ρi = 1, represents
the success of the reception of a packet i and ρi = 0represents the failure of the
recep-tion of a packet i, δiis the size of the packet i, diis the delay of the transmission of the
packet i and npis the total number of transmitted packets.
2.4.4 Average network latency
Many data centers applications have to meet various time constraints[25]. Therefore latency is an important metric to judge whether these constraints are met or not. La-tency is defined as time taken by the packet to travel from a source to destination. It
consists of the transmission delay, the propagation delay, the queuing delay and the time to process data in servers and switches. However, the major contributor in the packet delay delivery is the queuing and processing of the data at each relay node. The average packet delay, called also the average network latency, is computed as follows:
Davg = 1 np np X i=1 di (2.3)
where Davgis the average latency of the system, npis the total number of packets
com-municated in the system and diis the delay of the communication between two nodes
when sending a packet i.
2.4.5 Aggregate bottleneck throughput
The aggregate bottleneck throughput (ABT) is used to evaluate the network capacity under all-to-all traffic pattern (all servers send data to all other servers). The flows that have the smallest throughput are called bottleneck flows. The aggregate bottleneck throughput is obtained by summing all bottleneck flows.
2.4.6 Bisection width
The bisection width represents the minimum number of links cut when the network is partitioned into two equal halves. It is used to estimate the worst failure case of the system. Hence, the larger the bisection width is, the better fault tolerance the network will have.
2.4.7 Oversubscription
The oversubscription is the worst case achievable bandwidth among the devices. An oversubscription equal to 1:1 means that all servers communicate with the full band-width and an oversubscription equal to 5:1 means that 20% of the bandband-width is avail-able for the traffic communications.
2.4.8 Degree of the server
The degree is the number of connected ports per server. A standard server has 2 ports. However, some networks add ports to servers in order to make the network scalable.
2.4.9 Number of switches, wires and servers
We assume in this thesis that all switches, wires and servers are the same so we can have a fair comparison between topologies. The number of servers determines the scalability of the network. The DC that connects more servers with the same number of network equipment (switches with same number of ports, wires, etc.) is the most scalable network.
2.4.10 Disjointed node/edge paths
The number of disjointed node paths represents the total number of paths between any two servers, where these paths do not have any common intermediate nodes. This met-ric could be used to assess whether a given network is well designed as well as having required physical connections. The more number of disjointed paths a given network has, the more fault tolerant it becomes: if one (routing) path fails, the other paths can be used. The number of disjointed edge paths represents the total number of paths between any two servers, where these paths do not have any common intermediate edges.
2.4.11 Traffic matrix/pattern
The traffic matrix is the table of communicating servers (sources and destinations) at a time t.
2.5
Architectures of data center networks
Data centers are composed of interconnected physical components to support cloud services. The number of connected devices is increasing everyday and reaching even millions. Such a huge network should provide a good quality of service and needs to be reliable, scalable, flexible, robust and cost effective. Many surveys and books provided overviews of the existing solutions for data center interconnections such as [26], [8], [27], [28] and [29]. In the survey [26] and the book [8], the authors examined some rep-resentatives of data centers that appeared in the academic and research literature. Then, they analyzed the data center topologies according to several features and properties (scalability, performance, fault tolerance, ...). In addition, they studied the routing algo-rithms designed for each topology and the techniques used to enhance the data center
performance. However, recently designed data centers are not described in the afore-mentioned works. Moreover, the survey does not cover the wireless networks and the green cloud solutions. Authors of the survey [27] described a more recent data center architectures and discussed many novel techniques and schemes (transport protocols, sharing mechanisms, ...). Although this survey covered recent data center architectures and algorithms, there are still challenging issues like saving the energy consumption and minimizing the cabling/installation complexity which are not addressed in the pa-per. The authors of the surveys [28] and [29] focused on greening data center networks and described different techniques designed to minimize the consumed energy. In our work:
• We recall the well known and representatives data center network topologies (DCell, BCube, Fat-tree,...) described in the above surveys.
• We present new solutions that are not covered in all the previous surveys (Sprint-Net, Diamond, ...).
• We establish a comparison between these networks by plotting graphs of their performance parameters.
• We investigate the wireless networks and benchmark different contributions.
• We classify the contributions to green the data center networks, describe each type and present examples.
Data centers are classified as described in Figure2.4.
Technology
Wired DCs Green DCs Wireless DCs
Hierarchical DCs Non-Hierarchical DCs Completely wireless DCs Adding wireless links to DCs Optical DCs
2.5.1 Wired data centers
2.5.1.1 Hierarchical designs
The hierarchical designs build a network from multiple layers.
- Tree-based architectures
The tree-like topologies or Clos topologies are constructed as a multi-rooted tree.
• Fat-tree[11] is a 3-level data center. Using n-port switches, Fat-tree has n pods (see Figure 2.5). Each pod contains n2 switches of aggregation layer and n2 switches of edge layer. Switches in this topology are divided into (n2)2 core switches and n22 aggregation and edge switches respectively. The total number of servers hosted by the network is n23. Even though Fat-tree is highlighted by its 1:1 oversubscription ratio provided to all servers, it still suffers from wiring complexity problem.
FIGURE2.5: Fat-tree topology.
• VL2[30] is constructed of multiple switches arranged into a Clos topology as pre-sented in Figure2.6. The goal of VL2 is to solve the problem of oversubscription. In fact, using its algorithm of load balancing (Valiant load balancing algorithm) and its methodology to spread independent traffic to all destinations, VL2 offers a uniform high capacity to all servers. However, VL2 suffers from low scalability and expensive switches to be implemented (ports capacities are 10 times those of Fat-tree).
• Diamond[31] is an improvement of Fat-tree topology. But, it implements only core and edge n-port switches. In fact, Diamond supports n22 edge switches connected to
n
FIGURE2.6: VL2 topology.
to Fat-tree, Diamond reduces the average path length while supporting the same number of servers.
FIGURE2.7: Diamond topology.
- Recursive architectures
The recursive architectures use servers with more than 2 ports to scale to k upper layers.
• DCell[9] is a recursive architecture, which is constructed from a low-end mini switch connected to n servers forming a basic unit called DCell0 as depicted in Figure2.8.
To build a larger network, DCell0s are connected with direct links between servers.
DCellk can be constructed from (tk−1 + 1)DCellk−1 where tk−1 is the number of
servers in DCellk−1. DCell offers a robust fault-tolerant routing protocol. However,
and cause a low aggregate bottleneck throughput. In addition, the double exponen-tial scalability is still the major challenge for DCell architecture.
• FiConn[32] has the same first layer as DCell0 (see Figure2.9). However, to scale to
upper layers, FiConn uses the backup ports of the servers. FiConnkconsists of (2c+1)
FiConnk−1 , where c is the number of backup ports in FiConnk−1. The number of
servers in FiConnkis equal to tk−1(tk−12k + 1), where tk−1is the number of servers in
FiConnk−1. FiConn is a traffic aware topology that enhances the link utilization and
the aggregate throughput. However, it suffers from bad fault tolerance and a long path length.
FIGURE2.8: DCell topology.
• BCube[12] is also a recursive architecture designed for modular data centers, which makes it portable and easy to deploy. BCube has the same basic unit as DCell, how-ever to construct a higher level network, servers are connected using n extra switches (see Figure 2.10). Consequently, a BCubek is constructed from n BCubek−1 and nk
extra switches that connect one server from each BCubek−1. With this huge number
FIGURE2.9: FiConn topology.
FIGURE2.10: BCube topology.
2.5.1.2 Non-hierarchical designs
- Flat architectures
The flat architectures reduce the multiple switch layers to only two or one layer. The advantage of flat topologies is the easy management and maintenance.
• Flatnet[33] presented in Figure2.11is a flat architecture that scales with a speed of n3. Its network offers a simple and scalable architecture, consisting of two layers. The first layer contains one n-port switch connected to n servers (1-layer Flatnet). The second layer is built by n2 1-layer Flatnet (subsystems). Subsystems are connected using n2 n-port switches. Flatnet shows good performance in terms of scalability
and fault-tolerance, however it does have some drawbacks, such as high diameter and long average path length that affect the latency of the network.
FIGURE2.11: Flatnet topology.
• SprintNet[34] is a server-centric data center network architecture. This topology ex-hibits good fault tolerance and a low latency. The basic unit is named Cell, which is the building block to construct a larger SprintNet. Each Cell is constructed with c n-port switches, where c+1cn ports of each switch are connected to c+1cn servers and
cn
c+1 ports of inter-Cell connections. Accordingly, each Cell contains cn
c+1 servers (see
Figure2.12). All the switches and servers are fully-connected. The 1-layer SprintNet consists ofc+1cn +1Cells, and supports (c+1cs )2n2+c+1cn servers in total. A larger Sprint-Net can be constructed by adding c+1cn Cells fully connected to each others. Despite its low latency, SprintNet fails to construct a scalable topology.
- Switchless topologies
The switchless architectures does not rely on switches to build its network.
• CamCube[35] is designed to simplify the network topology. CamCube is a C-ary 3-cube, where C is the number of nodes in each dimension (see Figure 2.13). Each server in this topology connects directly 6 neighbor servers and can be defined by its coordinate (x, y, z) called address. CamCube can support up to C3 servers. It
FIGURE2.12: SprintNet topology.
is a scalable data center that offers multiple paths between communicating servers. However, these paths are not disjoint and the various shared links create congestion and packet loss, which can decrease end-to-end throughput.
2.5.2 Wireless designs
2.5.2.1 Completely wireless data centers
The goal is to get rid of wires and offer a network with a reduced cost, facility of instal-lation, re-configurability and easy maintenance.
• The polygonally arranged wireless data center is proposed by Vardhan et al.[36][2]. The goal is to replace all cables in data center networks by wireless links using IEEE802.15.3c standard known as 60 GHz millimeter wave technology (mmWave). Due to the actual disposition of data centers, servers in the same rack are not able to communicate with each others and farther servers in the same row cannot also communicate using wireless links. Authors proved that by placing racks in studied positions forming a polygon (hexagon for example) and by fixing the beamform-ing parameters, each node can communicate with other nodes. Figure 2.14shows this hexagonal arrangement. Although this work came with a solution to create a
FIGURE2.14: Hexagonal arrangement.
topology free of wires, it can lead to an inefficiency of space usage and maybe cool-ing problems. In addition, no technical studies have been done to evaluate network performance (throughout, transmission delay. . . ) after using wireless links.
• Caylay[1] is a novel topology designed to connect servers wirelessly. Authors sug-gested to build cylindrical racks. Every rack is divided into 5 levels called stories. Each story holds 20 prism shaped containers that stores servers. Network interface cards (NIC) of a server are replaced with a customized piece of hardware that con-nects the servers system with two transceivers placed at the ends of the prism. Racks are placed in rows and columns to make maintenance easier. Figure2.15shows this novel topology. Cayley owns a better bandwidth compared to Fat-tree, a good fail-ure resilience and an acceptable cost and power consumption as maintenance costs and power consumption are significantly lower now due to the absence of wiring.
FIGURE2.15: Cayley wireless Data Center[1].
However, Cayley presents some limitations such as packet delivery latency and scal-ability because of the multi hop nature of the topology.
2.5.2.2 Adding wireless links to data centers
Traditional data centers are tree-structured topologies. This type of architecture suffers from oversubscription in Top of Racks (ToR) switches (used in full capacity, congested). Each oversubscribed switch that presents a potential hotspot can block some applica-tions and deteriorate the performance. Since implementing more links and switches to solve this problem can be costly, recent researches propose to add wireless links in ToR switches which is a less expensive solution.
• Srikanth et al. [37] studied traffics in a tree-based data center and tried to gather de-mands between top of rack switches. They conclude that traffic is concentrated be-tween a few ToR switches that present a bottleneck and hold back the entire network from job completion. Thus, providing extra capacity for these ToRs can significantly improve performance. In fact, a network with few wireless links (flyways) connect-ing pairs of oversubscribed ToRs with a low bandwidth can offer a performance equal to the one of a non-oversubscribed network. Furthermore, flyways architec-ture is not coming with a new strucarchitec-ture like VL2 and Fat-tree. Rather, wireless links can be deployed anytime on tree-topologies.
• 3D beam-forming for wireless data centers[38][39] is designed after studying previ-ous works aiming to increase performance by adding wireless links. In fact, restrict-ing wireless transmissions to neighborrestrict-ing racks means that multiple hops connection is needed to connect two non-line of sight nodes. This can increase the transmission delay and reduce throughput. In addition, due to the interference between differ-ent wireless links, concurrdiffer-ent transmissions are restricted. Thus, authors proposed
to use 3D beam-forming. This approach leverages ceiling reflections to connect non neighboring racks as illustrated in Figure2.16. Indeed, each sender points its beam to the ceiling, which will reflect the signal to the desired receiver. 3D beam-forming approach requires beam-forming radios, ceiling reflectors that act like specular mir-rors to reflect signals and electromagnetic absorbers placed on the top of the racks to prevent any local reflection and scatter around the receiving antenna. Ceiling reflection can extend link connectivity to reach far nodes and bypass obstacles. In addition, 3D beam-forming limits the interference region to a much smaller area. Experimental results show that the majority of the rack pairs can be connected si-multaneously. However, many challenges face this work. Actually, the rotation to the ceiling and the positioning of the wireless link add an extra time which can slow the transmission delay. Finally, in some data centers, ceiling can be used to house pipes and cables. So, it will not be easy to install reflectors.
FIGURE2.16: 3D beam-forming.
2.5.3 Optical designs
• C-Through (HyPaC)[40] is a topology that combines a traditional tree-based network and an optical circuit network to connect the ToR switches. C-Through is composed of two components: control plane and data plane. The control plane estimates the traffic between racks and defines the new circuit to send the load. The data plane isolates the optical and the Ethernet networks and de-multiplexes the load into the calculated routes. The optical routes have the priority over the electrical routes be-cause they offer a higher capacity to the data center. However, optical links can be costly to the network.
FIGURE2.17: Hypac topology.
2.5.4 Green data centers
Minimizing the power consumption of the network equipment is the target of all net-work operators whatever is the type of their systems: Radio netnet-works[41] , sensor networks[42][43], backbone networks[44], data center networks[45],... In this context, many efforts to build a green data center have been conducted recently in both indus-try and academia. A short review of the most promising approaches in this field is summarized as follows:
2.5.4.1 Usage of renewable sources of energy
This approach exploits the green resources such as water, wind, solar energy, pumps and heat to reduce the budget related to energy. For example, authors in [46] proposed to make all data center devices almost powered entirely by the renewable energy. To re-alize a testbed, they added temperature and humidity sensors, solar powered systems and wind power systems to a data center. Using this method, they obtained a success-ful results and witnessed the launch of several international collaborations including the US Greenlight and the New York State Energy Research. Another proposal to intro-duce the green energy in DCs is the net-zero networks[47]. This new concept consists of producing an amount of energy per day that is equal to the same amount of energy consumed by the network. The renewable energy is used nowadays by big companies such as Google[48] and Facebook[49]. However, the renewable energy sources used to power the network are limited by several factors such as the weather conditions and the location of the data center, in addition to the high cost of the infrastructure to generate the power and deliver it.
2.5.4.2 Energy aware hardware
This method focuses on making the energy consumed by switches and servers propor-tional to the traffic load. To achieve this, some specific techniques are applied such as vary-on/vary-off (VOVO)[45]. Workloads in VOVO are concentrated in a subset of servers instead of distributing it across all servers which ensures more energy effi-ciency. Another technique is the Dynamic Voltage (DVFS)[50] where the CPU power is adjusted depending on the arriving load. The idea is based on the fact that the power in the chip is proportional to V2.f, where V is the voltage level and f is the frequency. This ensures that the power consumption of a chip is proportional to the workload. However, these approaches optimize only the energy consumed by the CPU while the remaining network devices are untouched and are still working on their normal energy level.
2.5.4.3 Energy aware architecture
This relates to the design of a data center that conserves energy thanks to its architec-ture. CamCube[35] is designed to interconnect servers directly without intermediate switches (switchless networks, see section 2.5.1.2). This type of topologies saves en-ergy consumed by switches, racks and associated cooling machines. Another example is the Nano data centers[51], where services and content are stored in the home gate-ways instead of being stored in data centers. To access to the content in the gategate-ways, a P2P infrastructure is used. This approach can only be applied to a small sized network and needs more investigation to be feasible in a real data center network. Wireless data center topologies[36][37] are also an attempt to minimize the energy consumption. In fact, by relying on transceivers with a minor energy consumption compared to switch interfaces[1], communications are delivered without wasting a huge amount of energy.
2.5.4.4 Usage of virtual machines technology
The virtualization technology is based on creating multiple virtual machine (VM) in-stances on a single physical server[52][53]. VM can act like a real machine with an operating system. Thus, by powering only one device while multiple machines are pro-cessing, the amount of hardware in use is reduced, the resource utilisation is improved and the energy consumed is optimized. Recently, virtualization tools are available to test and use by some vendors such as VMware[54]. GreenCloud[55] is one of the op-timisations used for migration and placement of virtual machines in data centers. In this project, the authors studied the workloads of the applications in cloud networks.
Depending on the workloads, they proposed algorithms for mixing and mapping vir-tual machines to the existing resources while considering the QoS (Quality of Services) requirements and energy efficiency. The GreenCloud approach consists of two phases. The first one deals with the collection of new demands and the second one is to opti-mize the allocation of the VM on physical machines depending on the demands. Then, idle machines are turned off.
2.5.4.5 Routing level power aware approaches
This type of approaches aims at saving the energy consumed by the idle devices that are not included in the traffic but are still wasting energy. In fact, it is based on a power aware algorithm that consolidates the traffic flows, restricts the network to a subset of devices and powers off the idle ones. These approaches are applied at first to a general network. Among these contributions, the following works proved their efficiency to reduce the energy consumption by switching off the idle nodes.
• The authors of [44] proposed a greedy heuristic to switch off nodes and links in a backbone network in order to minimize its power consumption. In this way, during the low load hours, the small traffic can be routed on a defined subset of the network and a large number of nodes can be switched off while respecting connectivity and QoS constraints. The heuristic starts by considering that all elements of the network are powered on. Then, it iterates on network elements to define which ones to switch off. At each step, the traffic passing by the candidate node to power off is rerouted us-ing a calculated shortest path and the links utilization are checked to respect the QoS thresholds. If the constraints are not violated, the selected nodes/links are switched off. Several policies such as random (R), least-link (LL), least-flow (LF) and opt-edge (OE) policies can be adopted to sort the node set and reduce the iteration complexity. The R sorts the nodes randomly. Then, LL re-sorts the nodes according to the num-ber of links connected to them. The node with the smaller numnum-ber of links comes first. In the next step, the LF places first the nodes that have the smallest amount of load passing by them. Finally, the OE keeps the nodes source and destination so that they cannot be powered off. But, the links of these nodes can be deactivated as long as one of them is active. The proposed heuristic proved its efficiency on reducing the power consumed by a backbone network. However, this method can reduce ag-gressively the redundancy of the network and in case of failure, the communication can not instantly be rerouted to other paths. In addition, even though the heuris-tic reduces the complexity of choosing the set of nodes to power off, searching the shortest and available paths for all the flows is still a complex task that takes time and can enlarge the latency of the communications.
• Authors of [56] propose a new ECO-friendly routing algorithm named ECO-RP based on the open shortest path first protocol (OSPF)[57]. OSPF is a well-known routing protocol that calculates shortest paths based on links weights assigned by the net-work operator. These weights are generally fixed. It means changing the routes according to the traffic loads is not considered by the OSPF protocol. In the new pro-posed protocol, new entities called ECO-RP are introduced in each network device. Their role is to check the traffic forwarded by the device and send the information to the other entities. In this way, every ECO-RP has an overview about the net-work traffic and can change OSPF link weights according to the traffic status. If the traffic is low, the entity changes the links weights so that traffic is rerouted through other paths and a subset of the network can be powered off. Hence, unlike OSPF, the new protocol changes the network routing based on the network traffic. In ad-dition, in the standards of OSPF, the sleeping nodes are considered as failures and their information are removed. However, ECO-RP can distinguish between failed and sleeping nodes. To manage the ECO-RP protocol capabilities, many messages and databases are used including Network State Advertisement (NSA) that checks the traffic periodically, Network State Database (NSDB) that collects the traffic status from all entities and Historical Link State Database (HLSDB) that distinguishes be-tween failures and sleeping nodes. The new protocol proved its efficiency to reduce energy consumption while maintaining the performance of the network. However, the energy consumption is not very big reaching at maximum 18%.
• The authors of [58] propose a distributed routing protocol named Distributed Rout-ing Protocol for Power SavRout-ing (GDRP-PS) to save energy in the core networks by putting idle routers into sleep mode while maintaining the network connectivity and the QoS constraints. During the high loads, this algorithm is not applied so that the performance is not deteriorated. In the low loads, GDRP-PS can impose the sleeping mode on idle routers. In addition, this algorithm focuses only on the core routers because the edge routers are connected to final users and can send or receive data at any time. Also, a part of core routers called traditional routers will stay always powered on and will use the traditional network routing distribution (e.g. OSPF). The other set of routers, called power saving routers (PSR), can switch from work-ing to sleepwork-ing mode. The GDRP-PS coordinator detects the status of the network and impose the mode of the PSRs. In fact, each PSR checks if the network will still connected when it is sleeping. Then, it sends a message to the coordinator to ask for mode switching. If it can go to sleeping, it rebuilds its routing table and switches off for a certain period. If not, it waits for a fixed time and asks the coordinator again. While the PSR is sleeping, it can wake up again either if the period ends or if it receives a wake up message from the coordinator. GDRP-PS proved that it can

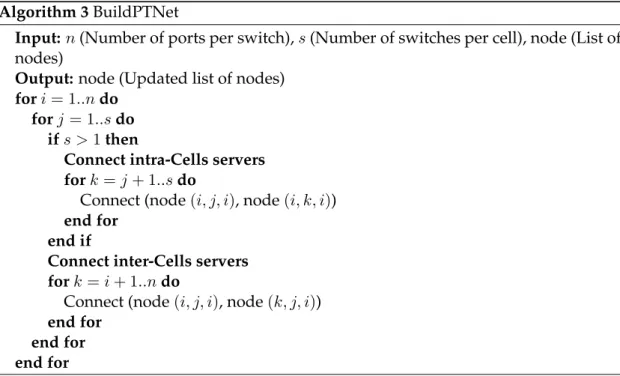

![Table 3.8 shows the path distribution of 1200-servers-PTNet (n = 20, s = 3). We can see that the paths length does not exceed 5 and routes lengths ∈ [1,2,3,4,5].](https://thumb-eu.123doks.com/thumbv2/123doknet/14565238.726739/77.893.214.724.820.975/table-distribution-servers-ptnet-length-exceed-routes-lengths.webp)