HAL Id: halshs-00431044
https://halshs.archives-ouvertes.fr/halshs-00431044
Submitted on 10 Nov 2009
HAL is a multi-disciplinary open access archive for the deposit and dissemination of sci-entific research documents, whether they are pub-lished or not. The documents may come from teaching and research institutions in France or abroad, or from public or private research centers.
L’archive ouverte pluridisciplinaire HAL, est destinée au dépôt et à la diffusion de documents scientifiques de niveau recherche, publiés ou non, émanant des établissements d’enseignement et de recherche français ou étrangers, des laboratoires publics ou privés.
The Real Effect of Financial Crises in the European
Transition Economies
Davide Furceri, Aleksandra Zdzienicka-Durand
To cite this version:
Davide Furceri, Aleksandra Zdzienicka-Durand. The Real Effect of Financial Crises in the European Transition Economies. Economics of Transition, Wiley-Blackwell, 2011, 19 (1), pp. 1-25. �halshs-00431044�
DOCUMENTS DE TRAVAIL - WORKING PAPERS
W.P. 09-20
The Real Effect of Financial Crises in the European
Transition Economies
Davide Furceri, Aleksandra Zdzienicka
Novembre 2009
GATE Groupe d’Analyse et de Théorie Économique UMR 5824 du CNRS
93 chemin des Mouilles – 69130 Écully – France B.P. 167 – 69131 Écully Cedex
Tél. +33 (0)4 72 86 60 60 – Fax +33 (0)4 72 86 60 90 Messagerie électronique [email protected]
Serveur Web : www.gate.cnrs.fr
GATE
Groupe d’Analyse et de Théorie
Économique
The Real Effect of Financial Crises in the European Transition
Economies
1Davide Furceri
OECD and University of Palermo
ϒAleksandra Zdzienicka
GATE-CNRS, University of Lyon
∞Abstract
The aim of this work is to assess the impact of financial crises on output for 11 European transition economies (CEECs). The results suggest that financial crises have a significant and permanent effect, lowering long-term output by about 17 percent. The effect is more important in smaller countries, with relative higher dependence on external financing, and in which the banking sector noticed more important financial disequilibria. We also found that fiscal policy measures have been the most efficient tools in dealing with the crises, while the role of monetary policy instruments has been rather blinded. Exchange rate resulted to be more a propagator than a crises absorber, while the IMF credit has been found to have positive (but not significant) impact on growth performance. Finally, the effect for the CEECs is much bigger than in the EU advanced economies, for which we found that financial crises lowers long-term output only by 2 percent.
Keywords: Output Growth, Financial Crisis, CEECs.
JEL: G1, E6
The views expressed in this paper are those of the authors and do not necessarily represent those of the OECD
or its member countries.
ϒMailing address: OECD, 2 rue André-Pascal, 75775 Paris CEDEX 16, Email: [email protected]. ∞University of Lyon, Lyon, F-69003, France; University of Lyon 2, Lyon, F-69007, France; University of Lyon
1, Lyon, F-69003, France; CNRS, UMR 5824, GATE, Ecully, F-69130, France; ENS LSH, Lyon, F-69007, France; Centre Leon Berard, Lyon, F-69003, France.
Corresponding author: Aleksandra Zdzienicka: GATE/ENS-LSH, 15 parvis Rene Descartes, R1 34, BP 7000 69342 Lyon CEDEX, Email: [email protected].
1. Introduction
The current financial crisis that started to spread over the world in 2007 has led to a rapid and sharp deterioration of economic activity. The severity of this impact has brought once again the discussion about the real economic effects of financial crises. In the literature, only few studies report no or modest permanent impacts of financial crisis on economic output2 (Hutchison, 2001; Boyd et al., 2005) and in general these findings concern developed economies under minor crises. Traditionally, financial crises are associated with severe economic downturns (Reinhart and Rogoff, 2009).
The propagation channels of financial crises on the real economy pass from a sharp currency depreciation through wealth effects and aggregate demand, through increasing imported factors prices and production costs. Financial crises affect also private agents’ behavior, increasing uncertainty about future gains and decreasing the level of investment and consumption. Other important channels of crises propagation work through the banking system by disturbing the process of credit intermediation, and in the payment system by decreasing collateral values. 3
These real effects seem to be more important and persistent in emerging countries. In fact, developing economies are more vulnerable to the factors that lead to crises, such as: banks and private agents exposure to currency and maturity mismatch, disruption in international capital markets, banks panic (Chang and Velasco, 1998) and “sudden stops” in capital inflows (Calvo, 2006). The empirical findings in the literature corroborate this thesis
2 Some traditional views on the real effect of (currency) crises suggest that, under the existence of nominal
rigidities, the real depreciation increases exportations and stimulates employment and output. For example, Demirgüç-Kunt et al. (2006) find a positive impact in the case of 40 percent of the currency crises taken under consideration.
3 See for example the “Financial accelerator theory” in Bernanke and Gertler (1989), Kiyotaki and Moore
and suggest that the effect of financial crises on economic activity in developing countries is bigger and more persistent than in developed economies.4
In this context, the European transition economies (CEECs hereafter) constitute a very interesting group of countries. Indeed, despite increasing similarities to developed economies they still show important features of emerging markets. In addition, structural reforms, which could enhance the degree of resilience in these economies, are far to be completed making thus more likely that the effect of financial crises would be important and persistent.
The main objective of this work is to analyze the effect of financial crises on real output for 11 CEECs’ economies. In doing so, we follow the methodology initiated by Romer and Romer (1989) to assess the impact of monetary shock on output. More precisely we estimate an autoregressive with distributed lags (ADRL) equation of financial crises and output growth, and we derive the corresponding impulse response functions for real output. This method completes previous attempts to measure the output cost of the crises assessing their short- and long-term impact. In fact, traditional approaches (initiated by Kaminsky and Reinhart, 1999; Calvo and Reinhart, 2000) consist of output regressions including several controls, contemporaneous and lagged variables (real growth, real GDP per capital) and financial crises in a panel of developed and emerging economies.5 Cerra and Sexana (2008) were the first, to our knowledge, to add impulse response functions to distinguish between the short-term and the long-term impact of currency and banking crisis on real GDP. The same methodology was used by Furceri and Mourougane (2009) to assess the impact of financial
For example, Hutchison and Ilan (2005) analyzing the impact of currency and banking crises for a large set of
countries find that while in a sample of 24 emerging economies real output contraction reaches 8 percent and last 2 years, when developed countries are included in the study the reduction in output is about 2 percent during only one year. Similarly, Dell’Ariccia et al. (2008) find that the real effect of banking crises is about 1.5 percentage point bigger for developing countries. Moreover, the recent Reinhart and Rogoff’s (2009) historical analysis underlines that a decline in real GDP is greater and more persistent for emerging than developed countries.
5 See, for example, Milesi-Ferretti and Razin, 1998; Barro, 2001; Bordo et al., 2001; Hutchison, 2001; Huichison
crises on potential output for a panel of 30 OECD economies, and more recently by the European Commission to assess the potential output and potential growth effect of financial crises (European Commission, 2009).
Our approach completes and improves exiting studies by:
1. Using two different methodologies to identify financial crises. First, we construct a market pressure index (MPI) that takes into account the pressure in the real exchange rate and in foreign exchange reserves, and which accounts for several financial (mostly currency) crises. Second, we use the recent IMF crises database (Leaven and Valencia, 2008) to construct a dummy in correspondence of financial (banking, debt and currency) crises. Finally, given the importance of the ongoing financial crisis for the CEEC economies, we include it to both indexes as starting in 2007.
2. Comparing the real effects of financial crises between the CEEC economies and advanced European countries (EU-15 hereafter).
3. Controlling for structural heterogeneity and the role of macroeconomic policy response.
The rest of the chapter is organized as follows. Section 2 describes methodological and data issues. Section 3 presents the results and Section 4 concludes.
2. Methodology and Data
To assess the impact and persistence of financial crises occurrence on output we follow the methodology proposed by Romer and Romer (1989). In particular, the approach consists of estimating and ADRL (4, 4) equation and to derive the relative impulse response functions:
where y is output, D is a dummy variable, which takes value equal to one in case of a financial crisis occurrence and zero otherwise, are country fixed effects to control for unobservable
countries specific characteristics and is the error term. The numbers of lags has been
tested, and the results suggest that the inclusion up to 4 lags produces the best specification. We correct for heteroskedasticity, when this is the cases, using White robust standard errors, while the problem of autocorrelation related to our dependent variable is solved using their lags as explanatory variables.
The impulse response functions (IRFs) are obtained by simulating a one year crisis and by computing the response of output over time trough the estimated coefficients. In particular, the simultaneous response will be , the one-ahead cumulative response will be
, and so on. Then, 95-percent level confidence bands are derived using Monte-Carlo simulations using one thousand of trials.
Since we are also interested in the role of structural and macroeconomic policy variables on growth performance during times of crises, we re-estimate equation (1) adding interactions terms between the above-mentioned variables, crises occurrence and lagged output growth. The expanded specification is then:
where stands for structural or macroeconomic policy variables, and capture,
respectively, the effects of on output persistence and on the direct impact of financial
crises on output. The parameter captures the impact of control variables on output. In all,
the simultaneous impact of the crisis on output as measured by the impulse response functions will be , the one-ahead cumulative response will be
To deal with the endogeneity issue, since some control variables can be affected by the crisis occurrence, we often consider their lagged values. In addition, to capture the impact of some macroeconomic policy measures, such as changes in government spending or in interest rate, we focus on their value after the crises onset.
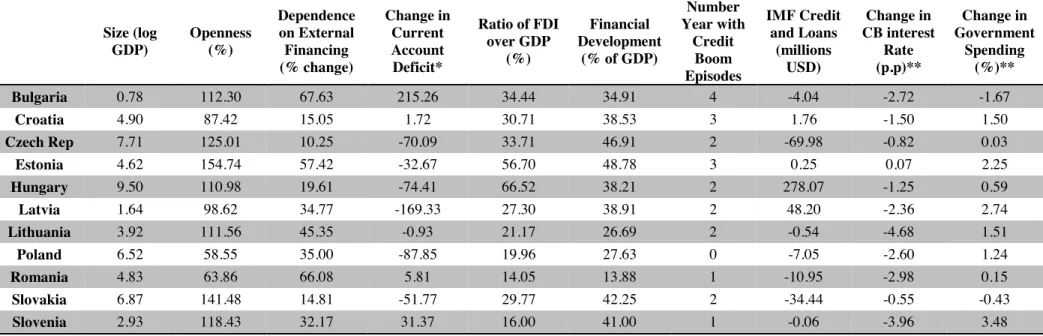
All data are taken from the IMF International Statistics and World Economic Outlook database, except for government spending and central banks interest (REFI) rates that come from OECD Economic Outlook 85 (2009) and central banks statistics. The dataset consist of an unbalanced panel of annual observations from 1989 to 2008 for 11 CEECs’ economies (Bulgaria, Croatia, the Czech Republic, Estonia, Hungary, Latvia, Lithuania, Poland Romania, Slovakia and Slovenia).6
Financial crises episodes are identified using two approaches.7 The first is based on the work by Valencia and Leaven (2008), which list financial crises (currency, debt and banking crises) for all the countries in our sample from 1970 to 2007. The current financial crisis is assumed to have taken place in 2007. The second approach is the market pressure index (MPI). Since currency crises are usually associated with severe pressure on the domestic currency, we follow the approach used by Kaminsky et al. (1998) and we adopt a criterion for the definition of a crisis that accounts for both pressures occurring in the real effective exchange rate market (REER) and diminishing official foreign exchange (FX) reserves.8 In particular, the crisis occurs when the indicator is standard deviations above its mean. We
6 The EU-15 countries included in the analysis as comparison are: Austria, Belgium, Denmark, France, Finland,
Germany, Greece, Italy, Ireland, Luxembourg, the Netherlands, Portugal, Spain, Sweden and the United Kingdom.
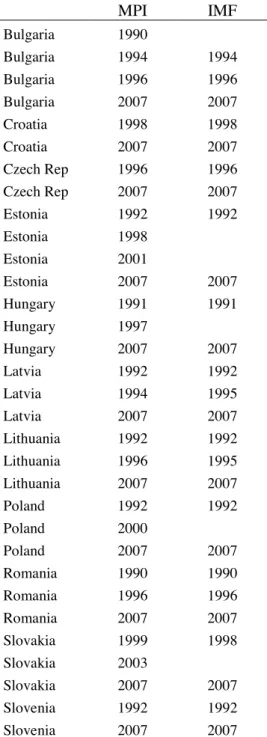
See Table1 for a detailed description of crises episodes.
The reason that we use the real exchange rate – rather than the nominal one - is that it gives a more realistic view of crises episodes in the CEECs economies since these countries have adopted many different exchange rate regimes since the beginning of their transition process. We use REER and official FX reserves quarterly data from the IMF database. Credit boom episodes are identified on the basis of excessive banking credit growth comparing to a country financial sector and economic development (Zdzienicka, 2008).
adopt a grid-search methodology which consists of seeking a value of in the interval [0, 3]9 which best reproduces the historical crises of the countries under exam. Using this methodology, we find that the value of 1.5 correctly identifies major crises in CEECs.10
3. Empirical Analysis 3.1. Baseline
Basic Results
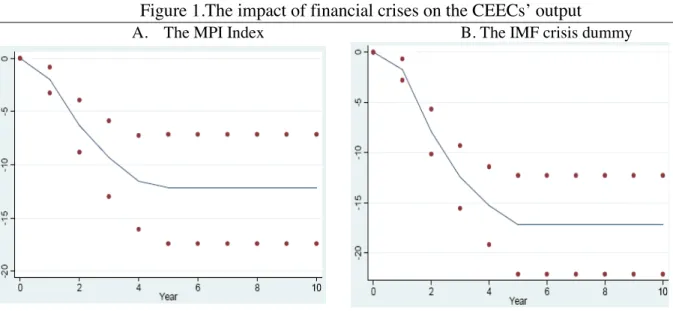
We start by estimating equation (1) using both the MPI index and the IMF financial crisis dummy. The results of these regressions are presented in Table 2. Looking at the table we can see that both financial crises dummies have a significant contemporaneous effect on growth. Moreover, while in the case of the MPI index the first and the third lags are statistically significant, in the case of the IMF dummy all lags are statistically significant. These results, together with the significant persistence of output growth, imply that the occurrence of a financial crisis may have long lasting effects on output. This is confirmed by the impulse response functions derived by the estimated coefficients presented in the table. In particular, when our MPI is applied (Figure 1a), a financial crisis lowers output by 14 percent in the long-run. The impact is even greater with the IMF crisis indicator, for which the cumulative output loss is close to 18 percent (Figure 1b). This is consistent with the finding that the impact of banking and twin (currency and banking) crises on output is bigger than the one of currency crises (Kaminsky and Reinhart, 1999; Goldstein et al., 2000; Cerra and Saxena, 2008).
Robustness check and endogeneity test
To check for the robustness of our results, we replicate this empirical exercise including other time shocks (time dummies) and oil shocks (oil price). The results even in this
9 The conventional choice of is between 2.5 and 3 (Edison, 2003). 10 Using the same method, we set the value at 2 for the EU-15 countries.
case are statistically significant and suggest that the financial crises have permanent effects on output. In detail, we find that, even if the impact of other shocks has a significant effect on annual growth, financial crises continue to have a negative short and long-term impact on output. The cumulative lost is however lower and accounts for 8 percent in the case of the MPI (Figure 2a) and 15 percent in the case of the IMF indicator (Figure 2b).
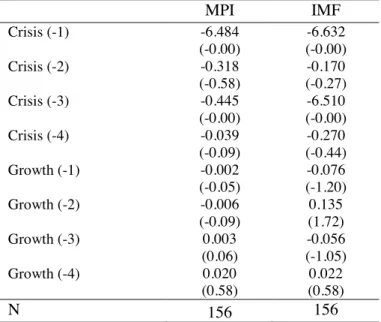
Subsequently, we control for the endogeneity of financial crises dummies. In fact, it is possible that economic slowdowns lead to crises onset, and in that case our OLS estimation will be biased and inconsistent. However, the GMM estimations using the MPI (Figure 3a) and IMF index (Figure 3b) report an almost identical impact than that obtained with the OLS method. As additional test, the Probit estimates of the probability of a crisis as a function of past growth performance and previous financial crises corroborates the absence of endogeneity bias (Table 3).11
Are financial crises more pernicious in the EU transition economies?
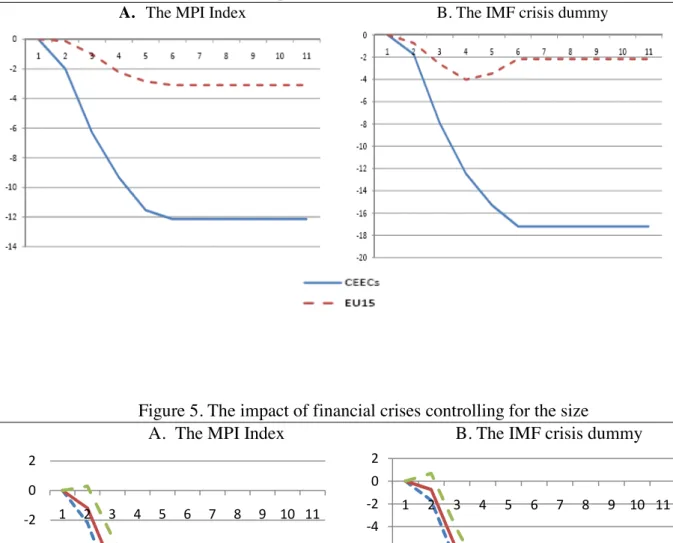
We test whether CEEC countries are more resilient to financial crises than other EU countries. To this purpose we estimate equation (1) for the EU-15 for the period 1980-2008. When we compare the results between CEEC and EU-15 countries, we can see that impulse functions show a bigger and more persistent effect in the case of the CEECs’ economies. More precisely, with the MPI (Figure 4a) the short-term effect of financial crisis on the EU-15 output is negligible while in the CEECs output decreases by 2 percent. The long-term crisis impact in the EU-15 is greater than the one in the short-run (almost 3 percent of cumulative loss), but still much less important than in the CEECs – 12 percent. The estimates based on the IMF indicator (Figure 4b) confirm the significance of both short and long-term effects of financial crisis. However, while the short-term effect is less important in the CEECs, the
11 The endogeneity and omitted variables test carried out for the actual EMU members confirms the
predominance impact of financial crisis on growth rate and the validity of the exogeneity assumption. Results are available from the authors upon request.
crises impact on output is more visible in the EU-15 (1 percent loss). In the long -term, output in the EU-15 countries recovers and the cumulative loss stabilizes at 2 percent.
In all, the output loss associated to financial crises in the EU-15 countries is about 1-2 percent in the short-term. In the long-term, the crisis impact on the CEECs is much more important and persistent than in the EU-15 countries. These results are in line with previous findings. For example, according to European Commission, the European countries growth rate will be reduced by a half in the short-term. In the long-term, the impact on potential growth is supposed to be more persistent in the case of CEECs. In fact, given the crisis implications on the growth components (investment, structural unemployment, factors productivity), the long-term reduction in growth rate is expected to reach 3.8 percent in the EMU countries and almost 7 percent in CEECs.
3.2. Macroeconomic Features and Policy Variables
So far, we have studied how financial crises affect the output performance in the CEECs’ economies. Now, we attempt to determine whether countries’ structural heterogeneity and macroeconomic policy variables play a role in shaping the impact of financial crises. More precisely, we explore the role of country size, openness, dependence on external financing, current account disequilibria, FDI inflows, financial development, credit boom, and a set of macroeconomic policy variables (exchange rate regime, government spending, monetary policy rates, and IMF aid). 12
Size and Openness
First, we examine whether the size of the economy and its openness affect the impact and persistence of financial crises on output growth. It is reasonable to think that smaller economies are more exposed to external shocks (Aghion et al., 1999), since they are less
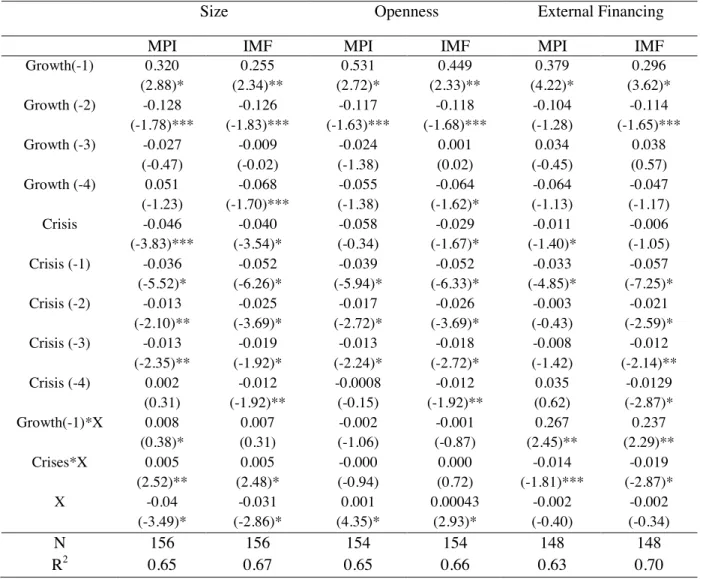
diversified and face resources constraints. It is also reasonable to assume that in economies with a higher degree of trade openness, that are per se more exposed to external shocks (Rodrick, 1998), the impact of financial crises may be more important. However, while our results indicated that the impact of financial crises decrease with the size of the economy (Table 5), trade openness (measured as the GDP share of total exports and imports) is found to be not statically significant (Table 5). This “puzzling” findings for trade openness is also reported by other studies (Cerra et al., 2009), and may be partially explained by the reduced effect of fiscal stimulus in open economies.
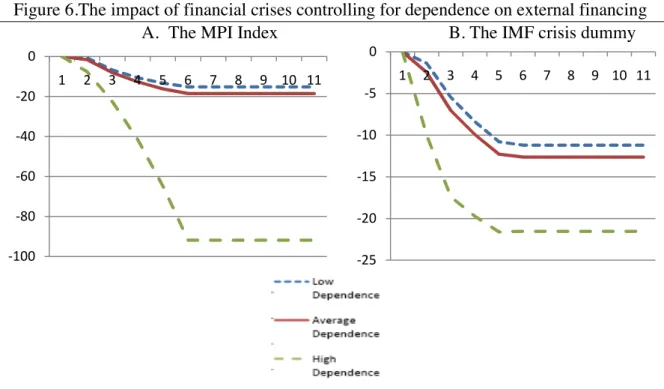
When we analyze the effect of the crises controlling for the size of the economy the impact is lower for the countries in which the size exceeds the sample median. More precisely, with the MPI index (Figure 5a) the short-term and long-term effects of financial crises on output are respectively about 1 and 9.5 percent for the bigger countries, while for the smaller ones these losses are respectively about 2 and 10.5 percent. The estimates based on the IMF dummy (Figure 5b) produce similar results in the short-run, but the long-term impact is even more important (14 percent) for smaller countries.
External Financing
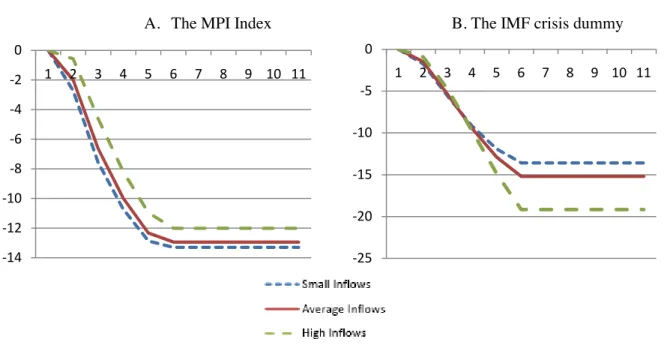
Subsequently, we explore the CEECs’ heterogeneity in terms of dependence on external financing. From a theoretical point of view, we should expect that the more the country depends on external sources in financing its activities the larger will be the effect of financial crises on its growth performance. Indeed, countries relying hardly on external financing have private sector balance sheets more exposed and are more vulnerable to sudden reversals in foreign capital flows. Our results (Table 5) confirm this theory and corroborate previous findings (Braun and Larrain, 2003; Dell’Ariccia et al., 2004; Tong and Wei, 2009). In details, in countries with a higher external financing (the 4th quartile of the foreign banks
liabilities’ dependent distribution), the impact of financial crises on output is at least twice more important than for the countries with average dependence on external financing. In all, a cumulative output loss varies between over 20 (the IMF dummy; Figure 6b) and 90 (The MPI; Figure 6a) percent for the most exposed CEECs.
Current Account Disequilibria and FDI
Dependence on external financing is closely associated with current account disequilibria. In fact, we notice that an increase in the current account deficit in the pre-crisis period amplifies the crises impact. More precisely, the crisis occurrence decreases output about 1 percent in the short-term and 9 percent in the long-run (the MPI; Figure 7). However, albeit our results stay in line with those reported by the literature (Bordo et al., 2001), the impact of growing current account deficit on growth performance seems to be less important and uncertain. Indeed, the difference in output contraction between the countries that noted one-percent point increase and those that noted similar decrease in current account deficit before the crisis onset is less than 0.5 percent. Moreover, with the IMF dummy, the impact of current account disequilibria is not significant (Table 6). This is partially due to the fact that the CEECs’ current account deficit has been largely financed by foreign direct investments that are considered as more stable especially in times of crises (Lipsey, 2001; World Bank 2009). Actually, when we look at the crises impact on growth performance controlling for the change in FDI inflows before the crisis occurrence, we notice that the short-term effect of the crises is less important in the countries that observed an increase of FDI inflows above the sample median.13 However, when the FDI inflows decrease the impact of financial crises on output is about 1.5 percent when the MPI is considered (Figure 8a). The opposite can be seen when we include the IMF dummy (Figure 8b).
Financial Development and Credit Boom
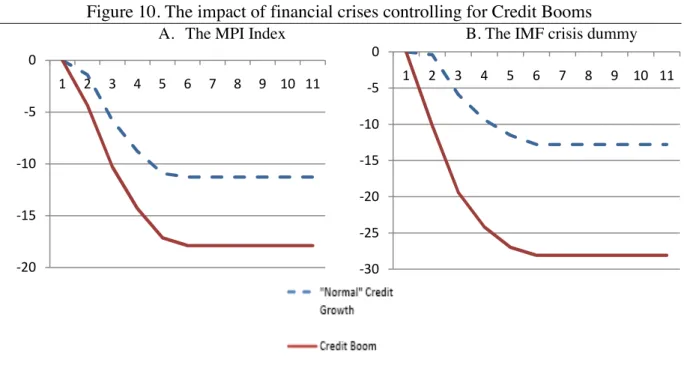
We also examine how financial development affects the impact of the crises on the real economy. A priori, the influence of financial development on growth performance during the times of crises is uncertain. On the one hand, financial development has a positive impact on economic growth through saving and investment channels (Levine, 1997). On the other hand, financial development can increase financial instability leading to unsustainable credit expansion, deterioration of borrower capacity and balance sheets disequilibria, and thus deteriorates economic growth (Bordo et al., 2001). In this context, previous works found a short-term detrimental effect and a long-term positive impact of financial development on growth performance (Loayza and Rancière, 2005). When we look at financial development in the EU transition economies, we remark that the real impact of financial crises is much more important for the countries with financial development above the sample median.14 More precisely, with the MPI (Figure 9a) and the IMF dummy (Figure 9b) the short-term negative effect of financial crises on output is about 2.5 percent for whole sample while the long-term impact for the countries with the highest financial depth (the 4th quintile of the banking credit-to-GDP distribution) is respectively 10 and 15 percent more important. These findings can be partially explained by the fact that financial development in some CEECs’ transition economies can be “excessive” and “unsustainable” comparing to their economic development. As matter of fact, when we test for credit boom, we can observe that the countries that have been characterized by “excessive” banking credit development are more heavily affected by financial crises (Table 6). In detail, for the countries with sustainable credit growth, the short-term impact of financial crises is marginal (the MPI; Figure 10a) or lower than one percent (the IMF; Figure 10b), while the long-term output cumulative loss is respectively 11 and 12.5 percent. For the countries that experienced credit boom in the times of crises, the short- term
effect is respectively 4 and 10 percent, and in the long-run output performance deteriorates about 18 and 28 percent.
Macroeconomic Policy Variables
So far, we have focused on the CEECs’ structural heterogeneity in explaining the impact of financial crises on output, but macroeconomic policy variables can influence the impact and persistence of financial crises. Here, we examine the effect of the following variables: exchange rate regime, changes in government spending and in central bank policy rates, and foreign aid approximated by the International Monetary Fund credits and loans.
Firstly, we analyze the impact of exchange rate regime on growth performance after the crisis onset. Traditionally, the flexible exchange rate regimes are reported to perform better during financial crises (Kaminsky and Reinhart, 1999; Goldstein et al. 2000, Cerra et al., 2009). Indeed, it is reasonable to think that under flexible exchange rate regime the monetary authorities are less financially constrained and dispose of at least one more policy instrument to deal with the crisis (Tong and Wei, 2009). Our results reported in Table 7 partially confirm these findings. However, while flexible exchange rate attenuates the impact of crises as measured by the MPI, fixed exchange rate regimes perform better under financial crises detected by the IMF dummy. More precisely, with the MPI (Figure 11a) flexible exchange rate decreases the impact of the crises on output about 1.5 percent in the short-term and over 2 percents in the long-run. The estimates based on the IMF dummy (Figure 11b) report a marginal impact of financial crises on output in the short-term, but thecumulative output loss is over 4-percents less important when a country operates under fixed exchange rate. We can find two possible explanations for this finding. On the one side, a fixed exchange rate regime was adopted successively in CEECs at the beginning of their transition period as a part of stabilization programs and with the aim to gain the foreign investors trust. On the other
side, fixed exchange regime, by eliminating currency risk, attenuates the financial vulnerabilities linked to the CEECs’ dependence on external financing.
When we look at the fiscal policy variable in transition economies, we notice a positive and significant effect of government spending increase on growth performance (Table7).15 More precisely, with the IMF dummy (Figure 12b), the short-term effect of financial crises is marginal for the countries where the change in government spending is above the sample median and the long-term impact is 2- percents less important than for the countries with no change in government spending. When we use the MPI methodology (Figure 12a), the effect of fiscal stimulus is more delayed in the time, but the long-term impact of government spending is as much as important.
In the case of monetary policy, the effect on growth performance during periods of crises is less obvious, especially for developing economies. On the one hand, there is not unique recommendation concerning the monetary authorities’ actions. Some economists advocate in favor of the interest rate increase to defend the currency and attract foreign capitals back into the country, while others encourage the opposite action to stimulate the economy (Krugman, 1999; Christiano et al., 2002). On the other hand, the impact of monetary stimulus on growth performance also remains uncertain. More precisely, while a positive impact is reported for industrialized economies, for developing countries the monetary policy have only weak influence on economic growth (Romer and Romer, 1989; Cerra et al., 2009). For the CEEC economies we report a positive impact of changes in central bank interest rate on economic growth after the crisis onset (Table7). In details, with the MPI (Figure 13a) and IMF dummy (Figure13b), a decrease in interest rate starts to influence output only after the 5
15
Previous findings corroborate a positive impact of fiscal stimulus on growth recovery in developing and
periods and the impact of one percentage point decrease in interest rate accounts for less than 0.5-percent increase in output.
Finally, the last variable that we analyze is the IMF credit and loans. There is a large body of the literature debating about the impact of foreign aid on economic activity in times of crises. Some authors underline their positive impact on growth recovery (Eichengreen and Rose, 2003; Lee and Park, 2003), while others find no significant effect (Honoham and Klingebiel, 2003; Cerra et al. 2009). In the case of transition economies, the impact of foreign liquidity support is not significant (Table7). This can be partially due to the reticence of national authorities to ask about the foreign financial aid just after the onset of the crisis. The ongoing financial crisis seems to be the exception, but it is too early to assess effects of the recent IMF aid on the CEECs’ growth performance.
4. Conclusions
The aim of this research is to evaluate the short- and long-term impact of financial crises on output in the CEEC economies by estimating an autoregressive with distributed lags (ADRL) equation of financial crises and output growth and deriving the relative impulse response functions for real output.
The main results of the paper can be summarized as follows:
1) Financial crises have a significant impact on output both in the short and in the long-run. In particular, financial crises are found to lower output by 1 percent after one year, and by 17 percent after 5 years. The impact of currency crises is relatively less important (12 percent).
2) Comparing the effect of financial crises between the CEEC and the EU-15 economies, our results suggest that the effect is more important for the CEECs.
3) Controlling for structural heterogeneity among CEECs, the impact of financial crises is more important for smaller countries, with greater dependence on external financing, where the banking sector shows greater disequilibria (dominance of foreign sources of financing, excessive credit growth), and whose current account deficit is lower and less financed by the FDI inflows.
4) The impact of financial crises on growth performance is mostly influenced by fiscal policy (in terms of increase in government spending), while the effect of monetary policy is rather limited. Exchange rate can amplify the real effect of financial crises on the CEECs’ economies. Moreover, the impact of foreign financial aid, albeit positive, has been found to be not significant.
In lights of these findings, the claim that these countries could be better off in joining the EMU in the very short-term may be only partially true. In fact, on the one hand the monetary integration process could favor other reforms that would increase the resilience of these economies to external shocks (Duval, 2008). On the other hand, even if the principal role in crises absorption belongs to fiscal policy, the large worsening of public finances would make domestic monetary and exchange rate policy the only (independent) tool to face the current and future significant output loss.
Figure 1.The impact of financial crises on the CEECs’ output
A. The MPI Index B. The IMF crisis dummy
Figure 2.The impact of financial crises controlling for other shocks
A. The MPI Index B. The IMF crisis dummy
Figure 3.The impact of financial crises-GMM
Figure 4.The impact of financial crises: CEECs vs. EU-15
A. The MPI Index B. The IMF crisis dummy
Figure 5. The impact of financial crises controlling for the size
A. The MPI Index B. The IMF crisis dummy
Figure 6.The impact of financial crises controlling for dependence on external financing
A. The MPI Index B. The IMF crisis dummy
Figure 7.The impact of financial crises controlling for changes in current account deficit in the pre-crisis period (MPI index).
Figure 8.The impact of financial crises controlling for FDI inflows in the pre-crisis period
A. The MPI Index B. The IMF crisis dummy
Figure 9.The impact of financial crises controlling for the degree of financial deepening
A. The MPI Index B. The IMF crisis dummy
Figure 10. The impact of financial crises controlling for Credit Booms
A. The MPI Index B. The IMF crisis dummy
Figure 11. The impact of financial crises controlling for exchange rate regime
A. The MPI Index B. The IMF crisis dummy
Figure 12.The impact of financial crises controlling for changes in government spending
A. The MPI Index B. The IMF crisis dummy
Figure 13.The impact of financial crises controlling for changes in policy rate
A. The MPI Index B. The IMF crisis dummy
Table 1. Financial crises episodes.
MPI IMF Bulgaria 1990 Bulgaria 1994 1994 Bulgaria 1996 1996 Bulgaria 2007 2007 Croatia 1998 1998 Croatia 2007 2007 Czech Rep 1996 1996 Czech Rep 2007 2007 Estonia 1992 1992 Estonia 1998 Estonia 2001 Estonia 2007 2007 Hungary 1991 1991 Hungary 1997 Hungary 2007 2007 Latvia 1992 1992 Latvia 1994 1995 Latvia 2007 2007 Lithuania 1992 1992 Lithuania 1996 1995 Lithuania 2007 2007 Poland 1992 1992 Poland 2000 Poland 2007 2007 Romania 1990 1990 Romania 1996 1996 Romania 2007 2007 Slovakia 1999 1998 Slovakia 2003 Slovakia 2007 2007 Slovenia 1992 1992 Slovenia 2007 2007
Table 2.The effect of financial crises on output- OLS
MPI IMF Growth (-1) 0.476 (4.26)*** 0.329 (4.68)*** Growth (-2) -0.255 (-2.29)** -0.121 (-1.70)* Growth (-3) 0.038 (0.38) 0.022 (0.40) Growth (-4) -0.036 (-0.48) -0.043 (-1.10) Crisis -2.602 (-2.92)*** -1.729 (-3.26)*** Crisis (-1) -2.109 (-2.10)** -5.621 (-6.78)** Crisis (-2) -0.431 (-0.47) -2.700 (-3.85)*** Crisis (-3) -1.440 (1.84)* -2.069 (-3.19)*** Crisis (-4) 0.456 (0.60) -1.453 (-2.38)** N 156 156 R2 0.73 0.63
Note: t- statistics in parenthesis. ***,**,* denote significance at 1%,5% and 10%, respectively.
Table 3.The effect of past growth on the probability of financial crisis (Probit)
MPI IMF Crisis (-1) -6.484 (-0.00) -6.632 (-0.00) Crisis (-2) -0.318 (-0.58) -0.170 (-0.27) Crisis (-3) -0.445 (-0.00) -6.510 (-0.00) Crisis (-4) -0.039 (-0.09) -0.270 (-0.44) Growth (-1) -0.002 (-0.05) -0.076 (-1.20) Growth (-2) -0.006 (-0.09) 0.135 (1.72) Growth (-3) 0.003 (0.06) -0.056 (-1.05) Growth (-4) 0.020 (0.58) 0.022 (0.58) N 156 156
Table 4.The sample means of structural and macroeconomic policy variables
Size (log GDP) Openness (%) Dependence on External Financing (% change) Change in Current Account Deficit* Ratio of FDI over GDP (%) Financial Development (% of GDP) Number Year with Credit Boom Episodes IMF Credit and Loans (millions USD) Change in CB interest Rate (p.p)** Change in Government Spending (%)** Bulgaria 0.78 112.30 67.63 215.26 34.44 34.91 4 -4.04 -2.72 -1.67 Croatia 4.90 87.42 15.05 1.72 30.71 38.53 3 1.76 -1.50 1.50 Czech Rep 7.71 125.01 10.25 -70.09 33.71 46.91 2 -69.98 -0.82 0.03 Estonia 4.62 154.74 57.42 -32.67 56.70 48.78 3 0.25 0.07 2.25 Hungary 9.50 110.98 19.61 -74.41 66.52 38.21 2 278.07 -1.25 0.59 Latvia 1.64 98.62 34.77 -169.33 27.30 38.91 2 48.20 -2.36 2.74 Lithuania 3.92 111.56 45.35 -0.93 21.17 26.69 2 -0.54 -4.68 1.51 Poland 6.52 58.55 35.00 -87.85 19.96 27.63 0 -7.05 -2.60 1.24 Romania 4.83 63.86 66.08 5.81 14.05 13.88 1 -10.95 -2.98 0.15 Slovakia 6.87 141.48 14.81 -51.77 29.77 42.25 2 -34.44 -0.55 -0.43 Slovenia 2.93 118.43 32.17 31.37 16.00 41.00 1 -0.06 -3.96 3.48
*Decrease means increase in Current Account Deficit ** Decrease means decrease. Source: IMF, OECD, Central Banks Statics, Authors’s Computations
Table 5.The Impact of Financial Crises on Output controlling for: Size, Openness and External Financing
Size Openness External Financing
MPI IMF MPI IMF MPI IMF
Growth(-1) 0.320 (2.88)* 0.255 (2.34)** 0.531 (2.72)* 0.449 (2.33)** 0.379 (4.22)* 0.296 (3.62)* Growth (-2) -0.128 (-1.78)*** -0.126 (-1.83)*** -0.117 (-1.63)*** -0.118 (-1.68)*** -0.104 (-1.28) -0.114 (-1.65)*** Growth (-3) -0.027 (-0.47) -0.009 (-0.02) -0.024 (-1.38) 0.001 (0.02) 0.034 (-0.45) 0.038 (0.57) Growth (-4) 0.051 (-1.23) -0.068 (-1.70)*** -0.055 (-1.38) -0.064 (-1.62)* -0.064 (-1.13) -0.047 (-1.17) Crisis -0.046 (-3.83)*** -0.040 (-3.54)* -0.058 (-0.34) -0.029 (-1.67)* -0.011 (-1.40)* -0.006 (-1.05) Crisis (-1) -0.036 (-5.52)* -0.052 (-6.26)* -0.039 (-5.94)* -0.052 (-6.33)* -0.033 (-4.85)* -0.057 (-7.25)* Crisis (-2) -0.013 (-2.10)** -0.025 (-3.69)* -0.017 (-2.72)* -0.026 (-3.69)* -0.003 (-0.43) -0.021 (-2.59)* Crisis (-3) -0.013 (-2.35)** -0.019 (-1.92)* -0.013 (-2.24)* -0.018 (-2.72)* -0.008 (-1.42) -0.012 (-2.14)** Crisis (-4) 0.002 (0.31) -0.012 (-1.92)** -0.0008 (-0.15) -0.012 (-1.92)** 0.035 (0.62) -0.0129 (-2.87)* Growth(-1)*X 0.008 (0.38)* 0.007 (0.31) -0.002 (-1.06) -0.001 (-0.87) 0.267 (2.45)** 0.237 (2.29)** Crises*X 0.005 (2.52)** 0.005 (2.48)* -0.000 (-0.94) 0.000 (0.72) -0.014 (-1.81)*** -0.019 (-2.87)* X -0.04 (-3.49)* -0.031 (-2.86)* 0.001 (4.35)* 0.00043 (2.93)* -0.002 (-0.40) -0.002 (-0.34) N 156 156 154 154 148 148 R2 0.65 0.67 0.65 0.66 0.63 0.70
Table 6.The Impact of Financial Crises on Output controlling for: Change in Current Account Deficit, FDI-to-GDP-ratio, Financial development and credit booms
Current account deficit
FDI/GDP Financial
development
Credit booms
MPI IMF MPI IMF MPI IMF MPI IMF
Growth(-1) 0.385 (4.63)* 0.278 (3.67)* 0.368 (4.09)* 0.288 (3.08)* 0.288 (2.75)* 0.232 (2.34)** 0.321 (4.08)* 0.270 (3.70)* Growth (-2) -0.175 (-2.22)** -0.106 (-1.53)* -0.129 (-1.72)*** -0.129 (-1.73)*** -0.128 (-1.65)*** -0.153 (-2.06)** -0.098 (-1.30) -0.114 (-1.67)*** Growth (-3) 0.015 (0.26) 0.133 (2.06)** 0.020 (0.33) 0.023 (0.38) -0.010 (-0.17) 0.067 (1.02) -0.011 (-0.19) 0.028 (0.45) Growth (-4) -0.014 (-0.34) -0.115 (-2.25)** -0.052 (-1.21) -0.069 (-1.55) -0.009 (-0.23) -0.068 (-1.27) -0.032 (-0.81) -0.076 (-1.53)*** Crisis -0.018 (-3.44)* -0.018 (-2.00)** -0.034 (-4.18)* -0.020 (-2.25)** -0.010 (-0.89) -0.005 (-0.41) -0.014 (-2.48)* -0.003 (-0.39) Crisis (-1) -0.023 (-4.29)* -0.049 (-5.82)* -0.038 (-5.45)* -0.032 (-5.23)* -0.039 (-5.63)* -0.053 (-6.13)* -0.039 (-5.83)* -0.054 (-6.66)* Crisis (-2) -0.015 (-2.15)** -0.024 (-3.46)* -0.015 (-2.32)** -0.022 (-2.97)* -0.017 (-2.49)** -0.025 (-3.57)* -0.017 (-2.59)* -0.0211 (-3.08)* Crisis (-3) -0.016 (-2.63)* -0.015 (-2.34)** -0.014 (-2.32)** -0.007 (-2.48)** -0.017 (-2.69)* -0.013 (-2.02)** -0.016 (-2.76)* -0.014 (-2.15)** Crisis (-4) -0.002 (0.36) -0.007 (-1.14) -0.000 (0.00) -0.011 (-1.62)* 0.015 (0.792) -0.010 (-1.58)*** -0.000 (-0.07) -0.009 (-1.53)*** Growth(-1)* X -0.013 (-1.61)*** 0.001 (0.55) 0.002 (0.64) 0.001 (0.55) 0.003 (1.49)*** 0.005 (2.13)** 0.137 (0.86) -0.049 (-0.30) Crises*X -0.002 (-2.21)** -0.005 (-0.41) 0.001 (1.83)*** 0.005 (1.81)*** -0.000 (-0.95) -0.003 (-1.50)*** -0.029 (-1.40)*** -0.088 (-3.42)* X -0.001 (-1.90)** 0.002 (1.04) 0.000 (0.09) 0.001 (0.74) 0.001 (0.97) 0.003 (0.02) 0.003 (0.03) 0.005 (0.01) N 155 155 153 153 154 154 156 156 R2 0.53 0.75 0.62 0.61 0.61 0.73 0.61 0.75
Table 7.The Impact of Financial Crises on Output controlling for: Exchange rate regime, change in government spending, change in monetary policy rates and IMF loan
Exchange rate regime Change in government spending
Change in policy rate IMF loan
MPI IMF MPI IMF MPI IMF MPI IMF
Growth(-1) 0.355 (4.77)* 0.385 (4.94)* 0.360 (4.51)* 0.254 (3.54)* 0.388 (4.98)* 0.357 (4.34)* 0.486 (6.01)* 0.377 (4.96)* Growth (-2) -0.136 (-1.83)** -0.150 (-1.93)** -0.063 (-0.83) -0.071 (-1.06) -0.175 (-2.02)** -0.185 (-2.11)** -0.151 (-1.86)*** -0.139 (-1.86)*** Growth (-3) 0.019 (0.33) 0.018 (0.29) -0.005 (-0.08) -0.017 (-0.33) 0.027 (0.41) 0.048 (0.68) -0.002 (-0.03) 0.048 (0.71) Growth (-4) -0.0141 (-0.36) -0.004 (-0.09) -0.063 (-1.19) -0.045 (-1.23) -0.075 (-1.69)*** -0.060 (-1.26) 0.011 (0.25) -0.060 (-1,09) Crisis -0.025 (-4.42)* -0.013 (-1.90)** -0.018 (-2.49)** -0.0071 (-1.34)*** -0.039 (-5.38)* -0.014 (-2.24)** -0.017 (-3.15)* -0.024 (-2.88)* Crisis (-1) -0.038 (-5.69)* -0.024 (-4.15)* -0.031 (-4.75)* -0.052 (-6.58)* -0.046 (-6.17)* -0.053 (-5.33)* -0.026 (-4.41)* -0.053 (-6.05)* Crisis (-2) -0.016 (-2.37)* -0.020 (-2.62)* -0.008 (-1.29) -0.021 (-3.30)* -0.019 (-2.69)* -0.021 (-2.66)* -0.013 (-1.72)*** -0.023 (-3.24)* Crisis (-3) -0.016 (-2.72)*** -0.020 (-2.75)* -0.010 (-1.81)*** -0.022 (-3.60)* -0.022 (-3.58)* -0.023 (-3.16)* -0.016 (-2.50)* -1.012 (-1.87)*** Crisis (-4) -0.001 (-0.25) -0.012 (-1.63)*** 0.001 (0.13) -0.011 (-1.91)** -0.002 (-0.36) -0.015 (-2.16)** -0.000 (-0.06) -0.012 (-1.487)*** Growth(-1)* X 0.213 (1.47)*** 0.278 (1.75)*** -0.020 (-1.39)*** -0.007 (-0.52) 0.007 (2.10)** 0.009 (2.68)* 0.000 (-1.41) -0.000 (-1.40) Crises*X 0.017 (1.42)*** -0.003 (-0.19) 0.0026 (1.12) 0.005 (2.81)* 0.000 (0.91) 0.000 (0.60) 0.000 (-0.03) -0.000 (-0.10) X -0.017 (-2.46) -0.013 (-1.83)** 0.003 (2.83)* 0.003 (3.10)* 0.000 (1.20) 0.001 (1.68)*** 0.000 (1.49) 0.000 (0.66) N 156 156 145 145 124 124 153 153 R2 0.62 0.56 0.67 0.72 0.72 0.61 0.57 0.62
References
Aghion, P., Bacchetta, P., Banerjee,A. (1999). ‘Capital Markets and the Instability of Open Economies CEPR Discussion Papers 2083.
Ageing Working Group Report (2009). ‘Ageing Report: Economic and budgetary projections for the EU-27 Member States (2008-2060)’, European Economy 2/2009 http://ec.europa.eu/economy_finance/publications/publication14992_en.pdf.
Andreou, I., Dufrénot, G., Sand-Zantman, Zdzienicka A. (2009). ‘A Forewarning Indicator System for Financial Crises: the case of six Central and Eastern European Countries’, Journal of Economic Integration, 24, pp. 87-115.
Barro R. (2001). ‘Economic Growth in East Asia Before and After the Financial Crisis NBER Working Papers 8330.
Bernanke B., Gertler, M. (1989). ‘Agency Costs, Net Worth and Business Fluctuations’, American Economic Review, 79(1), pp. 14-31.
Bordo, M., Eichengreen, B., Klingebiel, D., Soledad Martinez-Peria, M. (2001). ‘Is the Crisis Problem Growing More Severe?’, Economic Policy, 16(32), pp. 51-82.
Boyd J., Kwak, S., Smith, B. (2005). ‘The Real Output Loss Associated with Modern Banking Crises’, Journal of Money, Credit and Banking, 37, pp. 977-999.
Braun M., Larrain, B. (2005). ‘Finance and the Business Cycle: International, Inter-Industry Evidence Journal of Finance, 60(3), pp. 1097-1128.
Calvo G. (2006). ‘Monetary Policy Challenges in Emerging Markets: Sudden Stop, Liability Dollarization and Lender of Last Resort’,. NBER Working Papers, 12788.
Calvo G., Reinhart, C. (2000). ‘When Capital inflows come to a sudden stop: consequences and policy options’, MPRA Paper 6982, University Library of Munich, Germany.
Cerra, V., Saxena, S. (2008). ‘Growth Dynamics: The Myth of Economic Recovery’, American Economic Review, 98, pp. 439-457.
Cerra V., Panizza, U., Saxena, S. (2009). ‘International Evidence on Recovery from Recessions’, IMF Working Paper 09/183.
Chang, R., Velasco, A. (1998). ‘The Asian Liquidity Crisis’, NBER Working Paper 6796.
Claessens, C. A.
,
Klingebiel, D., Laeven, L., (2004). ‘Resolving systemic financial crisis: policies and institutions Policy Research Working Paper Series 3377, The World Bank.Christiano, L., Gust, C., Roldos, J. (2002).‘Monetary Policy in a Financial Crisis NBER Working Papers 9005.
Dell'Ariccia, G., Detragiache, E., Rajan, R. (2008). ‘The real effect of banking crises Journal of Financial Intermediation, 17(1), pp. 89-112.
Demirgüç-Kunt A., Detragiache, E., Gupta, P. (2006). ‘Inside the crisis: An empirical analysis of banking systems in distres Journal of International Money and Finance, 25(5), pp. 702-718.
Duval, R. (2008). ‘Is there a role for macroeconomic policy in fostering structural reforms? Panel evidence from OECD countries over the past two decades European Journal of Political Economy, 24(2), pp. 491-502.
Edison, H. (2000). ‘Do Indicators of Financial Crises Work? An Evaluation of an Early Warning System’, Federal Reserves Board of Governors, International Finance Discussion Papers, Number 675.
Eichengreen, B., Rose, A. (2003). Does It Pay to Defend Against a Speculative Attack?. In Michael Dooley and Jeffrey Frankel (eds.), Managing Currency Crises in Emerging Markets, Chicago: University of Chicago Press.
Eichengreen, B., Choudry, O. (2005) “Managing capital inflows Eastern Europe in an Asian Mirror. Turkish central bank”, Center for European Integration Studies conference on Macroeconomics Policies for EU adhesion.
European Commission (2009). ‘The Financial Crises and Potential Growth: Policy Challenges for Europe’, Economic Briefs 3/June 2009.
Furceri, D., Mourougane, A. (2009). ‘The Effect of Financial Crises on Potential Output: New Empirical Evidence from OECD Countries OECD Economics Department Working Papers 699, OECD, Economics Department.
Goldstein, M., Kaminsky, G., Reinhart, C. (2000). Assessing Financial Vulnerability: An Early Warning System for Emerging Markets. Washington: Institute for International Economics.
Honohan, P., Klingebiel, D. (2003). ‘The Fiscal Cost Implication of an Accommodating Approach to Banking Crises’, Journal of Banking and Finance, 27(8), pp. 1539-1560.
Hutchison, M. (2001). ‘How costly are IMF stabilization programs? FRBSF Economic Letter, Federal Reserve Bank of San Francisco, issue Mar. 30
Hutchison, M., Ilan, N., (2005). ‘How Bad Are Twins? Output Costs of Currency and Banking Crises Journal of Money, Credit and Banking, 37(4),pp. 725-752.
Kaminsky G.., Lizondo, S., Reinhart, C. (1998). ‘Leading Indicators of Currency Crises’, IMF Staff Papers, 45, pp. 1-48.
Kaminsky G., Reinhart, C. (1999). ‘The Twin Crises. The Causes of Banking and Balance-of-Payments Problems’, American Economic Review, 89, pp. 473-500.
Kiyotaki, N., Moore, J. (1997). ‘Credit Cycles’, Journal of Political Economy, pp. 211-248.
Leaven L., Valencia, F. (2008).‘Systemic banking crises: a new database’, IMF Working Paper, WP/08/224.
Levine, R. (1997). ‘Financial Development and Economic Growth: Causality and Causes’, Journal of Monetary Economics, 46, pp. 31-77.
Levy –Yeyati, E., Sturzenegger, F. (2005). ‘Classifying Exchange Rate Regimes: Deeds vs. Words’, European Economic Review, 49(6), pp. 1603-1635.
Lipsey R.E.,2001. ‘Foreign Direct Investors in Three Financial Crises NBER Working Papers 8084.
Loayza, N., Ranciere, R. (2006). ‘Financial Development, Financial Fragility, and Growth Journal of Money, Credit and Banking, 38(4), pp. 1051-1076.
Milesi-Ferretti G.M., Razin, A. (1998). ‘Current account Reversals and Currency Crises- Empirical Regularities’. CEPR Discussion Papers 1921.
Park Y.C., Lee, J.W. (2003). ‘Recovery and Sustainability in East Asia NBER Chapters, in: Managing Currency Crises in Emerging Markets.
Reinhart, C., Rogoff, K. (2004). ‘The Modern History of Exchange Rate Arrangements: A Reinterpretation The Quarterly Journal of Economics, 119(1), pp. 1-48.
Reinhart, C., Rogoff, K. (2009). ‘The Aftermath of Financial Crises NBER Working Papers 14656.
Rodrik D. (1998). ‘Why Do More Open Economies Have Bigger Governments?’, Journal of Political Economy, 106(5), pp. 997-1032.
Rodrik, D. (1999). ‘Where Did All the Growth Go? External Shocks, Social Conflict, and Growth Collapses Journal of Economic Growth, 4(4), pp. 385-412.
Romer, C., Romer, D. (1989). ‘Does Monetary Policy Matter? A New Test in the Spirit of Friedman and Schwartz’, NBER Macroeconomics Annual, 4: 121-170.
Tong H., Wei, S.J. (2009). ‘Real Effects of the 2007-08 Financial Crisis around the World’, http://www.finance-innovation.org/risk09/work/1201504.pdf.
World Bank (2009). World Investment Report 2008.
http://www.unctad.org/Templates/webflyer.asp?docid=10502&intItemID=2068&lang=1
Zdzienicka, A. (2008).‘Financial Vulnerabilities in Central and Eastern Europe: Credit Growth’, GATE Working Paper 09.12.
APPENDIX - DATA AND SOURCES
Output Growth: Ratio between gross government debt and GDP. Source: IMF International
Financial Statistics
MPI crisis index: Value equal to 1 corresponds to the real effective exchange rate
depreciation and loss in FX reserves above “safe threshold”. Source: Andreou et al. (2009)
IMF crisis dummy: Value equal to 1 in correspondence of currency, banking and debt crises.
Source: Laeven and Valencia (2008).
Country Size: Calculated as the logarithm of real GDP. Source: IMF International Financial
Statistics
Trade openness: The ratio of exports plus imports to GDP at constant prices. Source: IMF
International Financial Statistics
Dependence on External Financing: Calculated as Foreign Liabilities of Domestic Banks
over GDP and alternatively as Current Account Deficit over GDP. Source: IMF International Financial Statistics and World Economic Outlook
Financial Development: Ratio of Banking Credit to Private Sector over GDP. Source: IMF
International Financial Statistics
Credit Boom dummy: Value equal to 1 corresponds to “excessive” Banking Credit to Private
Sector expansion. Source: Zdzienicka (2008)
Exchange Rate Regime dummy: Value equal to 1 corresponds flexible and 0 stands for
intermediate and fixed exchange rate regime. Source: Reinhart and Rogoff (2004), Levy – Yeyati and Sturzenegger (2005) and after 2004, the IMF de facto classification
Central Bank Interest Rate: Corresponds to the Central Bank re-financement interest rate.
Source: Eurostat and Central Banks statistics
Government Spending: Calculates as the ratio of government spending over GDP. Source:
OECD database (85)
Foreign Aid: Approximated by the IMF credit and loans. Source: IMF International
Financial Statistics