Deformation and Fracture of Polycarbonate and
Rubber-Modified Polycarbonate under Controlled
Temperature, Deformation Rate, and
Notch Stress Triaxiality
by
Michael DeShawn Johnson
B.S., Mechanical Engineering
Michigan State University, 1999
Submitted to the Department of Mechanical Engineering
MASSACHUSETTS IN TITUTEin partial fulfillment of the requirements OF TECHNOLOGY
for the degree of
Master of Science
JUL 16 2001
at the
MASSACHUSETTS INSTITUTE OF TECHNOLOGY
LIBRARIES
May 23, 2001 LA a ;
D Massachusetts Institute of Technology 2001. All right reserved.
BARKER
A u th o r...
..
... - ...
Department o
echanical Engineering
May 23, 2001
Certified by...
...
Certified by...
Accepted by...Mry C. Boyce
Professor
Thesis Supervisor
...
David M. Parks
Professor
Thesis Supervisor
.. . ... ..
..
. ...
Ain A. Sonin
Chairman, Department Committee on Graduate Students
Deformation and Fracture of Polycarbonate and
Rubber-Modified Polycarbonate under Controlled
Temperature, Deformation Rate, and Notch Stress
Triaxiality
by
Michael DeShawn Johnson
Submitted to the Department of Mechanical Engineering
on May 23, 2001, in partial fulfillment of the
requirements for the degree of
Master of Science
Abstract
The deformation and fracture of polycarbonate and polycarbonate toughened with
methyl-methacrylate shell/polybutadiene core sub-micron particles are investigated.
The effects of strain rate, temperature, and notch stress triaxiality on deformation and
fracture are studied. The Arruda-Boyce constitutive model for glassy polymers and
finite element simulations are used to simulate the deformation of the polycarbonate
homopolymer subjected to compression and tension under un-notched and notched
conditions.
Compression of polycarbonate in uniaxial compression is found to exhibit an
ini-tially elastic response followed by yield, then strain softening and strain hardening at
large strains. The yield stress is found to be dependent on temperature and strain
rate. Yield stress is shown to increase with increasing strain rate and decrease with
increasing temperature.
Load-displacement behavior of un-notched polycarbonate is shown to exhibit an
initially elastic response followed by macroscopic yield, then a load drop, and then
a load plateau as the neck stably propagates, soon after the neck has propagated
the full length of the specimen it begins to travel into the grip region, ductile failure
occurs due to extensive stretching. The fracture is surface initiated. The load at yield
is shown to be dependent on temperature and displacement rate. The load at yield
increases with increasing strain rate and decreases with increasing temperature.
Notched tension specimens are shown to exhibit an initially elastic behavior.
Mildly notched specimens tested at room temperature are shown to fail in a ductile
manner similar to un-notched specimens. More severely notched specimens, and the
moderately notched specimen tested at 100 C are shown to fail in a brittle manner
where the brittle failure is found to be internally initiated.
enabled construction of ductile and brittle fracture criteria. A ductile failure
crite-rion of maximum strain is proposed. This maximum strain is seen in the ductile
failures of both the un-notched and the mildly notched specimens and has a value
of approximately 0.65. A temperature dependent brittle failure criterion is proposed.
This brittle failure criterion establishes critical values of negative pressure for brittle
failure at various temperatures.
Rubber-modified compression and tension specimens are shown to exhibit
stress-strain and load-displacement behavior similar to that seen for the un-modified
ma-terial compression and tension tests respectively. The elastic modulus, yield stress,
amount of strain softening, and strain hardening are all seen to decrease with
increas-ing rubber volume content. The inclusion of sub-micron rubber particles is shown not
to dramatically enhance the mechanical properties of un-notched or mildly notched
specimens. The inclusion of sub-micron rubber particles is shown to drastically
in-crease the displacement to failure of more severely notched specimens tested at room
temperature, but is shown to provide little improvement for tests conducted at -60 C.
Thesis Supervisor: Mary C. Boyce
Title: Professor
Thesis Supervisor: David M. Parks
Title: Professor
Acknowledgments
First I would to like thank Professors Boyce and Parks for their guidance and
pa-tience. I would like to thank the Bayer Corporation for their generous donation of
the experimental materials. This work was supported by the National Science
Foun-dation and made use of MRSEC Shared Facilities supported by the National Science
Foundation, under Award Number DMR-9400334.
I would like to thank my friends, Reggie and Byron. Thanks for allowing me
to vent my frustrations, making the basement a fun place to be in the wee hours
of the morning, and most of all for understanding. I doubt I would have made it
through the last 2 years without you guys. I would like to thank my mother whose
kind words and reassuring voice always made everything seem OK. I would like to
thank my father for talking about everything except work, and understanding when
I didn't call for a while. I would like to thank my sister Nina for being a good big
sister. Even though we don't talk much, I love you and think of you everyday. To
my grandparents, thank you for teaching me patience and perseverance. I would like
to thank my best friend Jon, for being awake when I called at midnight, and always
making me laugh no matter what was going on. I would like to thank Kristin for being
positive, kind, and brightening up many a day. I would like to thank my labmates
Franco, Dora, Rebecca, Ethan, and Mats for their patience and help, and wish them
luck. I would like to thank Jason and Michelle for making Boston feel a little like
East Lansing. I would like to thank my roommates for understanding why I come
home at crazy hours and am never there, but always being supportive. I would like
to thank the Graduate Student Office for the Power Lunches, their support, and the
various other events that brought people together. I would like to thank the Black
Graduate Student Association allowing people to get together and accomplish great
things. I would also like to thank all the positive black people at MIT, (i.e. Lael,
Chris, Kim, Malo, Anton, LaRuth...) your smiles and encouragement kept me going
through the rough times. Finally and most importantly, I would like to thank God,
because through Him all things are possible.
Contents
1 Introduction
25
1.1 Yield of Polycarbonate . . . .
26
1.2
Notch Sensitivity . . . .
26
1.3
Toughened Polymers . . . .
29
1.4 Thesis Outline. . . . .
30
2 Methods and Materials
31
2.1
Material . . . .
31
2.2 Specimens . . . .
32
2.3
Experiments . . . .
33
2.3.1
Tension . . . .
33
2.3.2
Compression . . . .
33
2.4
Microscopy
. . . .
34
2.4.1
Optical . . . .
34
2.4.2
Electron . . . .
34
2.5
Finite Element Modeling . . . .
34
3 Unfilled Polycarbonate
37
3.1
Uniaxial Compression . . . .
37
3.2
Un-notched PC in Uniaxial Tension . . . .
43
3.3
1.905mm Radius Notched PC in Uniaxial Tension . . . .
72
3.6
Summary ...
3.6.1 Experimental Results
3.6.2 Numerical Simulations
4 Rubber Modified Polycarbonate
4.1 Uniaxial Compression . . . . 4.2 Uniaxial Tension . . . . 4.3 Notched Tension . . . . 4.3.1 1.9mm Notch Radius 4.3.2 1.27mm Notch Radius 4.3.3 0.76mm Notch Radius 4.4 Summary . . . . 5 Conclusions A Constitutive Model
. . . .
. . . .
. . . .
160
160
161
165
165
167
176
176
188
199
208
211
215
List of Figures
1-1
Schematic of circumferentially notched bar. Far field tensile stress is
88.7
M P a. . . . .
28
2-1 Axisymmetric tension specimens. All dimensions in mm. . . . .
32
2-2
Finite element meshes. . . . .
36
3-1
Uniaxial compression at various strain rates at room temperature.
.
.
38
3-2
Simulation and experimental data of uniaxial compression of PC at
room temperature at a strain rate of 0.001/s . . . .
38
3-3 Simulation and experimental data of uniaxial compression of PC at
room temperature at a strain rate of 0.01/s . . . .
39
3-4 Simulation and experimental data of uniaxial compression of PC at
room temperature at a strain rate of 0.1/s. . . . .
39
3-5
Uniaxial compression at various temperatures at a strain rate of 0.001/s 40
3-6
Simulation and experimental data of uniaxial compression of PC at
60 C at a strain rate of 0.001/s . . . .
41
3-7 Simulation and experimental data of uniaxial compression of PC at
100 C at a strain rate of 0.001/s . . . .
41
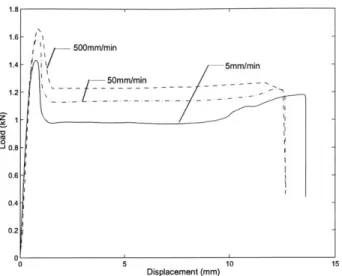
3-8 Load-displacement of 5.08mm diameter un-notched PC at various
rates at room temperature. . . . .
43
3-9 Simulated and experimental load-displacement curves of 5.08mm
di-ameter un-notched PC loaded at 5mm/min at room temperature.
.
.
44
3-11 Contours of maximum principal stress for un-notched simulation loaded
at 5mm/min at room temperature. . . . .
46
3-12 Contours of strain in the axial direction for un-notched simulation
loaded at 5mm/min at room temperature. . . . .
48
3-13 (a) Fracture surface of un-notched specimen at 5mm/min at room
temperature. (b) Axial schematic of fracture . . . .
49
3-14 Fracture surface of un-notched specimen at 5mm/min at room
tem-perature...
...
49
3-15 Simulated and experimental load-displacement curves of 5.08mm
di-ameter un-notched PC loaded at 50mm/min at room temperature. .
50
3-16 Contours of negative pressure for un-notched simulation loaded at
50mm/min at room temperature. . . . .
51
3-17 Contours of maximum principal stress for un-notched simulation loaded
at 50mm/min at room temperature. . . . .
52
3-18 Contours of strain in the axial direction for un-notched simulation
loaded at 50mm/min at room temperature. . . . .
53
3-19 (a) Fracture surface of un-notched specimen at 50mm/min at room
temperature. (b) Axial schematic of fracture . . . .
54
3-20 Fracture surface of un-notched specimen at 50mm/min at room
tem-perature...
...
55
3-21 Simulated and experimental load-displacement curves of 5.08mm
di-ameter un-notched PC loaded at 500mm/min at room temperature. .
55
3-22 Contours of negative pressure for un-notched simulation loaded at
500mm/min at room temperature . . . .
56
3-23 Contours of maximum principal stress for un-notched simulation loaded
at 500mm/min at room temperature. . . . .
57
3-24 Contours of strain in the axial direction for un-notched simulation
loaded at 500mm/min at room temperature. . . . .
58
3-25 (a) Fracture surface of un-notched specimen at 500mm/min at room
3-26 Fracture surface of un-notched specimen at 500mm/min at room
tem-perature...
...
60
3-27 Load-displacement of 5.08mm diameter un-notched PC at 5mm/min
at various temperatures. . . . .
60
3-28 Simulated and experimental load-displacement curves of 5.08mm
di-ameter un-notched PC loaded at 5mm/min at -60'C . . . .
61
3-29 Contours of negative pressure for un-notched simulation loaded at
5m m /m in at -60'C . . . .
62
3-30 Contours of maximum principal stress for un-notched simulation loaded
at 5m m /m in at -60
. . . .
63
3-31 Contours of strain in the axial direction for un-notched simulation
loaded at 5mm/min at -60
. . . .
64
3-32 (a) Fracture surface of un-notched specimen at 5mm/min at -60 C.
(b) Axial schematic of fracture. . . . .
65
3-33 Fracture surface of un-notched specimen at 5mm/min at -60 C. . . . 66
3-34 Simulated and experimental load-displacement curves of 5.08mm
di-ameter un-notched PC loaded at 5mm/min at 100
. . . .
66
3-35 Contours of negative pressure for un-notched simulation loaded at
5m m /m in at 100'C . . . .
67
3-36 Contours of maximum principal stress for un-notched simulation loaded
at 5mm/min at 100'C . . . .
68
3-37 Contours of strain in the axial direction for un-notched simulation
loaded at 5mm/min at 100'C . . . .
69
3-38 (a) Fracture surface of un-notched specimen at 5mm/min at 100 C.(b)
Axial schematic of fracture. . . . .
70
3-39 Fracture surface of un-notched specimen at 5mm/min at 100 C. . . 70
3-40 Load Displacement of 1.9mm radius notched PC at various rates at
room tem perature. . . . .
72
3-42 Contours of negative pressure for 1.9mm notched simulation loaded at
5mm/min at room temperature. . . . .
74
3-43 Contours of maximum principal stress for 1.9mm notched simulation
loaded at 5mm/min at room temperature. . . . .
75
3-44 Contours of strain in the axial direction for 1.9mm notched simulation
loaded at 5mm/min at room temperature. . . . .
77
3-45 (a) Fracture surface of 1.9mm radius notched specimen at 5mm/min
at room temperature. (b) Axial schematic of fracture. . . . .
78
3-46 Fracture surface of 1.9mm radius notched specimen at 5mm/min at
room tem perature. . . . .
78
3-47 Simulated and experimental load-displacement curves of 1.9mm notched
PC loaded at 50mm/min at room temperature.
. . . .
79
3-48 Contours of negative pressure for 1.9mm notched simulation loaded at
50mm/min at room temperature. . . . .
80
3-49 Contours of maximum principal stress for 1.9mm notched simulation
loaded at 50mm/min at room temperature. . . . .
81
3-50 Contours of strain in the axial direction for 1.9mm notched simulation
loaded at 50mm/min at room temperature. . . . .
82
3-51 (a) Fracture surface of 1.9mm radius notched specimen at 50mm/min
at room temperature. (b) Axial schematic of fracture. . . . .
83
3-52 Fracture surface of 1.9mm radius notched specimen at 50mm/min at
room tem perature. . . . .
83
3-53 Simulated and experimental load-displacement curves of 1.9mm notched
PC loaded at 500mm/min at room temperature. . . . .
84
3-54 Contours of negative pressure for 1.9mm notched simulation loaded at
500mm/min at room temperature . . . .
85
3-55 Contours of maximum principal stress for 1.9mm notched simulation
loaded at 500mm/min at room temperature. . . . .
86
3-56 Contours of strain in the axial direction for 1.9mm notched simulation
3-57 (a) Fracture surface of 1.9mm radius notched specimen at 500mm/min
at room temperature. (b) Axial schematic of fracture. . . . .
88
3-58 Fracture surface of 1.9mm radius notched specimen at 500mm/min at
room tem perature. . . . .
88
3-59 Load-displacement of 1.9mm radius notched PC at 5mm/min at
vari-ous tem peratures. . . . .
89
3-60 Simulated and experimental load-displacement curves of 1.9mm notched
PC loaded at 5mm/min at -60'C . . . .
89
3-61 Contours of negative pressure for 1.9mm notched simulation loaded at
5m m /m in -60'C .
. . . .
90
3-62 Contours of maximum principal stress for 1.9mm notched simulation
loaded at 5mm/min at -60 C. . . . .
92
3-63 Contours of strain in the axial direction for 1.9mm notched simulation
loaded at 5mm/min at -60 C. . . . .
93
3-64 (a) Fracture surface of 1.9mm radius notched specimen at 5mm/min
at -60 C. (b) Axial schematic of fracture. . . . .
94
3-65 Fracture surface of 1.9mm radius notched specimen at 5mm/min at
-60 C . . . .
95
3-66 Simulated and experimental load-displacement curves of 1.9mm notched
PC loaded at 5mm/min at 100
.
. . . .
95
3-67 Contours of negative pressure for 1.9mm notched simulation loaded at
5m m /m in at 100'C . . . .
96
3-68 Contours of maximum principal stress for 1.9mm notched simulation
loaded at 5mm/min at 100'C . . . .
97
3-69 Contours of strain in the axial direction for 1.9mm notched simulation
loaded at 5mm/min at 100 C . . . .
98
3-70 (a) Fracture surface of 1.9mm radius notched specimen at 5mm/min
at 100 C. (b) Axial schematic of fracture. . . . .
99
3-71 Fracture surface of 1.9mm radius notched specimen at 5mm/min at
3-72 Load-displacement of 1.27mm radius notched PC at various rates. . . 101
3-73 Simulated and experimental load-displacement curves of 1.27mm notched
PC loaded at 5mm/min at room temperature. . . . .
102
3-74 Contours of negative pressure for 1.27mm notched simulation loaded
at 5mm/min at room temperature. . . . 103
3-75 Contours of maximum principal stress for 1.27mm notched simulation
loaded at 5mm/min at room temperature. . . . 104
3-76 Contours of strain in the axial direction for 1.27mm notched simulation
loaded at 5mm/min at room temperature. . . . .
105
3-77 (a) Fracture surface of 1.27mm radius notched specimen at 5mm/min
at room temperature. (b) Axial schematic of fracture. . . . .
106
3-78 Fracture surface of 1.27mm radius notched specimen at 5mm/min at
room tem perature. . . . 107
3-79 Simulated and experimental load-displacement curves of 1.27mm notched
PC loaded at 50mm/min at room temperature. . . . .
107
3-80 Contours of negative pressure for 1.27mm notched simulation loaded
at 50mm/min at room temperature. . . . .
109
3-81 Contours of maximum principal stress for 1.27mm notched simulation
loaded at 50mm/min at room temperature. . . . .
110
3-82 Contours of strain in the axial direction for 1.27mm notched simulation
loaded at 50mm/min at room temperature. . . . .111
3-83 (a) Fracture surface of 1.27mm radius notched specimen at 50mm/min
at room temperature. (b) Axial schematic of fracture. . . . 112
3-84 Fracture surface of 1.27mm radius notched specimen at 50mm/min at
room tem perature. . . . .
113
3-85 Simulated and experimental load-displacement curves of 1.27mm notched
PC loaded at 500mm/min at room temperature. . . . .
114
3-86 Contours of negative pressure for 1.27mm notched simulation loaded
3-87 Contours of maximum principal stress for 1.27mm notched simulation
loaded at 500mm/min at room temperature. . . . .
116
3-88 Contours of strain in the axial direction for 1.27mm notched simulation
loaded at 500mm/min at room temperature. . . . .
117
3-89 (a) Fracture surface of 1.27mm radius notched specimen at 500mm/min
at room temperature. (b) Axial schematic of fracture. . . . .
118
3-90 Fracture surface of 1.27mm radius notched specimen at 500mm/min
at room tem perature. . . . .
119
3-91 Load-displacement of 1.27mm radius notched PC at 5mm/min at
var-ious tem peratures. . . . .
119
3-92 Simulated and experimental load-displacement curves of 1.27mm notched
PC loaded at 5mm/min at -60'C . . . .
120
3-93 Contours of negative pressure for 1.27mm notched simulation loaded
at 5mm/min at -60'C .
. . . .
121
3-94 Contours of maximum principal stress for 1.27mm notched simulation
loaded at 5mm/min at -60
. . . .
122
3-95 Contours of strain in the axial direction for 1.27mm notched simulation
loaded at 5mm/min at -60 C. . . . .
123
3-96 (a) Fracture surface of 1.27mm radius notched specimen at 5mm/min
at -60 C. (b) Axial schematic of fracture.
. . . .
124
3-97 Fracture surface of 1.27mm radius notched specimen at 5mm/min at
-60 0 C . . . .
125
3-98 Simulated and experimental load-displacement curves of 1.27mm notched
PC loaded at 5mm/min at 100
.
. . . .
126
3-99 Contours of negative pressure for 1.27mm notched simulation loaded
at 5mm/min at 100'C . . . .
127
3-10OContours of maximum principal stress for 1.27mm notched simulation
loaded at 5mm/min at 100
0C. . . .
128
3-102(a) Fracture surface of 1.27mm radius notched specimen at 5mm/min
at 100 C. (b) Axial schematic of fracture. . . . .
130
3-103Fracture surface of 1.27mm radius notched specimen at 5mm/min at
100 C . . . .
130
3-104Load-displacement of 0.76mm radius notched PC at various rates at
room tem perature. . . . .
131
3-105Simulated and experimental load-displacement curves of 0.76mm notched
PC loaded at 5mm/min at room temperature. . . . .
132
3-106Contours of negative pressure for 0.76mm notched simulation loaded
at 5mm/min at room temperature. . . . .
133
3-107Contours of maximum principal stress for 0.76mm notched simulation
loaded at 5mm/min at room temperature. . . . .
134
3-108Contours of strain in the axial direction for 0.76mm notched simulation
loaded at 5mm/min at room temperature. . . . .
135
3-109(a) Fracture surface of 0.76mm radius notched specimen at 5mm/min
at room temperature. (b) Axial schematic of fracture. . . . .
136
3-11OFracture surface of 0.76mm radius notched specimen at 5mm/min at
room tem perature. . . . .
136
3-11iSimulated and experimental load-displacement curves of 0.76mm notched
PC loaded at 50mm/min at room temperature.
. . . .
137
3-112Contours of negative pressure for 0.76mm notched simulation loaded
at 50mm/min at room temperature. . . . .
138
3-113Contours of maximum principal stress for 0.76mm notched simulation
loaded at 50mm/min at room temperature. . . . .
139
3-114Contours of strain in the axial direction for 0.76mm notched simulation
loaded at 50mm/min at room temperature. . . . .
140
3-115(a) Fracture surface of 0.76mm radius notched specimen at 50mm/min
at room temperature. (b) Axial schematic of fracture. . . . .
141
3-116Fracture surface of 0.76mm radius notched specimen at 50mm/min at
3-117Simulated and experimental load-displacement curves of 0.76mm notched
PC loaded at 500mm/min at room temperature. . . . .
142
3-118Contours of negative pressure for 0.76mm notched simulation loaded
at 500mm/min at room temperature. . . . .
143
3-119Contours of maximum principal stress for 0.76mm notched simulation
loaded at 500mm/min at room temperature. . . . 145
3-120Contours of strain in the axial direction for 0.76mm notched simulation
loaded at 500mm/min at room temperature. . . . .
146
3-121(a) Fracture surface of 0.76mm radius notched specimen at 500mm/min
at room temperature. (b) Axial schematic of fracture. . . . .
147
3-122Fracture surface of 0.76mm radius notched specimen at 500mm/min
at room tem perature. . . . .
148
3-123Load-displacement of 0.76mm radius notched PC at 5mm/min at
var-ious tem peratures. . . . 148
3-124Load Displacement of 0.76mm Radius Notched Specimen at 5mm/min
at -60 C . . . .
149
3-125Contours of negative pressure for 0.76mm notched simulation loaded
at 5mm/min at -60'C .
. . . .
150
3-126Contours of maximum principal stress for 0.76mm notched simulation
loaded at 5mm/min at -60 C. . . . 151
3-127Contours of strain in the axial direction for 0.76mm notched simulation
loaded at 5mm/min at -60 C. . . . .
152
3-128(a) Fracture surface of 0.76mm radius notched specimen at 5mm/min
at -60 C. (b) Axial schematic of fracture. . . . .
153
3-129Fracture surface of 0.76mm radius notched specimen at 5mm/min at
-60 C . . . 154
3-130Simulated and experimental load-displacement curves of 0.76mm notched
PC loaded at 5mm/min at 100
.
. . . 154
3-132Contours of maximum principal stress for 0.76mm notched simulation
loaded at 5mm/min at 100'C . . . .
156
3-133Contours of strain in the axial direction for 0.76mm notched simulation
loaded at 5mm/min at 100 C . . . .
157
3-134(a) Fracture surface of 0.76mm radius notched specimen at 5mm/min
at 100 C. (b) Axial schematic of fracture. . . . 158
3-135Fracture surface of 0.76mm radius notched specimen at 5mm/min at
100
C . . . 159
3-136Critical negative pressure for brittle failure of samples tested at 5mm/min
at various temperatures . . . .
163
4-1 Compression tests at 0.01/s at room temperature with various rubber
fractions. . . . .
166
4-2 5.08mm diameter un-notched tension tests at 5mm/min at room
tem-perature with various rubber fractions. . . . .
168
4-3 5.08mm diameter un-notched tension tests at 500mm/min at room
temperature with various rubber fractions. . . . .
169
4-4 (a) Fracture surface of un-notched 10% rubber modified polycarbonate
at 500mm/min at room temperature. (b) Axial schematic of fracture.
170
4-5 Fracture surface of un-notched 10% rubber modified polycarbonate at
500mm/min at room temperature . . . .
171
4-6 (a) Fracture surface of un-notched 20% rubber modified polycarbonate
at 500mm/min at room temperature. (b) Axial schematic of fracture.
172
4-7 Fracture surface of un-notched 20% rubber modified polycarbonate at
500mm/min at room temperature . . . 172
4-8 5.08mm diameter un-notched tension tests at 5mm/min at -60 C with
Various Rubber Fractions. . . . 173
4-9
(a) Fracture surface of un-notched 5% rubber modified polycarbonate
4-10 Fracture surface of un-notched 5% rubber modified polycarbonate at
5m m /m in at -60'C . . . 174
4-11 (a) Fracture surface of un-notched 20% rubber modified polycarbonate
at 5mm/min at -60 C. (b) Axial schematic of fracture. . . . .
175
4-12 Fracture surface of un-notched 20% rubber modified polycarbonate at
5m m /m in at -60'C . . . .
175
4-13 1.9mm radius notched tension tests at 5mm/min at room temperature
with various rubber fractions. . . . .
176
4-14 (a) Fracture surface of 1.9mm radius notched 30% rubber modified
polycarbonate at 5mm/min at room temperature. (b) Axial schematic
of fracture . . . .
177
4-15 Fracture surface of 1.9mm radius notched 30% rubber modified
poly-carbonate at 5mm/min at room temperature . . . .
177
4-16 1.9mm radius notched tension tests at 500mm/min at room
tempera-ture with various rubber fractions . . . .
178
4-17 (a) Fracture surface of 1.9mm radius notched 5% rubber modified
poly-carbonate at 500mm/min at room temperature (b) Axial schematic of
fracture. .. ...
...
.. ... .. ...
.
..
179
4-18 Fracture surface of 1.9mm radius notched 5% rubber modified
poly-carbonate at 500mm/min at room temperature
. . . .
179
4-19 (a) Fracture surface of 1.9mm radius notched 20% rubber modified
polycarbonate at 500mm/min at room temperature. (b) Axial schematic
of fracture.. ...
...
...
...
. .180
4-20 Fracture surface of 1.9mm radius notched 20% rubber modified
poly-carbonate at 500mm/min at room temperature . . . .
180
4-21 1.9mm Radius Notched Tension Tests at 5mm/min at -60 C with
Various Rubber Fractions. . . . .
181
4-23 Fracture surface of 1.9mm radius notched 5% rubber modified
poly-carbonate at 5mm/min at -60'C . . . .
183
4-24 (a) Fracture surface of 1.9mm radius notched 10% rubber modified
polycarbonate at 5mm/min at -60 C. (b) Axial schematic of fracture. 183
4-25 Fracture surface of 1.9mm radius notched 10% rubber modified
poly-carbonate at 5mm/min at -60'C . . . .
184
4-26 (a) Fracture surface of 1.9mm radius notched 20% rubber modified
polycarbonate at 5mm/min at -60 C. (b) Axial schematic of fracture. 185
4-27 Fracture surface of 1.9mm radius notched 20% rubber modified
poly-carbonate at 5mm/min at -60'C . . . .
186
4-28 (a) Fracture surface of 1.9mm radius notched 30% rubber modified
polycarbonate at 5mm/min at -60 C. (b) Axial schematic of fracture. 186
4-29 Fracture surface of 1.9mm radius notched 30% rubber modified
poly-carbonate at 5mm/min at -60'C . . . .
187
4-30 1.27mm radius notched tension tests at 5mm/min at room temperature
with various rubber fractions. . . . .
188
4-31 (a) Fracture surface of 1.27mm radius notched 5% rubber modified
polycarbonate at 5mm/min at room temperature. (b) Axial schematic
of fracture. . . . .
189
4-32 Fracture surface of 1.27mm radius notched 5% rubber modified
poly-carbonate at 5mm/min at room temperature . . . .
189
4-33 (a) Fracture surface of 1.27mm radius notched 20% rubber modified
polycarbonate at 5mm/min at room temperature. (b) Axial schematic
of fracture. . . . .
190
4-34 Fracture surface of 1.27mm radius notched 20% rubber modified
poly-carbonate at 5mm/min at room temperature . . . 190
4-35 1.27mm radius notched tension tests at 500mm/min at room
4-36 (a) Fracture surface of 1.27mm radius notched 5% rubber modified
polycarbonate at 500mm/min at room temperature. (b) Axial schematic
of fracture. . . . .
192
4-37 Fracture surface of 1.27mm radius notched 5% rubber modified
poly-carbonate at 500mm/min at room temperature. . . . .
193
4-38 (a) Fracture surface of 1.27mm radius notched 10% rubber modified
polycarbonate at 500mm/min at room temperature. (b) Axial schematic
of fracture. . . . .
193
4-39 Fracture surface of 1.27mm radius notched 10% rubber modified
poly-carbonate at 500mm/min at room temperature
. . . .
194
4-40 1.27mm radius notched tension tests at 5mm/min at -60 C with
var-ious rubber fractions. . . . .
195
4-41 (a) Fracture surface of 1.27mm radius notched 5% rubber modified
polycarbonate at 5mm/min at -60 C. (b) Axial schematic of fracture. 195
4-42 Fracture surface of 1.27mm radius notched 5% rubber modified
poly-carbonate at 5mm/min at -60'C . . . .
196
4-43 (a) Fracture surface of 1.27mm radius notched 20% rubber modified
polycarbonate at 5mm/min at -60 C. (b) Axial schematic of fracture. 196
4-44 Fracture surface of 1.27mm radius notched 20% rubber modified
poly-carbonate at 5mm/min at -60'C . . . .
197
4-45 (a) Fracture surface of 1.27mm radius notched 30% rubber modified
polycarbonate at 5mm/min at -60 C. (b) Axial schematic of fracture. 197
4-46 Fracture surface of 1.27mm radius notched 30% rubber modified
poly-carbonate at 5mm/min at -60'C . . . .
198
4-47 0.76mm radius notched tension tests at 5mm/min at room temperature
with various rubber fractions. . . . 199
4-48 (a) Fracture surface of 0.76mm radius notched 5% rubber modified
4-49 Fracture surface of 0.76mm radius notched 5% rubber modified
poly-carbonate at 5mm/min at room temperature . . . 200
4-50 0.76mm radius notched tension tests at 500mm/min at room
temper-ature with various rubber fractions. . . . 201
4-51 (a) Fracture surface of 0.76mm radius notched 5% rubber modified
polycarbonate at 500mm/min at room temperature. (b) Axial schematic
of fracture . . . 202
4-52 Fracture surface of 0.76mm radius notched 5% rubber modified
poly-carbonate at 500mm/min at room temperature
. . . .
202
4-53 (a) Fracture surface of 0.76mm radius notched 20% rubber modified
polycarbonate at 500mm/min at room temperature. (b) Axial schematic
of fracture . . . .
203
4-54 Fracture surface of 0.76mm radius notched 20% rubber modified
poly-carbonate at 500mm/min at room temperature. . . . .
203
4-55 0.76mm radius notched tension tests at 5mm/min at -60 C with
var-ious rubber fractions. . . . .
204
4-56 (a) Fracture surface of 0.76mm radius notched 5% rubber modified
polycarbonate at 5mm/min at -60 C. (b) Axial schematic of fracture. 205
4-57 Fracture surface of 0.76mm radius notched 5% rubber modified
poly-carbonate at 5mm/min at -60'C . . . .
205
4-58 (a) Fracture surface of 0.76mm radius notched 20% rubber modified
polycarbonate at 5mm/min at -60 C. (b) Axial schematic of fracture. 206
4-59 Fracture surface of 0.76mm radius notched 20% rubber modified
poly-carbonate at 5mm/min at -60
. . . .
206
4-60 (a) Fracture surface of 0.76mm radius notched 30% rubber modified
polycarbonate at 5mm/min at -60 C. (b) Axial schematic of fracture. 207
4-61 Fracture surface of 0.76mm radius notched 30% rubber modified
List of Tables
3.1
Elastic moduli and yield stress as a function of temperature and strain
rate. ...
...
42
3.2 Elastic moduli and yield stress as a function of temperature and strain
rate. ...
...
71
4.1
Elastic moduli and yield stress as a function of rubber volume fraction
for uniaxial compression at a strain rate of 0.01/s at room temperature. 166
4.2
Elastic moduli and yield stress as a function of rubber volume fraction
for uniaxial tension of un-notched specimens at 5mm/min at room
tem perature . . . 168
4.3
Elastic moduli and yield stress as a function of rubber volume fraction
for uniaxial tension of un-notched specimens at 500mm/min at room
tem perature . . . 170
4.4
Elastic moduli and yield stress as a function of rubber volume fraction
Chapter 1
Introduction
Polycarbonate (PC) is a widely used engineering polymer known for both its tough-ness and transparency. It is an amorphous thermoplastic that has found uses in everything from football helmets to bulletproof glass to compact discs. PC is usually a ductile polymer that will plastically deform by shearing. PC can also fail in a brit-tle manner via cavitation and/or crazing under states of high triaxial loading. The mechanical behavior of PC is dependent on strain rate, pressure, and temperature
[1] [8]. Although the failure mode of polycarbonate is usually ductile in nature, the
introduction of a notch has been shown to cause a transition to brittle behavior due to the high triaxial stress near the notch tip [16] [27].
The purpose of this thesis is to characterize the behavior of polycarbonate and rubber-toughened blends of polycarbonate under un-notched and notched conditions at different loading rates and temperatures. Various notch geometries will be tested, and simulations of these geometries will be analyzed using a constitutive model for amorphous polymers. Boyce, et al., developed a constitutive model for glassy poly-mers that included temperature, strain rate, and pressure sensitivity [8]. This model was then further developed by Arruda and Boyce [1]. Arruda and Boyce showed that various modes of polycarbonate deformation could be predicted with their modified constitutive model [7] [2] [6]. This modified model will be used in this thesis research along with the finite element method to simulate deformation. Both un-notched
This thesis research will also look at the effect of the incorporation of second phase core-shell rubber particles on the mechanical behavior of polycarbonate under both un-notched and notched loading conditions. It has been shown that these particles can increase the toughness of polycarbonate [26] [18].
1.1
Yield of Polycarbonate
The yield stress of PC has been shown to depend on pressure, strain rate, and tem-perature. The pressure dependence of yield has been studied by several investigators. For example, Kaieda and Pae applied a 400 MPa hydrostatic pressure to polycar-bonate being tested in tension and found the yield stress to increase over 60% [17]. Nazarenko, et al., found that there was a positive linear correlation between applied hydrostatic pressure and yield stress in tension [21]. Temperature also has an effect on the yielding behavior of polycarbonate. Nazarenko, et al., also showed that the yield stress of PC loaded in tension increases with decreasing temperature [21]. The effect of temperature on the yield of polycarbonate has also been shown in shear [13]
[15] and compression [1]. G'Sell and Gopez demonstrated that increasing strain rate
in shear increased yield stress at various temperatures [15]. Fleck and Wright used Split Hopkinson Pressure Bars to test PC at extremely high strain rates (5000/s) and found the yield stress to increase almost 50% over that of slower rate tests (0.0004/s)
[13].
1.2
Notch Sensitivity
Circumferentially notched bars provide an opportunity to study the effects of stress triaxiality on the deformation and failure of a material. A schematic of a circumfer-entially notched bar, and different stress quantities under elastic loading are shown in Figure 1-1. This figure shows contour plots of the negative pressure, Mises stress, and stress in the axial direction near the notch when subjected to a far field stress of 88.7MPa. The multiaxial state of stress present in the net section of circumferentially
notched bars causes the local negative pressure to increase over that present under uniaxial loading conditions. This increase in the negative pressure makes it difficult for the Mises stress to reach a value which would cause yielding before brittle events such as crazing or cavitation can occur. The negative pressure is given by:
-P = -(Ozz + 000 +
Urr)
(1.1)
3
where uii are the diagonal stress components.
For yielding to occur, the Mises stress (UMises) given below:
UMises 2 [(oroo - orr)2 + (orr - zz)2 + (rzz - o)] + 3[2r ± rz OZ
must equal the yield stress measured under uniaxial loading:
aMises = Uy (1-3)
Triaxiality is defined as the ratio of the negative pressure to the Mises stress:
E
= _(1.4)UMises
High values of E (i.e. high -P) can lead to failure by a brittle mechanism due to, for example, the negative pressure, -P, reaching a critical value causing cavitation or crazing prior to the Mises stress reaching yield conditions (Equation 1.4) and enabling ductile plastic deformation. This is what happens under sharp notch conditions where
E is high. For example, in the sharp notch shown in Figure 1-1, the maximum level of
triaxiality is 1.3 compared to a triaxiality value of 0.33 present in un-notched uniaxial tension.
A few researchers have looked at the various opportunities for the characterization
of the behavior of notched cylindrical specimens. The triaxiality present in notched bars causes them to produce a greater amount of average axial stress than notched
Noth Root Radius 2 44E+V 322E+07 4.RE+01 e.tio +4. i n-+ Mises Stress Negative Pressure
Axial Stress (a22)
Figure 1-1: Schematic MPa.
of circumferentially notched bar. Far field tensile stress is 88.7
fTS 53 U4CC
the KIc of copper and steel. They found that as the ratio of the notch root radius to the net section decreases so does the fracture toughness. They also showed that if the root radius of the notch is too sharp it will embrittle the material at the notch tip
[23]. Hyakutake and Nisitani studied the behavior of notched bars and plates of PC.
In agreement with previous results, they found that for a given notch root radius, circumferentially notched bars failed in a brittle manner, while the notched plates (36mm width and 10mm thickness) failed in a ductile manner. They also showed that the nominal stress in the net section at failure is independent of specimen diameter, and is determined by the ratio of the net section to the notch root radius [16].
1.3
Toughened Polymers
An abundance of research has been conducted on the inclusion of second phase par-ticles to enhance the mechanical properties of polymers. Wu showed that dispersing rubber particles with proper size and spacing in nylon can increase toughness up to sixty times [29]. Muratoglu, et al., built upon this work by developing a model to explain the super toughening mechanisms of rubber in nylon [20]. Bartczak, et al., showed that rubber-modified high-density polyethylene can have toughness im-provements of up to sixteen times over the unmodified material [4]. Gensler, et al., found that rubber-modified polypropylene showed no ductile to brittle transition, even at extremely high loading rates, while the unmodified polypropylene behaved in a brittle manner at these increased rates [14]. Filler materials other than rubber have been shown to improve the properties of polymers as well. Bartczak, et al., also showed that high-density polyethylene could be toughened with calcium carbonate particles which simultaneously increased the Young's modulus [5]. Siegmann and Hiltner showed that the impact strength of PVC can be increased up to thirty times
by modifying it with chlorinated polyethylene [24].
Considerable work has also been done on the effects of rubber inclusions on the me-chanical behavior of polycarbonate. It is believed that the cavitation of these rubber
form and thus fail in a ductile manner. Core-shell particles are used because the shell allows for good dispersion of the particles and helps the particle to stay intact during processing. It was determined that polycarbonate toughened with linear polybutadi-ene resulted in a wide range of rubber particle sizes and did not enhance the toughness of the PC [12]. Kim et al found that core-shell rubber particles can effectively in-crease the toughness of PC [18]. Cheng, et al., tested single edged notched tension specimens of core-shell rubber-toughened polycarbonate. They determined that at a critical negative pressure the rubber particles in the material cavitate. The cavitation of these particles changes the way the light scatters and alters the appearance of the specimen. They designated this area of altered appearance the stress-whitened zone (SWZ) [11]. Cheng, et al., showed that the yield stress of rubber-modified PC blends decreased linearly as rubber content increased. They found that the Izod impact strength of PC modified with rubber increased up to six times at temperatures as low
as -40 C [9]. Tanrattanakul, et al., tested un-notched polycarbonate and
rubber-modified polycarbonate and found that the core-shell particles did not improve strain to failure at room temperature, but increased strain to failure at temperatures as low as -60 C [26]. Cheng, et al., also showed that the cavitation of rubber particles can
be accomplished by the cavitation of nearby rubber particles as well; they designated this as cooperative cavitation [10].
1.4
Thesis Outline
This thesis will examine the effects of temperature and strain rate on polycarbonate tested in both uniaxial tension and compression. Notched tension specimens will also be tested at various temperatures and strain rates. These specimens will have constant net section diameter and varying notch root radii. The effects of the increased negative pressure present in notched tension specimens on deformation and failure will be studied. Rubber-modified polycarbonate specimens of the same geometries will also be tested. The effects of rubber-toughening on deformation and failure of both un-notched and un-notched tension specimens will be studied.
Chapter 2
Methods and Materials
This chapter details the methods and materials used in this thesis research. The material used in this research is detailed. The specimens used to test the deformation and failure of these materials will be described. The experimental procedures used in this thesis research will then be detailed. The optical and electron microscopy performed in the analysis of the materials and the specimens are discussed. Finally, the finite element simulations used are also described.
2.1
Material
The homopolymer used in this thesis research was Makrolon 2608, supplied by the Bayer Corporation, Pittsburgh, PA. It came in the form of injection-molded bars
12.7 mm x 12.7 mm x 127 mm. The modified polymer had a Makrolon 2608 matrix
which included Rohm and Hass core-shell rubber particles. These particles had a
methyl-methacrylate
/
styrene shell and a polybutadiene core. The blends testedwere formulated to contain 5, 10, 20, and 30% rubber particles by volume. Sections of undeformed material were cryo-fractured. A scanning electron microscope was then used to study the microstructure of these surfaces. Image analysis software was then used to determine average particle size and range of particle size. Particle sizes
(N 5.08 L6 3.81mm DIA 6.35 0 R1.27 3.81 mm DIA 6.35 RO.76 Lb 3.81mm DIA 6.35 R1.905 L6
Figure 2-1: Axisymmetric tension specimens. All dimensions in mm.
2.2
Specimens
All tension specimens were machined to be cylindrical with threaded ends.
Un-notched specimens had a diameter of 5.08 mm and a gauge length of 15.24 mm. Notched specimens also had a gauge length of 15.24 mm, but a diameter of 6.35 mm. Semi-circular circumferential notches with radii of 0.76, 1.27, and 1.91 mm were machined into the specimens. All notched specimens had a net section diameter of 3.81mm. These specimens are shown in Figure 2-2.
blends were machined. These compression specimens had a diameter of 9.53 mm, and a height of 6.35 mm. All specimens were heated to and held at 140 C for two hours to remove residual stresses. The samples were then allowed to oven-cool.
2.3
Experiments
2.3.1
Tension
All tension tests were conducted using an Instron model 5582 screw machine.
Un-modified polycarbonate specimens were tested at cross-head speeds of 5, 50, and 500 mm/min. Rubber-toughened PC specimens were tested at only 5 and 500 mm/min. An Instron model 3119-007 temperature chamber was used to provide different test
temperatures. Unmodified PC specimens were tested at -60 C, 25 0 C (Room Temp),
and 100 0 C. Rubber-toughened PC specimens were only tested at 25 C, and -60 0 C.
Once the temperature chamber had reached the specified temperature, samples were allowed to thermally equilibrate for twenty minutes. Tests not conducted at room temperature were performed at a cross-head speed of 5mm/min. An Instron model
2630-100 clip-on extensometer with a gauge length of 12.7 mm was attached to the
specimens to obtain a more accurate value for displacement. For un-notched tests, displacement was measured with the extensometer for the first 6.4mm, then cross-head displacement was used. The entire displacement for notched specimens was measured using the extensometer. All tension tests were performed at least twice.
2.3.2
Compression
Compression tests were performed using an Instron 1350 with servo-hydraulic con-trols. An extensometer with a gauge length of 12.7 mm and a personal computer running LabView was used to control cross-head displacement. This ensured com-pression at constant true strain rate. WD-40 lubricant was placed on the platens and covered with a small sheet of Teflon. This was done to reduce the friction
be-rates of 0.001, 0.01, and 0.1/s. Unmodified PC specimens were also tested at 60" C and 100 C at 0.001/s. These specimens were heated using an electric resistance heater. Once the specified temperature was reached, these specimens were also al-lowed to thermally equilibrate for twenty minutes. Rubber-toughened blends of PC were tested only at room temperature at a strain rate of 0.01/s. All compression tests were performed at least twice.
2.4
Microscopy
2.4.1
Optical
All fracture surfaces were examined with an optical microscope. Optical microscopy
was performed using a Carl Zeiss stereo-microscope. A Nikon digital camera was attached to acquire digital images. Rubber-toughened specimens were sputter-coated with a thin layer of Au/Pd to improve contrast.
2.4.2
Electron
Scanning electron microscopy was performed using a JOEL model 6320FV field emis-sion high resolution scanning electron microscope. Samples were sputter-coated with a thin layer of Au/Pd. Electron microscopy was used to examine undeformed material and the fracture surfaces of rubber-toughened specimens.
2.5
Finite Element Modeling
Finite element simulations of uniaxial tension, compression, and notched tension were performed using ABAQUS v5.8. A user material subroutine of the constitutive model of Arruda and Boyce was used for this analysis [6] [7] [1] [2]. Compression tests were performed on unfilled Makrolon to determine the material constants for this model. Due to the axisymmetry of the samples only one-quarter of the specimen was modeled. This model was then tessellated to give a representative picture of the
sample. The meshes used for each geometry are shown in Figure 2-2. Axisymmetric 8-node reduced integration elements (ABAQUS element type CAX8R) were used for all analyses. Deformations were displacement-controlled according to the parameters of the experiments.
Unnotched
ii-0.76 mm Notch
1.27 mm Notch
1.905 mm Notch
Chapter 3
Unfilled Polycarbonate
This chapter details the results of uniaxial compression and tension of polycarbonate homopolymer. Both compression and tension tests are performed at various tempera-tures and strain rates. Three notched geometries of the polycarbonate homopolymer are also tested in uniaxial tension at various strain rates and temperatures. A sum-mary of the results is given at the end of this chapter.
3.1
Uniaxial Compression
Figure 3-1 shows uniaxial compression tests performed at three strain rates. The stress-strain behavior exhibits an uniaxial linear elastic response, this is followed by a nonlinear transition to yield, followed by yield, strain softening, and then strain hardening at large strains. As seen in the figure, there is a small dependence of the yield stress on the strain rate. Strain softening and hardening are essentially independent of strain rate. As previously mentioned, compression specimens were used to calibrate the Arruda-Boyce model used in this analysis. The constitutive model and material properties used for these simulations are detailed in Appendix
A. Figure 3-2 shows compression of PC at room temperature at a strain rate of
0.001/s. Figures 3-3 and 3-4 show the results of tests at strain rates of 0.01/s and 0.1/s respectively. As seen in these figures the model seems to capture all aspects of
90 80 70 60 50 40 30 20 10 0.1/s -
f
-0.01/s 0.001/sII
-1
-/ 100 01 02 03 04 050-07 08 09 0 0.1 0.2 0.3 0.4 0.5 0.6 0.7 0.8 0.9 1 StrainFigure 3-1: Uniaxial compression at various strain rates at room temperature.
0 0.1 0.2 0.3 0.4 0.5
Strain 0.6 0.7 0.8 0.9
Figure 3-2: Simulation and experimental data of uniaxial compression of PC at room temperature at a strain rate of 0.001/s.
- Simulation .. Experiment -f 0U 90 80 70 60 50 40 30 20 10 100. U,
90 80 70 60 . 50 40 30 20 10 0 0.1 0.2 0.3 0.4 0.5 0.6 0.7 0.8 Strain
Figure 3-3: Simulation and experimental data of uniaxial compression of PC at room temperature at a strain rate of 0.01/s
0 0.1 0.2 0.3 0.4 0.5
Strain
Figure 3-4: Simulation and experimental temperature at a strain rate of 0.1/s.
data of uniaxial compression of PC at room
- - Simulation - Experiment 0.9 0 - Simulation 0-Experiment 0 - 0-0 -- 0--0 -0 0 (-U) 0.6 0.7 0.8 0.9 Inn 9 8 7 6 4 3 2 I
90- Y 80-Room Temperatured 70-W Z 60 C 60p
at
-50-5401 30 1-0 s 20- 1 10 I 0 0 . 0.2 0.3 0.4 0.5 0.6 0.7 0.8 0.8 1 StrainFigure 3-5: Uniaxial compression at various temperatures at a strain rate of 0.001/s
There is a noticeable temperature dependence on the yield stress of the PC
com-pression specimens, as seen in Figure 3-5. The yield stress at 60 QC is 16
%
lowerthan that of the room temperature test at the same rate. The yield stress at 100 s C is almost 35 % lower than that of the comparable room temperature test. Figures 3-6 and 3-7 show the experimental and simulation data for 60 'C and 100 'C respectively. The yield stress and initial softening are captured well by the model in both cases. There is a divergence between model and the experimental results at the later hard-ening stages at these elevated temperatures. This is due to the fact that there is less
hardening due to entanglement slippage at high temperatures, which is not included in this model. Table 3.1 shows the yield stress and elastic modulus of PC tested in uniaxial compression as a function of both temperature and strain rate. Future work can address this dependence using the model proposed by Arruda, Boyce, and Jayachandran [3].
0 0.1 0.2 0.3 0.4 0.5 0.6 0.7 0.8
Strain
Figure 3-6: Simulation and experimental data of uniaxial compression at a strain rate of 0.001/s 0~ 90 80 70 60 50 40 30 20 10 0 0.1 0.2 0.3 0.4 0.5 0.6 0.7 Strain 0.8 0.9
Figure 3-7: Simulation and experimental data of uniaxial compression at a strain rate of 0.001/s of PC at 60'C of PC at 100
C
90 80 70 60 50 40 30 20 10 0.9 Simulation 'Y Experiment 1 nn. -Simulation -Experiment U,Table 3.1: Elastic moduli and yield stress as a function of temperature and strain rate.
Temperature (K) Strain Rate Yield Stress (MPa) Elastic Modulus (MPa)
298 0.1/s 82.2 2054
298 0.01/s 77.0 2227
298 0.001/s 75.5 1948
333 0.001/s 62.9 1760