DOI 10.1007/s00191-012-0273-5 R E G U L A R A R T I C L E
How do different motives for R&D cooperation
affect firm performance? – An analysis based on Swiss
micro data
Spyros Arvanitis
Published online: 16 June 2012 © Springer-Verlag 2012
Abstract The starting point of our analysis is the empirical fact that firms pursue different goals when getting engaged in R&D collaborations, often more than one goal at the same time. Given that firms are driven by different motives for R&D cooperation, the aim of this article is to investigate the differences related to different motives with respect to the impact of R&D cooperation on firm innovativeness and firm productivity. Not only R&D cooperation in general but also cooperation driven by each of the seven motives considered in this paper correlate positively with the sales share of innovative products. With respect to innovativeness, the characterization of cooperation by the driving motive did not add much more than could be gained through the overall variable ‘R&D cooperation yes/no’. Technology-motivated collaborative activities show a weaker tendency to positive direct effects on productivity than cost-motivated cooperation. In this case, the distinction of several cooperation motives yields some additional insights as compared to the overall cooperation variable. On the whole, distinguishing various cooperation motives appears to be fruitful because it allows more differentiated insights that would remain hidden behind the overall variable “R&D cooperation yes/no”.
Keywords R&D cooperation· Innovation · Productivity
JEL Classification O31
S. Arvanitis (
B
)ETH Zurich, Swiss Economic Institute, Zurich, Switzerland e-mail: [email protected]
1 Introduction
This paper is mainly motivated by the observation of the necessity of the acqui-sition of new knowledge as a precondition for successful innovative activities of enterprises. New knowledge is not only generated inside the boundaries of a firm but also is acquired from the environment. Even the largest and most technologically self-sufficient enterprises require knowledge from beyond the firm boundaries. In addition to own research and development (internal R&D), enterprises typically are engaged in the trading of knowledge on the technology market (contract or external R&D) and/or co-operate actively— formally or informally—with other firms and research institutions. For applied industrial economics, it is an important task to understand how firms integrate internal knowledge and various types of externally acquired knowledge. In the last years, there has been an increasing interest in the economic literature to analyze the motives and determinants of alternative knowledge acquisi-tion strategies (own R&D, R&D co-operaacquisi-tion, contract-R&D, etc.; see, e.g.,
Cassiman and Veugelers2006; Belderbos et al. 2006). An important motive
for this research interest is the improvement of our understanding of the role of such strategies with respect to (a) the innovation performance and (b) the output performance of enterprises that engage in such strategies. Thus, there is also an increasing interest in assessing the impact of various knowledge acquisition strategies on the innovation and economic performance of a firm. Better insights into knowledge acquisition strategies and their impact on firm performance would allow the formulation of a knowledge-based technology policy.
In this paper, we concentrate on R&D cooperation. The starting point of our analysis is the empirical fact that firms pursue different goals when engaged in R&D collaborations, often more than one goal at the same time (see,
e.g., Hagedoorn1993; Hagedoorn et al.2000). Given that firms are driven by
different motives for R&D cooperation, the aim of this article is to investigate the differences related to different motives with respect to the impact of R&D cooperation on firm innovativeness and firm productivity.
To this end, we utilized data on seven different motives for R&D coop-eration reported by Swiss firms in the years 1999, 2002 and 2005. Based on these data, we distributed cooperating firms into seven groups, according to the importance for them of each of the seven cooperation motives. Thus, we constructed a dichotomous variable for each of these cooperation motives. In a second step, we specified an innovation equation and a productivity equation, respectively, that included separately each of the seven cooperation motives as right-hand variables. These were estimated by random effect tobit and random effect OLS techniques, respectively, after testing for endogeneity for the seven motive variables. We also estimated the two impact equations for the overall cooperation variable (‘R&D cooperation yes/no) as reference.
New elements of this study are (a) the consideration of seven distinctive motives for R&D cooperation; (b) the investigation of the impact of these
different motives on innovation and productivity; (c) the coverage of all sectors of the economy (manufacturing; services; construction); and (d) the consideration of more than one cross-section of firms, as is usually the case.
The plan of the study is as follows: in Section2, we discuss the theoretical
background of the study. Section 3offers a summary of relevant empirical
literature. In Section4, we present the main hypotheses. Section5is committed
to the presentation of the data used. Section6contains a short discussion of
the seven different R&D cooperation motives investigated. The specification
of the empirical models to be estimated is presented in Section7. In Section
8, the results of the econometric estimations are discussed. Finally, Section9
contains a summary of the most important results and some conclusions.
2 Conceptual background
Our conceptual approach builds on two different strands of literature on R&D cooperation. The first is the industrial organization (IO) literature, the second the management literature.
2.1 Industrial organization approach: what are the motives for R&D cooperation?
R&D cooperation, particularly in the form of research joint ventures, is an important single knowledge acquisition strategy that has been the subject of theoretical and empirical analysis for some years. Economic research in the field of R&D cooperation essentially aims at understanding why firms undertake R&D cooperation, how they do it, and with what result (see Kaiser
2002and De Bondt1996for reviews of this literature). We concentrate here
on why firms undertake R&D cooperation, and thus on the motives for R&D cooperation.
One of the most influential theoretical papers in this field is that of
D’Aspremont and Jacquemin (1988). They derived a two-stage Cournot
duopoly game, in which firms decide upon R&D investment and then compete in the product market. R&D expenditures are larger in research joint ventures than in the competition case if (exogenous) spillovers exceed a critical value. According to this approach, the main motive for R&D cooperation is the internalization and better utilization of knowledge that is easily leaking out to competitors in the framework of a cooperation contract.
An interesting generalization of the framework of D’Aspremont and
Jacquemin (1988) was achieved by Kamien et al. (1992). Key findings of this
paper are that (a) effective R&D investment is larger under research joint ven-tures than under competition if spillovers are sufficient large, (b) an increase in spillovers leads to a reduction of research efforts if goods are complements (substitutes) and spillovers are large (small) and also tends to reduce incentives to collaborate in R&D, (c) an increase in market demand leads to an increase
of research efforts both under research joint venture and research competition (an increase of market demand has a positive effect on the likelihood of R&D cooperation), and (d) increased research productivity leads to increased incentives to invest in R&D and also to conduct joint-research. The main motive for R&D cooperation is in this model the same as in D’Aspremont and
Jacquemin (1988), but the substitutive or complementary relation between the
products of the collaborating firms is also an important determining factor. Moreover, this extended model framework offers more theoretical insights as to the conditions (high demand, high research productivity) under which R&D cooperation takes place, given the main motive of internalization of knowledge externalities.
In a further paper, Kamien and Zang (2000) tried to integrate in their
theoretical framework the idea of endogenous absorptive capacity, i.e. the idea that firms can determine through their own research effort the extent of absorption of external knowledge. The most important empirically result is that research joint ventures are more likely to occur the more “general” (in contrast to “specific”) the R&D agenda. The less specific the R&D agenda, the greater is the possibility of spillovers, thus the greater the likelihood that R&D cooperation would be used as a mean of internalization of knowledge externalities. The R&D “specificity” argument is quite in accordance to the
transaction costs approach (see, e.g., Williamson1975).
2.2 Management literature approach to motives of R&D cooperation
The second strand of literature we take into consideration, namely the man-agement literature, provides further helpful insights with respect to different
motives of R&D cooperation. Following Calogirou et al. (2003), we distinguish
three approaches within this literature. A first group of studies views R&D cooperation (more concretely, R&D joint ventures) as efforts of firms to shape the competitive environment in which they operate (see, e.g., Harrigan
1988; Porter1990). Shaping competition and improving a firm’s competitive
position can be reached by sharing value chains with partners in a way that broadens the effective scope of a firm’s own value chain. A second approach emphasizes resources and capabilities building on the resource-based view of
the firm originally developed by Penrose (1959) and further elaborated by
Teece (1982; dynamic capabilities approach) and Prahalad and Hamel (1990;
core competences concept). In this view, technological alliances are effective organizational modes for gaining access to new and/or complex technologies as additional resources. Finally, a third approach focuses on the influence of uncertainty on the generation of new knowledge. Sharing of technological risks of the development of new technologies and learning processes referring to new specialized and complex technologies are important motives for building inter-firm technological alliances, according to this approach (see, e.g., Kogut
1988; Dodson1991; Teece1992).
Finally, Hagedoorn (1993) in a survey of the management literature on
and develops a taxonomy of cooperation motives that was used together with the insights from the management literature to identify the most important co-operation motives. He distinguishes three main groups of motives for interfirm technology cooperation: (a) motives related to basic and applied research and some general characteristics, (b) motives related to concrete innovation processes or projects in a joint activity of two or more companies, and (c) motives related to market access and search for opportunities. The first group refers to reduction and sharing of costs, reduction and sharing of uncertainty in R&D, as well as to increased complexity of new technologies, monitoring of evolution of technologies, technology synergies or complementary technology. The second one is related to reducing of the period between invention and market introduction or shortening of product life cycle. The third category of cooperation motives is associated with aspects such as the expansion of product range, entry to markets of new products or entry to the foreign market. In sum, Hagedoorn emphasizes that concrete understanding of the motives of firms to engage in innovation cooperation provides additional insights to purely theoretical understanding of cooperation as an alternative organizational form of processing innovation to both markets and hierarchies.
2.3 Impact of R&D cooperation on economic performance
The theoretical literature in industrial organization (IO) has already addressed the important question about the relation of R&D cooperation and economic
performance. This is also clear in the models discussed in Section2.1.
Accord-ing to Link and Siegel (2003; Ch. 11), who wrote a survey on this literature, in
general the answer to this question is that the propensity to R&D cooperation is positively related (a) to economic efficiency and (b) to the increase of consumer surplus through new or improved products or the faster introduction of such new or improved products.
The predominant static models with spillovers of the industrial organization (IO) approach predict mostly under-investment in R&D due to external costs caused by low appropriability of innovation gains. These models consistently find that research collaborations tend to alleviate the appropriability problem in the presence of high spillovers. Cooperating firms reduce duplicative
re-search and are able to more fully appropriate innovation gains.1
The management literature treats R&D alliances as a specific type of organizing R&D activities that could lower transaction costs. Besides the avoidance of duplication of research results, synergies between cooperation partners could give rise to economies of scope and learning (through the transfer of experience among partners).
1See Link and Spiegel (2003; Ch. 11) for a more detailed discussion of other types of much less
frequently used IO models that do not come to clear-cut results with respect to the impact of cooperation on firm performance.
In particular, Ahuja (2000, p. 429ff.), in a paper on collaboration net-works, argues that collaboration in innovation can affect a firm’s innovative output positively by providing three substantive benefits: knowledge sharing, knowledge complementarity and knowledge scale. As to knowledge sharing, the idea is that, when firms collaborate in R&D, the knowledge that is commonly generated is available to all partners. Thus, each single partner can potentially obtain a greater amount of knowledge than would be the case from a comparable research investment made individually. As to complementarity, the main argument is that the innovation process often demands the parallel use of different knowledge packages, the development and maintenance of which may prove to be difficult for many firms. Under such circumstances, cooperation can enable firms to exploit economies of specialization that other-wise would not be feasible without significantly larger investments. The third positive effect of cooperation on innovation performance results through the exploitation of economies in R&D that is made feasible through cooperation.
In a further relevant study, Sarkar et al. (2001) formulated (and tested
empirically) two more specific hypotheses that may prove fruitful also for further research. The starting point is that the propensity to R&D coop-eration (“alliance proactiveness”) would be associated with higher levels of economic performance in terms of sale growth, market share and product development. The new elements in this analysis are the moderating roles of perceived technological uncertainty and of the size of the collaborating enterprise. The authors argue that the possibility of internalizing technological risks enhances innovation performance. Further, alliances between partners of unequal size mostly provide larger firms access to the tacit knowledge of small firms, which in turn benefit from the financial and marketing resources of the larger ones. Under such circumstances, the specific know-how of the small firms may increase their bargaining power vis-à-vis the large ones, thus enabling them to improve their economic performance. As a consequence, the higher the technological uncertainty and the smaller the cooperating firm, the stronger the (positive) relationship between the propensity of cooperation and performance.
A further group of studies investigates the influence of the position of a firm in a network of alliances, as well as the characteristics of networks on the
performance of a collaborating firm. For example, Powell et al. (1996)
devel-oped the hypothesis that the growth of collaborating firms depends positively on (a) the degree of centrality of the firm in a network of cooperating firms and (b) the network experience in fields of activity other than R&D. Baum
et al. (2000) formulated a series of hypotheses about the impact of several
network characteristics such as the size and the efficiency of a network, the innovative capabilities of the network partners and the degree of external and internal competition, particularly on the performance of startups participating in a network.
On the whole, there is a tendency in the theoretical literature to expect a positive impact of R&D cooperation on innovativeness and economic efficiency.
3 Review of selected relevant empirical literature
We concentrate here on the impact of cooperation on innovativeness and
economic performance because these topics are also the focus of this paper.2
We consider only studies that were published after 2000. (See Link and Siegel
2003, Ch. 11 for a survey of literature on this topic before 2000.) Existing
studies refer primarily to European countries (Belgium, Finland, France, Germany, the Netherlands and Sweden) and Japan and two of them refer to the USA. The research setting consists mostly of an innovation equation, which contains, among other innovation-relevant variables, measures for innovation cooperation, often differentiated by partner category (suppliers, customers, universities, etc.). A few papers investigated also the impact of cooperation on economic performance (e.g., sales growth, value added per employee).
A number of empirical studies have found a positive impact of engaging in R&D cooperation on innovation performance usually measured by the
sales share of innovative products. (See, e.g., Lööf and Heshmati2002; and
Belderbos et al. 2004b.) Moreover, Belderbos et al. (2004b) assumed (and
found confirmed by their empirical analysis) that labour productivity may be positively affected by collaborative R&D aimed at cost reductions, while sales increase through innovative products is more likely to be related to collaboration that is more oriented to basic R&D efforts. Further studies with positive effects of (overall) innovation cooperation on innovation performance
measured by different indicators can be found in Czarnitzki et al. (2007) for
German and Finnish firms and Simonen and McCann (2008) for Finnish firms.
Other studies have found little or no evidence for a significant correlation between cooperation and innovation performance as measured by output
indicators. (See, e.g., Kemp et al.2003; Okamuro2007; Aschhoff and Schmidt
2008). There is a tendency for cooperation propensity to correlate positively
with input but not with output innovation indicators. (See, e.g., Klomp and
van Leeuwen2001). Distinguishing between cooperation with national and
international partners, Miotti and Sachwald (2003) showed that, in France,
innovation performance was not affected by cooperation agreements with national partners but increased by cooperation with foreign partners. Lööf and
Heshmati (2002) found positive effects of cooperation for both national and
international partners.
Adams and Marcu (2004), in a study based on USA firm data covering
the years 1991 and 1996, found the participation in R&D joint ventures to be positively correlated with an indicator for new products but not with an indicator for patents. The authors concluded that joint research aims at commercialization but not invention.
2Some studies used explicitly motive variables as right-hand variables in cooperation equations in
addition to the factors postulated by theory. (See, e.g., Sakakibara1997; Bayona et al.2001; Lopez
2008; Arvanitis and Bolli2012; Woerter2011). We could find only one study that investigated motives of innovation R&D cooperation in a setting using motive variables as left-hand variables in a cooperation equation (Schmidt2007).
Darby et al. (2004), in a further study based on USA firm data, found that participation in R&D joint ventures organized by the Commerce Depart-ment’s Advanced Technology Program (ATP) increased significantly innova-tion as measured by patenting.
Most of the studies that distinguished various types of cooperation partners found that the impact of cooperation on innovativeness depends heavily on the type of partner, but no general pattern is discernible. For countries with more than one study, the findings sometimes differ from study to study, due to the fact that they often use different firm cross-sections, different model specifications and different econometric methodologies. In sum, there is a relatively large heterogeneity of results, but nevertheless a general tendency for positive effects of cooperation on innovation performance is also dis-cernible. We could find only too few studies on the impact of cooperation on
productivity (Cincera et al.2003; Belderbos et al.2004b) to be able to make a
general assessment of such effects.
4 Resulting hypotheses
Based on the above discussion of the theoretical and empirical literature, we formulate the following hypotheses for the empirical part of the study: Hypothesis 1: Cooperative R&D enhances innovation performance (through new or improved products or faster introduction of such new or improved products);
Hypothesis 1a: We would expect that particularly the effects of motives that are more oriented towards the acquisition of new knowledge would be sig-nificantly larger than the effects of more cost- and fund-oriented motives. Hypothesis 2: Cooperative R&D enhances firm productivity (through the reduction of innovation costs and/or the utilization of economies of scale, scope, or learning).
Hypothesis 2a: In addition, we would expect positive effects, particularly for more cost- and fund-oriented cooperation motives.
Hypothesis 2b: We would further expect that this effect is stronger when the reduction of technological risks is an important cooperation motive;
5 Data
The data used in this study were collected in the course of three surveys among Swiss enterprises in the years 1999, 2002 and 2005, using a questionnaire that included, besides questions on some basic firm characteristics (sales, exports, employment, investment and employees’ vocational education), several in-novation indicators quite similar to those in the Inin-novation Surveys of the European Community (CIS), as well as information on R&D cooperation
projects (type of partners, motives, etc.).3 The survey was based on a (with
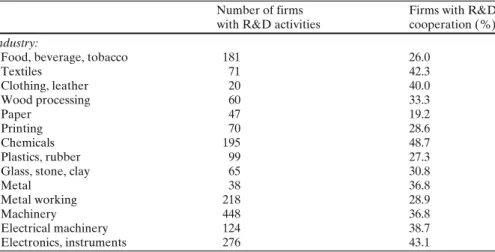
respect to firm size) disproportionately stratified random sample of firms with at least 5 employees covering all relevant industries of the manufacturing sector, the construction sector and selected service industries, as well as firm size classes. On the whole, 28 industries were studied, and within each industry, three industry-specific firm size classes with full coverage of the upper class of large firms. The response rate was, in the first wave, (1999) 33.8%, in the second wave (2002), 39.6%, and in third wave, 38.7%, respectively. The response rates did not vary much across industries and size classes with a few exceptions (overrepresentation of machinery, underrepresentation of clothing/leather, wood processing and hotels/catering).
We used in this study only data for firms conducting R&D activities in the
relevant period.4 The final data set includes 2922 enterprises from all fields
of activity and size classes. (See Table 6 in the appendix for the structure
of the used data set by industry, firm size class and year, respectively.) Our questionnaire provides information on different motives firms pursued in a certain period, but a firm could conduct more than one R&D cooperation project in this period. Thus, we cannot distinguish between firms that pursue more than a motive at the time for a certain cooperative project and firms that have more than one cooperative project in the reference period but with different motives.
6 Descriptive analysis: motives of R&D cooperation
Under “R&D cooperation” we understand cooperative activities in R&D that could take the form of R&D agreements, agreements for technological exchange, joint ventures in R&D, etc. Contract R&D is explicitly not included in the definition we use in our survey. According to the above definition, 997 firms, i.e. 34.1% of firms with R&D activities in our sample, reported R&D
cooperation (see Table 1). The share of cooperating firms varied between
27.4% (2002) and 38.7% (1999). Based on management literature we identified six single motives for R&D cooperation. Three of them refer to f inancial or cost requirements: reduction of technological costs (MOT1), saving R&D costs (MOT2), and reduction of product development time (MOT3). A fourth one is also a financial motive and is related to the utilization of public promotion grants for which a cooperative project is a precondition (MOT7). Three further motives reflect primarily knowledge requirements: access to specialized new technology (MOT4), utilization of technological synergies (MOT5), and access to complex new technology (MOT6).
3Versions of the questionnaire in German, French and Italian are available atwww.kof.ethz.ch. 4Since we did not correct for a possible sample selection bias for firms that did not conduct R&D,
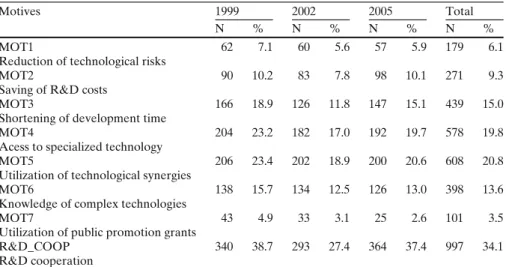
Table 1 Motives for R&D cooperation
Motives 1999 2002 2005 Total
N % N % N % N %
MOT1 62 7.1 60 5.6 57 5.9 179 6.1
Reduction of technological risks
MOT2 90 10.2 83 7.8 98 10.1 271 9.3
Saving of R&D costs
MOT3 166 18.9 126 11.8 147 15.1 439 15.0
Shortening of development time
MOT4 204 23.2 182 17.0 192 19.7 578 19.8
Acess to specialized technology
MOT5 206 23.4 202 18.9 200 20.6 608 20.8
Utilization of technological synergies
MOT6 138 15.7 134 12.5 126 13.0 398 13.6
Knowledge of complex technologies
MOT7 43 4.9 33 3.1 25 2.6 101 3.5
Utilization of public promotion grants
R&D_COOP 340 38.7 293 27.4 364 37.4 997 34.1
R&D cooperation
Percentage of firms reporting the values 4 and 5 on a five-point Likert scale (1: ‘not important’; 5: ‘very important’). Basis: firms with R&D activities
Starting point of our analysis is the fact that firms mostly pursue more than one motive at a time in R&D cooperation. This is demonstrated by the
figures in Table1that show the frequency of reporting of the seven different
motives taken into account in this study. The most frequent motives for all three periods are (a) the utilization of technological synergies (MOT5) and (b) the access to specialized technology (MOT4). Shortening of development time (MOT3) and acquisition of knowledge of complex technologies (MOT6) seem to be somewhat less important than MOT3 and MOT5. Reduction of technological risks (MOT1), saving R&D costs (MOT2) and utilization of public promotion grants for which a cooperative project is a precondition (MOT7) are pursued in most cases by less than 10% of cooperating firms. The proportions between the motives remained relatively stable over time, pointing to a rather stable pattern of motives of R&D cooperation.
Given that most literature on cooperation focuses on the partners engaged in such agreements (suppliers, competitors, customers, universities, etc.), it would be interesting to throw a glance on the relationship between cooperation motives and cooperation partners. We found that pursuing a certain category of motives is not related with any specific type of cooperation partner. For ex-ample, 61.0% of firms with cost-oriented motives were engaged in cooperative projects with vertical partners (suppliers, clients, etc.), 61.5% with horizontal partners (competitors) and 66.3% with universities and research institutions. The respective figures for firms pursuing knowledge-oriented motives were 79.2%, 77.9% and 84.3%. Thus, the realization of a certain cooperation motive appears to be independent of the partner category involved in a cooperation agreement. For example, a cost reduction goal can be realized with a supplier, a customer or even a university depending, among other things, on the nature of the technology involved.
7 Model specification and construction of variables 7.1 Innovation equations
As dependent variable we used the natural logarithm of the sales shares of innovative products (new products and considerably modified products; variable LINNS). The specification of the innovation variable followed the resource-based approach of innovation, thus containing variables for R&D (natural logarithm of R&D expenditure divided by sales; LRDS) and human capital input (natural logarithm of the share of employees with tertiary-level education; LHC). The effect of R&D cooperation on innovation performance was taken into consideration by inserting separately the dichotomous variables
for cooperation motives.5 Further, the innovation equation included the two
competition measures (IPC; INPC) and controls for foreign forms, firm size,
industry affiliation and survey year. (See Table2for the definition of the model
variables.)
Based on standard empirical evidence from earlier studies, we expected pos-itive effects of the human capital variable (LHC), the R&D intensity (LRDS), the intensity of non-price competition (INPC) and—to a lesser extent—the
intensity of price competition (IPC), and firm size (see Arvanitis2008). The
effect of the variable FOREIGN was not a priori clear.
The original five-level ordinate variables (1: not important”; 5: ‘very im-portant”) were transformed to binary variables (value 1: levels 4 and 5 of the original five-level variable; value 0 for the levels 1, 2 and 3 of the original
variable).6 According to hypothesis 1, we would expect that, in general, all
motives would contribute to high innovation performance but not to the same extent. Moreover, we would expect that, particularly, the effects of motives that are more oriented towards the acquisition of new knowledge (MOT4, MOT5, and MOT6) would be significantly larger than the effects of more cost-and fund-oriented motives (MOT1, MOT2, MOT3 cost-and MOT7) (hypothesis 1a).
A formal expression of the innovation equations is as follows: LINNSit = α0+ a1LRDSit+ α2LHCit+ α3IPCit+ α4INPCit
+ α5R&D_COOPit+ α6LEMPLit+ α7FOREIGNit
+ industry and time controls + eit (1)
5Due to strong multicollinearity, it was not possible to have all seven variables for cooperation
motives in the same innovation equation (see Table8in theAppendix).
6As a referee suggested, the construction of binary variables may entail the possibility of
informa-tion loss or ambiguity of results, depending on the choice of threshold for the construcinforma-tion of the variable, for example 3 or even 2 instead of 4. We estimated the productivity models (a) adding the variable R&D_COOP in order to control for cooperation activities in general and (b) using the five-level ordinal variables instead of the binary variables. In case (a), the variable R&D_COOP was statistically insignificant and the results for the motive variables were quite similar to those in Table5. In case (b), the ordinal variables showed qualitatively the same effects as in Table5. We conclude that the use of binary variables did not cause any discernible distortions.
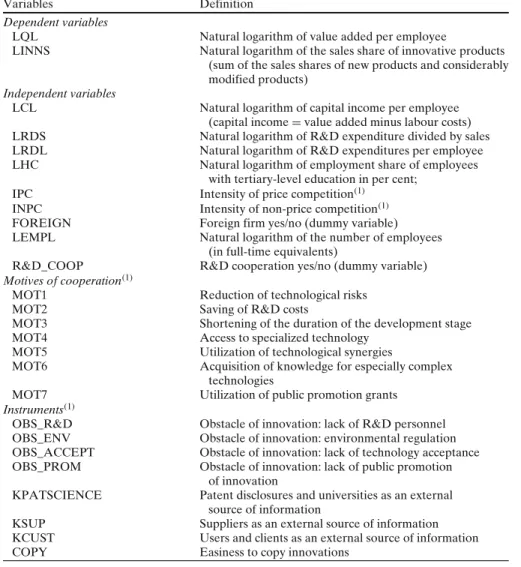
Table 2 Definition of model variables
Variables Definition
Dependent variables
LQL Natural logarithm of value added per employee
LINNS Natural logarithm of the sales share of innovative products (sum of the sales shares of new products and considerably modified products)
Independent variables
LCL Natural logarithm of capital income per employee (capital income= value added minus labour costs) LRDS Natural logarithm of R&D expenditure divided by sales LRDL Natural logarithm of R&D expenditures per employee LHC Natural logarithm of employment share of employees
with tertiary-level education in per cent; IPC Intensity of price competition(1)
INPC Intensity of non-price competition(1) FOREIGN Foreign firm yes/no (dummy variable) LEMPL Natural logarithm of the number of employees
(in full-time equivalents)
R&D_COOP R&D cooperation yes/no (dummy variable)
Motives of cooperation(1)
MOT1 Reduction of technological risks
MOT2 Saving of R&D costs
MOT3 Shortening of the duration of the development stage MOT4 Access to specialized technology
MOT5 Utilization of technological synergies
MOT6 Acquisition of knowledge for especially complex technologies
MOT7 Utilization of public promotion grants
Instruments(1)
OBS_R&D Obstacle of innovation: lack of R&D personnel OBS_ENV Obstacle of innovation: environmental regulation OBS_ACCEPT Obstacle of innovation: lack of technology acceptance OBS_PROM Obstacle of innovation: lack of public promotion
of innovation
KPATSCIENCE Patent disclosures and universities as an external source of information
KSUP Suppliers as an external source of information KCUST Users and clients as an external source of information COPY Easiness to copy innovations
(1): Transformations of originally five-level ordinate variables (1: ‘not important’; 5: ‘very impor-tant’) to a binary variable (value 1: levels 4 and 5 of the original five-level variable; value 0 for the levels 1, 2 and 3 of the original variable
LINNSijt= β0i+ β1jLRDSijt+ β2jLHCijt+ β3jIPCijt+ β4jINPCijt +β5jMOTijt+ β6jLEMPLijt+ β7jFOREIGNijt
+ industry and time controls + eijt (2)
7.2 Productivity equations
As independent variable, we used the natural logarithm of value added per employee (variable LQL). The productivity equation contained measures for physical capital (natural logarithm of capital income per employee; LCL), human capital (LHQUAL) and R&D (natural logarithm of R&D expendi-tures per employee; LRDL), as well as controls for foreign firms, firm size,
industry affiliation and survey year. (See Table2for the definition of the model
variables.) The effect of R&D cooperation on innovation performance was taken into consideration by inserting separately the dichotomous variables for
cooperation motives.7
We expected positive values for the variables for physical capital, human
capital and R&D expenditure per employee (see also Arvanitis 2008).
Ac-cording to hypothesis 2, we would expect throughout positive effects for all cooperation motives, particularly for more cost- and fund-oriented motives (MOT1, MOT2 MOT3, and MOT 7) (hypothesis 2a). We would further expect that the effect on productivity is stronger when the reduction of technological risks is an important cooperation motive (hypothesis 2b in accordance to
Sarkar et al.2001).
A formal expression of the innovation equations is as follows: LQLit = γ0+ γ1LRDLit+ γ2LHCit+ γ3LCLit+ γ4IPCit
+ γ5INPCit+ γ6R&D_COOPit+ γ7FOREIGNit+ γ8LEM PLit
+ industry and time controls + eit (3)
LQLijt= δ0j+ η1jLRDLijt+ δ2jLHCijt+ δ3jLCLijt+ δ4jIPCijt
+ δ5jINPCijt+ δ6jMOTijt+ δ7jFOREIGNijt+ δ8jLEMPLijt
+ industry and time controls + eijt (4)
[firm i; j: 1,. . . ,7 (cooperation motives); t: 1999; 2002; 2005].
8 Empirical results
8.1 Methodological remarks 8.1.1 Sample selection bias
The variables for the cooperation motives are measured only for the cooperat-ing firms. This might give rise to a sample selection problem for the estimation
7Belderbos et al. (2004b) recommended controlling for external knowledge sources and R&D
expenditures in the productivity equation. We refrained here from taking the external source variables into consideration because of strong multicollinearity between some of these variables and the motive variables.
of the cooperation motive equations that cannot be econometrically solved in a panel data setting as easily as is usually done in a cross-section setting
by applying the methodology proposed by Heckman (1979). Moreover, there
is a problem of interdependence of the motive variables due to the fact that most of the firms reported more than one option on the questions of motives
(see also Section6) that renders more difficult a Heckman-type solution as
is implemented in most statistical packages. As an alternative, in a first step,
we set all non-cooperating firms to zero for all motive variables.8 Thus, the
zero value of the motive variables refers not only to cooperating firms but also to non-cooperating firms. This has to be taken into account when the results are interpreted. A possible objection to the chosen approach could be that the differences among cooperating firms with different motives – the specific topic of this study – would be dominated by the differences between cooperating
and non-cooperating firms. The comparison of the results in Table3for the
dichotomous variable R&D_COOP and Tables4and5for the single motives
show that this not the case.
8.1.2 Endogeneity of the cooperation motive variables
A further econometric issue refers to the possibility of endogeneity of the motive variables when used as right-hand variables in the innovation and the productivity equation respectively.
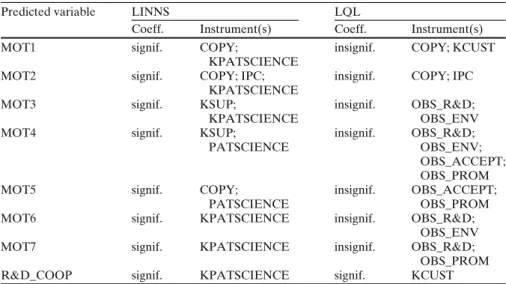
We tested endogeneity by applying the procedure by Rivers and Vuong
(1988) separately for each cooperation motive variable. The coefficients of
the residuals (predicted instrumented variables minus original variable) in the innovation equations were statistically significant at the10% test level for all seven motive variables as well as for the overall cooperation variable. (See
Table9in theAppendix; the instruments used are also listed in column 2; the
definition of the instruments is found in the lower part of Table2.) Therefore,
there is significant evidence for endogeneity in the innovation equation. As
a consequence, Table3, column 1 and Table 4 show only the estimates of
the innovation equation based on the predicted instrumented variables for the overall cooperation variable and the seven cooperation motives, respectively. For the estimation of the innovation equations, we applied a Tobit random effect estimator. Bootstrapping was used in order to estimate the standard errors of the estimated parameters.
A similar procedure was used to test endogeneity in the productivity
equations. Table 9in the Appendix shows the used instruments as well as
the results of the respective tests. In this case, we could not find any evidence for endogeneity, with the exception of the overall cooperation variable. Thus,
Table3, column 2 shows the estimates based on the predicted instrumented
8See Belderbos et al. (2004a), Capron and Cincera (2004) and Schmidt (2007) for a similar
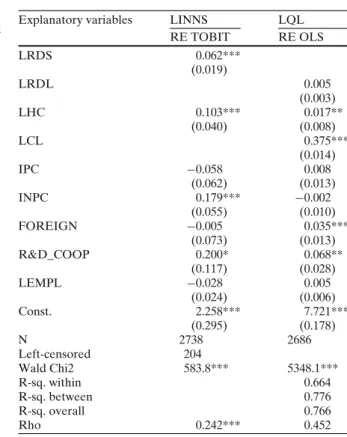
Table 3 R&D cooperation:
relationship to innovation and productivity
Controls: 27 2-digit industry dummies (reference industry: food, beverage, tobacco) and 2 year dummies. ***, **, * denote statistical significance at the 1%, 5% and 10% test level, respectively
Explanatory variables LINNS LQL RE TOBIT RE OLS LRDS 0.062*** (0.019) LRDL 0.005 (0.003) LHC 0.103*** 0.017** (0.040) (0.008) LCL 0.375*** (0.014) IPC −0.058 0.008 (0.062) (0.013) INPC 0.179*** −0.002 (0.055) (0.010) FOREIGN −0.005 0.035*** (0.073) (0.013) R&D_COOP 0.200* 0.068** (0.117) (0.028) LEMPL −0.028 0.005 (0.024) (0.006) Const. 2.258*** 7.721*** (0.295) (0.178) N 2738 2686 Left-censored 204 Wald Chi2 583.8*** 5348.1*** R-sq. within 0.664 R-sq. between 0.776 R-sq. overall 0.766 Rho 0.242*** 0.452
variable for R&D_COOP, while Table 5 contains the OLS random effect
estimates for the 7 original cooperation motive variables.9
8.2 Innovation equations
The estimates for the variables LRDS, LHC, IPC and INPC (dependent
variable: LINNS) in the innovation equations in Table3, column 1 and Table4
show similar effects as in earlier studies (see, e.g., Arvanitis2008). We obtained
positive coefficients for the tree types of factor endowment LRDS, LHQC and LCL as well as for the intensity of non-price competition (INPC).
We focus here on the findings referring to the overall cooperation variable and the seven cooperation motives. After taking into account the endogeneity of the variable R&D_COOP, we found a positive effect of the overall
coopera-tion propensity on the share of innovative products (column 2 in Table3). This
is a first important result that appears to justify the theoretical expectations
(see hypothesis 1 in Section2) as well as the positive expectations of most
9We refrain here from estimating first-difference equations for innovation and productivity as
well as using lags for right-hand variables because our panel is strongly unbalanced. For the same reason, we do not investigate persistence of cooperation as in Belderbos et al. (2004b).
Table 4 Innovation a nd cooperation motives; random effects T obit e stimates with instrument variables for the cooperation motive variables Explanatory variables LINNS LINNS LINNS LINNS LINNS LINNS LINNS LRDS 0.061*** 0.061** 0.061*** 0.061*** 0.061*** 0.061** 0.061*** (0.018) (0.017) (0.016) (0.016) (0.016) (0.017) (0.017) LHC 0 .101*** 0.103*** 0.107*** 0.108*** 0.096*** 0.109*** 0.089** (0.034) (0.033) (0.042) (0.037) (0.034) (0.039) (0.041) IPC − 0.080 − 0.146** − 0.055 − 0.035 − 0.056 − 0.046 − 0.048 (0.077) (0.071) (0.060) (0.070) (0.064) (0.069) (0.065) INPC 0.173*** 0.196*** 0.155*** 0.161*** 0.152*** 0.165*** 0.165*** (0.045) (0.056) (0.047) (0.055) (0.051) (0.050) (0.053) FOREIGN − 0.017 − 0.020 − 0.019 − 0.016 − 0.018 − 0.016 0.001 (0.068) (0.084) (0.077) (0.069) (0.068) (0.073) (0.078) MOT1 0.262*** (0.090) MOT2 0.318*** (0.104) MOT3 0.240*** (0.092) MOT4 0.216** (0.092) MOT5 0.264*** (0.094) MOT6 0.233** (0.104) MOT7 0.229*** (0.107)
Table 4 (continued) Explanatory variables LINNS LINNS LINNS LINNS LINNS LINNS LINNS LEMPL − 0.035 − 0.021 − 0.041 − 0.031 − 0.026 − 0.021 − 0.017 (0.020) (0.018) (0.025) (0.019) (0.016) (0.022) (0.017) Const. 2.771*** 2.683*** 2.521*** 2.352*** 2.469*** 2.416*** 2.657*** (0.388) (0.352) (0.350) (0.286) (0.270) (0.340) (0.403) N 2738 2738 2738 2738 2738 2738 2738 Left-censored 204 204 204 204 204 204 204 Wald Chi2 724.8*** 572.9*** 691.0*** 735.2*** 684.0*** 799.0*** 920.8*** Rho 0 .242*** 0.241*** 0.240*** 0.241*** 0.241*** 0.241*** 0.241*** See T able 9 for the endogeneity tests a nd the instruments used. C ontrols: 2 7 industry dummies (reference industry: food, beverage, tobacco) a nd 2 year dummies. ***, **, * d enote statistical significance at the 1 %, 5% and 10% test level, respectively. Rho: share o f variance that can be traced back to heterogenei ty. S tandard errors were estimated by bootstrapping
Table 5 Labour productivity and cooperation motives; random effects O LS estimates Explanatory variables LQL L QL LQL L QL LQL L QL LQL LRDL 0.007** 0.006** 0.006** 0.006** 0.006** 0.007** 0.007** (0.002) (0.002) (0.002) (0.002) (0.002) (0.002) (0.002) LHC 0 .026*** 0.026*** 0.026*** 0.025*** 0.026*** 0.026*** 0.027*** (0.005) (0.005) (0.005) (0.005) (0.005) (0.005) (0.005) LCL 0 .378*** 0.378*** 0.378*** 0.378*** 0.378*** 0.378*** 0.378*** (0.005) (0.005) (0.005) (0.005) (0.005) (0.005) (0.005) IPC 0 .015 0.014 0.015 0.016* 0.015 0.015 0.015 (0.009) (0.009) (0.009) (0.009) (0.009) (0.009) (0.009) INPC 0.001 0.001 − 0.000 0.000 0.000 0.001 0.001 (0.008) (0.008) (0.008) (0.008) (0.008) (0.008) (0.008) FOREIGN 0 .043*** 0.043*** 0.042*** 0.043*** 0.043*** 0.043*** 0.043*** (0.013) (0.012) (0.012) (0.012) (0.013) (0.013) (0.013) MOT1 0.016 (0.016) MOT2 0.026* (0.014) MOT3 0.037*** (0.011) MOT4 0.034*** (0.010) MOT5 0.014 (0.010) MOT6 0.008 (0.012) MOT7 0.012 (0.022)
Table 5 (continued) Explanatory variables LQL L QL LQL L QL LQL L QL LQL LEMPL 0.018*** 0.017*** 0.017*** 0.016*** 0.017*** 0.018** 0.018*** (0.003) (0.003) (0.003) (0.003) (0.003) (0.003) (0.003) Const. 7.530*** 7.531*** 7.542*** 7.542*** 7.532*** 7.530*** 7.529*** (0.061) (0.061) (0.061) (0.061) (0.061) (0.061) (0.061) N 2686 2686 2686 2686 2686 2686 2686 Wald Chi2 7861.2*** 7873.0*** 7892.9*** 7895.5*** 7864.0*** 7859.2** 7858.6*** R-sq. w ithin 0 .659 0.659 0.662 0.662 0.660 0.659 0.659 R-sq. b etween 0.776 0.777 0.776 0.777 0.776 0.776 0.776 R-sq. o verall 0 .766 0.766 0.766 0.766 0.766 0.766 0.766 Rho 0 .443 0.442 0.445 0.445 0.443 0.443 0.443 Control variables: 2 7 industry dummies (reference industry: food, beverage, tobacco) a nd 2 year dummies. ***, **, * d enote statistical significanc ea tt h e 1 % ,5 % and 10% test level, respectively. Rho: share o f variance that can be traced back to heterogeneity
policy makers, e.g., in the European Union, favouring R&D cooperation based on the argument that cooperation enhances innovation performance. Also the
results in Table4for MOT7 (utilization of public promotion grants) seem at
first glance to confirm policy expectations with respect to the effectiveness of the promotion of cooperation in R&D. But a second look shows that it is not clear what improves innovation performance: the public grant or the cooperation (which is a condition for the grant). At any rate, policy measures that make cooperation easier (for example, information platforms aiming at bringing together potential partners) could enhance innovativeness, even if they were not associated with R&D subsidies.
We obtained significantly positive effects for all seven motive categories. But there are differences as to the relative magnitude of these positive
effects.10MOT2 (saving of R&D costs), a primarily financial motive, appears
to have the strongest impact on innovation performance. Reduction of tech-nological risks (MOT1) and the utilization of techtech-nological complementarities (MOT5) seems also to enhance also innovation performance, less than MOT2 but more than the other four remaining motives. On the whole, no tendency for technological motives to be more effective than cost-oriented motives with respect to innovation performance is discernible, contrary to hypothesis 1a.
The relatively stronger innovation effects of the three motives MOT1,
MOT2 and MOT5 are in (partial) accordance with Ahuja (2000). This author’s
theoretical expectation has been that knowledge sharing, knowledge comple-mentarity and knowledge scaling would be the cooperation motives positively correlated with a high innovation performance of the cooperating firm (see Section 2.1.3). MOT1 and MOT2 could be considered as proxies for knowledge scaling, MOT5 as proxy for knowledge complementarity. MOT4 and MOT6 could be seen in this approach as proxies for knowledge sharing. Thus, the relevance for innovation of knowledge sharing as a third important driver of cooperation does not seem to be supported by our results. Nevertheless, the theoretical expectations for the first two motives have been—broadly speaking—confirmed by our results.
In sum, a second important result is that saving of R&D costs, reduction of technological risks as well as utilization of technological complementarities appear to be the motives that drive most strongly innovation performance. Saving costs is a standard economic motive, reduction of technological risks and utilization of complementarities are standard internalization motives in the sense of the transaction cost approach. Under the sensible assumption that the risk motive implies risks due to insufficient protection of proprietary knowledge that leaks out to competitors, this variable would cover also the
main motive identified by the IO approach.11
10All motive variables are binary variables, i.e. they are identically scaled, so that, for the
discussion of relative magnitude, it does not make a difference if we consider coefficients or marginal effects.
8.3 Productivity equations
The productivity estimates in Table3, column 2 and Table5show the expected
signs for the factor endowment variables LRDL, LHC and LCL (see Arvanitis
2008). Here we focus on the results for the cooperation motive variables.
We found a significantly positive effect for the overall cooperation variable as well as for three different motives: MOT2 (sharing of R&D costs); MOT2 (shortening of product development time); and MOT4 (access to specialized technology). Hypothesis 2 is confirmed: only three out of seven motives show positive and statistically significant coefficients.
Hypothesis 2a receives only partly confirmation: we obtain positive sig-nificant coefficients for only two out of four cost-oriented motives (MOT2 and MOT3) but just for one out of three knowledge-oriented motives (MOT4). No evidence could be found in favour of hypothesis 2b (in accordance to Sarkar
et al.2001): the coefficient of the variable MOT1 (reduction of technological
risks) is positive but statistically insignificant.
The direct effects on productivity come from cost saving and the shortening of the time needed to develop new products, essentially a further cost-saving motive, and the utilization of technological complementarities. We know already that the four other motives do not show a direct productivity effect, but have a positive impact on innovation performance. As a consequence, we can assume that there are also indirect effects of these four motives on produc-tivity that are channelled through innovation that itself enhances producproduc-tivity (positive effect of the variable for R&D expenditure per employee (LRDL) in
Table5).
9 Summary and conclusions
Concerning the impact of R&D cooperation (a) on innovativeness and (b) labour productivity, the most important results are as follows. Not only R&D cooperation in general but also cooperation driven by each of the seven motives considered in this paper correlate positively with the sales share of innovative products (hypothesis 1). Hypothesis 1a (R&D cooperation driven by primarily technology-oriented motives would be more innovative than those that are more cost-oriented) is not confirmed. Obviously differences
as to the pursued motives do not affect significantly innovativeness.12 With
respect to innovativeness, the characterization of cooperation by the driving motive did not add much more insight that could be gained through the overall variable ‘R&D cooperation yes/no’.
Finally, we found a positive impact of cooperation in general as well as for collaborations pursuing three motives, two of them financial, but not for the
12However, one has to take into account that the variables for the motives correlate strongly with
other four motives (partial confirmation of hypothesis 2). Hypothesis 2a (R&D cooperation driven by cost-oriented motives would be productive than those that are rather technology-oriented) is only partially confirmed. Technology-motivated collaborative activities show a weaker tendency to positive direct effects on productivity than cost-motivated cooperation. In this case, the distinction of several cooperation motives yields some additional insights as compared to the overall cooperation variable. Also hypothesis 2b (strong effect of the motive “reduction of technological risks”) is not confirmed.
A first implication for technology policy would be that policy goals that are more oriented towards innovation performance could be reached inde-pendent of the type of motivation of cooperating firms. On the contrary, if policy goals are more strongly oriented towards direct effects on economic performance, then policy effectiveness depends strongly on firms being driven rather by cost-sharing than technology-acquiring motives. One of the mo-tives considered in this study referred to the utilization of public grants for the promotion of R&D cooperation. Due to the fact that Swiss technology policy is based primarily on the promotion of R&D co-operation between private enterprises and universities, we can conclude that this specific type of promotion of cooperation should have been more effective in terms of innovativeness than in terms of economic performance as measured by labour productivity.
Acknowledgements The helpful comments and suggestions of three reviewers and the editor-in-chief of this journal are gratefully acknowledged. The study was financially supported by the Swiss National Science Foundation (SNF).
Appendix
Table6,7,8and9.
Table 6 Composition of sample by industry; firm size class; year
Number of firms Firms with R&D with R&D activities cooperation (%)
Industry:
Food, beverage, tobacco 181 26.0
Textiles 71 42.3 Clothing, leather 20 40.0 Wood processing 60 33.3 Paper 47 19.2 Printing 70 28.6 Chemicals 195 48.7 Plastics, rubber 99 27.3
Glass, stone, clay 65 30.8
Metal 38 36.8
Metal working 218 28.9
Machinery 448 36.8
Electrical machinery 124 38.7
Table 6 (continued)
Number of firms Firms with R&D with R&D activities cooperation (%)
Industry: Vehicles 33 39.4 Watches 78 25.6 Other manufacturing 78 24.4 Energy, water 26 46.2 Construction 114 26.3 Wholesale trade 123 26.8 Retail trade 52 17.3 Hotels, catering 43 14.0 Transport, telecommunication 80 27.5 Banks, insurance 128 43.8
Real estate, leasing 6 16.7
Computer services 83 34.9 Business services 159 39.0 Personal services 8 0.0 Firm size: 5–19 employees 473 31.1 20–49 employees 584 24.3 50–99 employees 535 27.9 100–199 employees 551 37.4 200–499 employees 491 41.8 500–999 employees 159 47.2
1000 employees and more 130 56.2
Year:
1999 879 38.7
2002 1070 27.4
2005 974 37.4
Total 2922 34.1
Table 7 Descriptive statistics Variable N Mean Std. dev.
MOT1 2922 0.061 0.240 MOT2 2922 0.093 0.290 MOT3 2922 0.150 0.357 MOT4 2922 0.198 0.398 MOT5 2922 0.208 0.406 MOT6 2922 0.136 0.343 MOT7 2922 0.035 0.183 R&D_COOP 2922 0.341 0.474 LINNS 2940 3.030 1.192 LQL 2901 11.898 0.449 IPC 2940 0.729 0.444 INPC 2940 0.437 0.496 FOREIGN 2907 0.166 0.372 LEMPL 2940 4.417 1.469 LRDS 2940 6.761 2.175 LRDL 2940 7.694 2.333 LHC 2940 2.689 1.012 LCL 2735 10.941 0.900
Table 8 Correlations MOT1 MOT2 MOT3 MOT4 MOT5 MOT6 MOT7 R&D_ LINNS LQL IPC INPC FORE LEMPL L RDS L RDL L HC COOP IGN L MOT1 1.000 MOT2 0.370 1.000 MOT3 0.399 0.387 1.000 MOT4 0.345 0.301 0.604 1.000 MOT5 0.285 0.394 0.535 0.678 1.000 MOT6 0.324 0.297 0.462 0.586 0.545 1.000 MOT7 0.194 0.280 0.167 0.276 0.268 0.304 1.000 R&D_COOP 0.361 0.443 0.594 0.703 0.721 0.558 0.266 1.000 LINNS 0.068 0.017 0.065 0.049 0.064 0.057 0.051 0.056 1.000 LQL 0 .045 0.075 0.108 0.107 0.083 0.068 0.020 0.102 − 0.032 1.000 IPC 0 .039 0.061 0.029 0.003 0.022 0.012 0.000 0.097 − 0.027 − 0.011 1.000 INPC 0.033 0.012 0.077 0.061 0.066 0.047 0.037 0.049 0.125 0.054 − 0.051 1.000 FOREIGN 0 .034 0.022 0.057 0.037 0.030 0.042 0.007 0.037 0.062 0.156 0.020 0.065 1000 LEMPL 0 .110 0.079 0.158 0.150 0.119 0.118 0.059 0.157 − 0.020 0.123 0.115 0.077 0.099 1000 LRDS 0.086 0.051 0.124 0.127 0.115 0.099 0.069 0.115 0.246 − 0.032 − 0.024 0.068 0.048 − 0.046 1000 LRDL 0.097 0.066 0.152 0.150 0.131 0.117 0.074 0,137 0.224 0.120 − 0.002 0.079 0.092 0.015 0.963 1000 LHC 0 .114 0.086 0.133 0.163 0.145 0.127 0.100 0.177 0.141 0.201 − 0.023 0.050 0.129 0.038 0.218 0.243 1000 LCL 0 .016 0.038 0.065 0.063 0.051 0.044 − 0.002 0.055 − 0.018 0.844 − 0.033 0.046 0.118 0.062 − 0.055 0.067 0.078
Table 9 Results of endogeneity tests (Rivers and Vuong1988)
Predicted variable LINNS LQL
Coeff. Instrument(s) Coeff. Instrument(s)
MOT1 signif. COPY; insignif. COPY; KCUST
KPATSCIENCE
MOT2 signif. COPY; IPC; insignif. COPY; IPC
KPATSCIENCE
MOT3 signif. KSUP; insignif. OBS_R&D;
KPATSCIENCE OBS_ENV
MOT4 signif. KSUP; insignif. OBS_R&D;
PATSCIENCE OBS_ENV;
OBS_ACCEPT; OBS_PROM
MOT5 signif. COPY; insignif. OBS_ACCEPT;
PATSCIENCE OBS_PROM
MOT6 signif. KPATSCIENCE insignif. OBS_R&D; OBS_ENV MOT7 signif. KPATSCIENCE insignif. OBS_R&D;
OBS_PROM R&D_COOP signif. KPATSCIENCE signif. KCUST
‘Coeff.’: coefficients of the residuals [predicted (instrumented) variables minus original variables] in the innovation equation and the productivity equation resp; ‘Instrument’: instruments used; signif./nn insignif.: test level 10%
References
Adams JD, Marcu M (2004) R&D sourcing, joint ventures and innovation: a multiple indicators approach. NBER working papers no. 10474, Cambridge, Mass
Ahuja G (2000) Collaboration, networks, structural holes, and innovation: a longitudinal study. Adm Sci Q 45:425–455
Arvanitis S (2008) Innovation and labour productivity in the Swiss manufacturing sector: an analysis based on firm panel data. In: van Beers C, Kleinknecht A, Ortt R, Verburg R (eds) Determinants of innovative behaviour: a firm’s internal practices and its external environment. Palgrave, London, pp 188–216
Arvanitis S, Bolli T (2012) A comparison of national and international innovation cooperation in five European countries. Rev Ind Org. doi:10.1007/s11151-012-9348-6
Aschhoff B, Schmidt T (2008) Empirical evidence on the success of R&D cooperation – happy together? Rev Ind Organ 33:41–62
Baum JAC, Calabrese T, Silverman BS (2000) Don’t go it alone: alliance network composition and startups’ performance in Canadian biotechnology. Strateg Manag J 21:267–294
Bayona C, Garcia-Marco T, Huerta E (2001) Firms’ motivations for cooperative R&D: an empir-ical analysis of Spanish firms. Res Policy 30:1289–1307
Belderbos R, Carree M, Diederen B, Lokshin B, Veugelers R (2004a) Heterogeneity in R&D cooperation strategies. Int J Ind Organ 22(8–9):1237–1263
Belderbos R, Carree M, Lokshin B (2004b) Cooperative R&D and firm performance. Res Policy 33:1477–1492
Belderbos R, Carree M, Lokshin B (2006) Complementarity in R&D cooperation strategies. Rev Ind Organ 28:401–426
Calogirou Y, Ioannides S, Vonortas NS (2003) Research joint ventures: a critical survey of the theoretical and empirical literature. J Econ Surv 17(4):51–570
Capron H, Cincera M (2004) Industry-university S&T transfer: what can we learn from Belgium CIS-2 Data? CEPR discussion paper series no. 4685, London
Cassiman B, Veugelers R (2006) In search of complementarity in innovation strategy: internal R&D and external knowledge acquisition. Manag Sci 52(1):68–82
Cincera M, Kempen L, van Pottelsberghe B, Veugelers R, Villegas Sanchez C (2003) Productivity growth, R&D and the role of international collaborative agreements: some evidence for Belgian manufacturing companies. Cah Écon Brux 46(3):107–140
Czarnitzki D, Ebersberger B, Fier A (2007) The relationship between R&D collaboration, sub-sidies and R&D performance: empirical evidence from Finland and Germany. J Appl Econ 22:1347–1366
Darby MR, Zucker LG, Wang A (2004) Universities, joint ventures and success in the Advanced Technology Program. Contemp Econ Policy 22(2):145–161
D’Aspremont C, Jacquemin A (1988) Co-operative and non-co-operative R&D in duopoly with spillovers. Am Econ Rev 78:1133–1137
De Bondt R (1996) Spillovers and innovative activities. Int J Ind Organ 15:1–28
Dodson M (1991) Technological learning, technology strategy and competitive pressures. Br J Manag 2(2):133–149
Hagedoorn J (1993) Understanding the rationale of strategic technology partnering: interorgani-zational modes of cooperation and sectoral differences. Strateg Manag J 14(5):371–385 Hagedoorn J, Link AN, Vonortas NS (2000) Research partnerships. Res Policy 29(4–5):567–586 Harrigan KR (1988) Joint ventures and competitive strategy. Strateg Manag J 9(2):141–158 Heckman JJ (1979) Sample selection bias as a specification error. Econometrica 47:153–161 Kaiser U (2002) An empirical test of models explaining research expenditures and research
cooperation: evidence from the German service sector. Int J Ind Organ 20:747–774
Kamien MI, Muller E, Zang I (1992) Research joint ventures and R&D cartels. Am Econ Rev 82:1293–1306
Kamien MI, Zang I (2000) Meet me halfway: research joint ventures and absorptive capacity. Int J Ind Organ 18:995–1012
Kemp RMG, Folkeringa M, de Jong JPJ, Wubben EFM (2003) Innovation and firm performance. Research report H200207, SCALES, Zoetermeer
Klomp L, van Leeuwen G (2001) Linking innovation and firm performance: a new approach. Int J Econ Bus 8(3):343–365
Kogut B (1988) Joint ventures: theoretical and empirical perspectives. Strateg Manag J 9:319–332 Link AN, Siegel DS (2003) Technological performance and economic performance. Routledge,
London
Lööf H, Heshmati A (2002) Knowledge capital and performance heterogeneity: a firm-level innovation study. Int J Prod Econ 76(1):61–85
Lopez A (2008) Determinants of R&D cooperation: evidence from Spanish manufacturing firms. Int J Ind Organ 26:113–136
Miotti L, Sachwald F (2003) Cooperative R&D: why and with whom? An integrated framework of analysis. Res Policy 32:1481–1499
Mohnen P, Hoareau C (2003) What type of enterprises forges close links with universities and government labs? Evidence from CIS-2 data. Manage Decis Econ 24(2–3):133–145
Okamuro H (2007) Determinants of successful R&D cooperation in Japanese small businesses: the impact of organizational and contractual characteristics. Res Policy 36:1529–1544 Penrose ET (1959) The theory of the growth of the firm. Oxford University Press, Oxford Porter ME (1990) The competitive advantage of nations. Free Press, New York
Powell WW, Koput KW, Smith-Doerr L (1996) Interorganizational Collaboration and the Locus of Innovation: networks of learning in biotechnology. Adm Sci Q 41:116–145
Pralahad CK, Hamel G (1990) The core competence of the corporation. Harvard Business Review May–June, pp 79–91
Rivers D, Vuong QH (1988) Limited information estimators and exogeneity tests for simultaneous probit models. J Econ 39:347–366
Sakakibara M (1997) Heterogeneity of firm capabilities and cooperative research and develop-ment: an empirical examination of motives. Strateg Manag J 18:143–164
Sarkar MB, Echambadi RAJ, Harrison JS (2001) Alliance entrepreneurship and firm market performance. Strateg Manag J 22:701–711
Schmidt T (2007) Motives for innovation cooperation – evidence from the Canadian survey of innovation. ZEW working paper no. 07-018, Mannheim
Simonen J, McCann P (2008) Innovation, R&D cooperation and labour recruitment: evidence from Finland. Small Bus Econ 31:181–194
Teece DJ (1982) Towards an economic theory of the multi-product firm. J Econ Behav Organ 3:39–63
Teece DJ (1992) Competition, cooperation and innovation: organizational arrangements for regimes of rapid technological progress. J Econ Behav Organ 18:1–25
Williamson OE (1975) Markets and hierarchies: analysis and antitrust implications. Free Press, New York
Woerter M (2011) Driving forces for research and development strategies – an empirical study based on firm-level panel data. Econ Innov New Technol 20:611–636