Compression Behavior of Smectitic vs. Illitic
Mudrocks
by
Chunwei Ge
Bachelor of Engineering, University of Minnesota - Twin Cites (2012) Master of Science, Massachusetts Institute of Technology (2016) Submitted to the Department of Civil and Environmental Engineering
in partial fulfillment of the requirements for the degree of
Doctor of Philosophy in the field of Geotechnical and Geoenvironmental Engineering
at the
MASSACHUSETTS INSTITUTE OF TECHNOLOGY February 2019
Massachusetts Institute of Technology 2019. All rights reserved.
Signature redacted
Author ....
...
Department of Civil and Environmental Engineering September 14, 2018
Certified by...
Signature redacted
II
Accepted
John T. Germaine Research Professor, Tufts University Thesis Supervisor II
Signature redacted
y . ...
Heidi Nepf Donald and Martha Harleman Professor of Civil and Environmental Engineering Chair, Graduate Program Committee MASSACHUSETS INSTrTUTE OF TECHNOOGY
FEB
28
2019
LIBRARIES
ARCHIVES
bCompression Behavior of Smectitic vs. Illitic Mudrocks
by
Chunwei Ge
Submitted to the Department of Civil and Environmental Engineering on September 14, 2018, in partial fulfillment of the
requirements for the degree of
Doctor of Philosophy in the field of Geotechnical and Geoenvironmental Engineering
Abstract
Overpressure or fluid pressure in excess of hydrostatic pressure has been observed globally in many deep water sedimentary basins. One of the possible mechanisms for overpressure is the smectite-to-illite (S-I) transformation. During the transformation, the basal spacing of the smectite layer reduces. The interlayer water is released into pore space, causing an increase in pore pressure.
This thesis investigates the compression and permeability behavior change due to S-I transformation. Uniaxial compression testing was performed on smectitic and illitic mudrocks. The original Gulf of Mexico - Eugene Island (GoM-EI) mudrock sets the baseline for smectitic mudrock in order to compare with illitic mudrocks. Two methods were used to create illitic mudrock from the GoM-EI sediment. The illitic mudrock A was cooked in a high temperature constant rate of strain (CRS) device with effective stress applied (200 'C and 30 days); the illitic mudrock B was cooked in a hydrothermal cooker in a slurry state (250 'C and 18 days). The multi-functional high temperature CRS device was designed from scratch to tackle the challenge of measuring the mechanical properties of a mudrock and transforming the clay minerals.
Although the methods of inducing S-I transformation are different, similar degrees of illitization for the illitic mudrock A and B was achieved by selecting the right temperature and time combination. The mineral transformation does not greatly alter the compressibility of the mudrocks. However, both the illitic mudrock A and B sit higher in porosity space than the smectitic mudrock at low stress level. As effective stress increases, the illitic mudrock A converges with the smectitic mudrock, while the illitic mudrock B reverses order with the smectitic mudrock at 30 MPa. The permeability of the smectitic mudrock ranges over five orders from 1016 to 10-20 m2
from a porosity of 0.58 to 0.23. The permeability of the mudrocks are greatly increased by the mineral transformation. The permeability ratio of the illitic mudrocks over the smectitic mudrock increases from 2 to 12 as porosity decreases.
The creep rate (C,) at room temperature and elevated temperature were measured during the transformation stage of the illitic mudrock A. C, at elevated temperature increases by 50 % compared with that at room temperature. The increase in rate is
caused by mineral transformation. Using the difference in rate, a model is proposed to estimate the effective stress reduction or overpressure generation based on the degree of mineral transformation.
Thesis Supervisor: John T. Germaine Title: Research Professor, Tufts University
Acknowledgments
There are a lot people I would like to thank.
I am extremely grateful to Dr.G. I appreciate the amount of time and energy he spent explaining thing in theory and fixing technical problem with me. The skills and knowledge learned from him and the entire research group will always be the valuable treasure for me. I would like to thank Professor Peter Flemings for teaching me the presentation skills and selling my research as a business pitch.
I would express my gratitude to Dr. Day-Stirrat from Shell for helping me an-alyzing mudrock samples and providing direction for how to conduct hydrothermal tests. Steve Rudolph for helping me with designing and fabricating the equipment.
I would like to gratefully acknowledge my other teachers of geotechnical engineer-ing; Professor Herbert H. Einstein, and Professor Andrew J. Whittle. They have taught me a great amount of knowledge about geologic and geotechnical stuff.
I am sincerely thankful for my friends: Amanda, Bing, Hao, Omar, Mark, and Deniz. This list can go on and on. nevertheless, I would like to express my gratitude to the people who I met, who had shared experience with me at MIT. I would carry all the happy memory and game on.
THIS PAGE INTENTIONALLY LEFT BLANK
Contents
1 Introduction
19
1.1 Problem Statement . . . . 19
1.2 Thesis Objectives and Scope . . . . 19
1.3 Organization of the Thesis . . . . 20
2 Background 23 2.1 Introduction . . . . 23
2.2 Overpressure in the Gulf of Mexico Block 330 . . . . 25
2.2.1 I/S Profile along A20-ST Well in the Gulf of Mexico Block 330 25 2.3 Stress Reduction due to Overpressure . . . . 27
2.4 Transformation Mechanism . . . . 27
2.4.1 Tim e Factor . . . . 28
2.5 Previous Experimental Study on Mineral Transformation . . . .. 30
2.6 Effects of Mineral Transformation on Compression and Permeability B ehavior . . . . 32
2.6.1 Mechanical Compression . . . . 32
2.6.2 Chemical Compression . . . . 33
2.6.3 Permeability Change Caused by Diagenesis . . . . 34
2.7 Texture and Fabric Study of Diagenetic Clay Minerals . . . . 35
2.8 Time Dependent Behavior- Creep or Secondary Consolidation . . . 37
2.8.1 The Time Effect . . . . 38
2.8.2 The Temperature Effect . . . . 38
2.8.3 The Stress Level Effect . . . . 39
7
2.8.4 Quasi-preconsolidation Effect . . . .3
3 Test Materials 63 3.1 Geological Setting . . . . 63
3.2 The mineralogy of the original GoM-EI source material . . . . 64
3.3 Leaching Process . . . . 67
3.4 Resedimentation Process . . . . 68
3.4.1 Mixing KCl Salt Solution . . . . 69
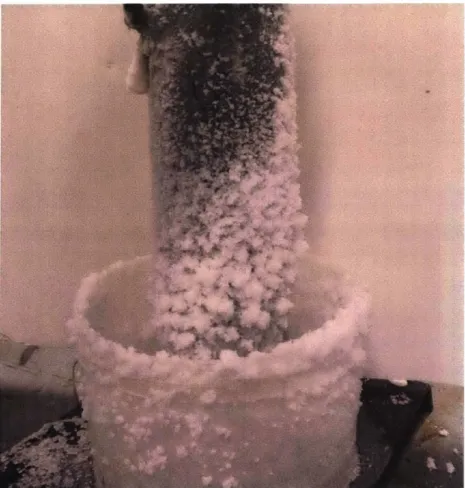
3.4.2 Salt Crystallization During Resedimentation . . . . 70
4 Methodology and Equipment
75
4.1 Methodology for Comparing Material Behavior Change due to Mineral Transform ation . . . . 764.2 Design Requirements for High Temperature CRS System . . . . 77
4.3 The High Temperature CRS Device . . . . 77
4.3.1 Temperature Control System . . . . 80
4.3.2 Load Frame and Hydraulic System . . . . 80
4.3.3 Control System and Data Acquisition System . . . . 81
4.3.4 Equipment Evaluation and Calibration . . . . 82
4.4 Hydrothermal Reactor . . . . 84
4.5 Equipment for Measuring SSA . . . . 84
5 Control Algorithm and Data Analysis for CRS Tests
93
5.1 Control Algorithm . . . . 945.2 Data Analysis . . . . 96
5.2.1 Constant Rate of Strain Method . . . . 96
5.2.2 Controlled Gradient Consolidation Method . . . . 96
5.3 Reduction Code for Analyzing the Data . . . . 97
5.4 Sym bol List . . . . 97
6 Results and Interpretation
105
6.1 The Smectitic Mudrock . . . . 1068
6.2 The K- saturated Smectitic Mudrock vs. the Na- saturated GoM-EI . 108
6.3 The Effect of Smectite-to-illite Transformation . . . . 109
6.3.1 Permeability Behavior Change . . . . 110
6.3.2 Compression Behavior Change . . . . 112
6.3.3 Mineral Composition . . . . 115
6.3.4 Specific Surface Area . . . . 117
6.3.5 Observation based on Fabric Analysis . . . . 118
6.4 Secondary Compression Evaluation . . . . 120
6.4.1 Secondary Compression of Protocol A . . . . 120
7 Overpressure Model
139
7.1 Introduction . . . . 1397.2 Components of Mudrock Transformation . . . . 139
7.3 Model Formulation . . . . 140
7.3.1 Free Draining System . . . . 140
7.3.2 Constant Volume System . . . . 142
7.3.3 Undrained System . . . . 143
7.4 Evaluation of Free Draining Case . . . . 144
7.4.1 Theoretical Released Bound Water . . . . 144
7.4.2 Analysis of Lab Test . . . . 145
7.5 Evaluation of Overpressure Cases . . . . 148
8 Conclusions and Recommendations
159
8.1 Key Observations and Developments . . . 159
8.2 Modeling the Impact of Illitization . . . 161
8.3 Recommendations for Future Work . . . 162
References
165
A KCl Salt Mixing Guide
169
B Reduction File
171
THIS PAGE INTENTIONALLY LEFT BLANK
List of Figures
2-1 Generalized Overpressure Profile in Sedimentary Basins . . . . 41
2-2 Generalized Illite Profile vs Temperature . . . . 41
2-3 Location of Origin GoM-EI Source Material . . . . 42
2-4 Profile View of Well A-20ST and Well A-12 . . . . 42
2-5 Pore Pressure Map of the Block 330 . . . . 43
2-6 Vertical Effective Stress Contour Map of Block 330 . . . . 44
2-7 Illite % in I/S Phase Increases as a Function of Depth in the Gulf of M exico. . . . . 44
2-8 Illite Ratio of Well A-20ST . . . . 45
2-9 Modelled Temperature History at the A Fault Depth of Well A-20ST 45 2-10 Stress Reduction Due to Overpressure . . . . 46
2-11 Two Modes of Bulk Density vs. Effective Stress . . . . 46
2-12 Solid State Transformation: Illite Growth by Layer Addition . . . . . 47
2-13 Dissolution and Precipitation Model of Smectite to Illite Transformation 48 2-14 Illite Ratio vs. Temperature. . . . . 49
2-15 Favored Reaction Conditions for Generating Illite . . . . 49
2-16 Test conditions for Comparing Chemical Compression and Mechanical Com pression. . . . . 50
2-17 Interlayer Water inside smectite . . . . 51
2-18 Compression Curves for Smectite, illite and kaolinite . . . . 51
2-19 Compression Curves for Smectite, kaolinite, and smectite kaolinite mix-ture ... .. ... ... 52
2-20 Porosity Reduction Rate vs. Vertical Effective Stress . . . . 53
2-21 Fitted Compression Curve Accounting for Different Temperatures at G ulf of M exico . . . . 2-22 Fibrous Illite in Sandstone . . . . 2-23 Three Basic Morphologies for Illite . . . . 2-24 The Clay Layers (N) in a McEwan Structure increase with I in I/S% 2-25 Preferred Orientation of Clay Particles . . . . 2-26 The Effect of Mineral Transformation on Preferred Orientation . . . 2-27 Void Ratio vs. Log Time for ID Incremental Loading Test . . . . 2-28 The Slopes of C, and C, in the compression Curve . .. . . . 2-29 C, increases with time . . . . 2-30 C, as a function of stress level . . . . 2-31 C, vs. Vertical Effective Stress . . . . 2-32 Secondary Compression Induced Quasi-preconsolidation Effect . . . . 3-1 The Bath Water Conductivity Reading during the Leaching Process of G oM -E I . . . .. . . . . 3-2 Comparison of Compression Behavior between Intact Lab Samples and Resedimentation GoM-EI Specimens and Field Logs . . . . 3-3 Basic Stages in Preparing Resedimentation Batch . . . . 3-4 Crystallization of KCl Salt with 3mol/L pore fluid during Resedimen-tation with Acrylic Tubes . . . . 3-5 Comparison of Salt Crystal Formation on PVC and Acrylic Tubes . . 4-1 4-2 4-3 4-4 4-5 4-6 4-7 4-8
Experimental Procedures for Comparative Tests . . . The High Temperature CRS Device Components . . Cross Section of the High Temperature Device . . . Schematic Diagram for Temperature Control System Load Frame for 100 MPa CRS Devices . . . . Thermal Set of the O-ring . . . . Net Load vs. Piston Displacement . . . . Apparatus Compressibility Curve . . . .
12 54
55
55 56 56 5758
58 5960
61 62 72 7273
74 74 . . . . 86 . . . . 86. . . .
87
. . . .
87
. . . . 88 . . . . 88 . . . . 89 . . . . 894-9 Cracked Porous Stone ... ... 90
4-10 Hydrothermal Reactor . . . . 90
4-11 Cross Section of Seal for Hydrothermal Reactor . . . . 91
4-12 Equipment for Measuring Total SSA . . . . 91
4-13 Aluminum Tares with Mixture of EGME and Clay . . . . 92
5-1 Combined Control Method Data from TCRS006 . . . . 99
5-2 Strain Rate Changes with Control Method . . . . 100
5-3 Flow Chart of Vertical Load Control Algorithm . . . . 101
5-4 Results from CRS Test using a Cycle of Constant Load to Reduce Pore Pressure ... ... 102
5-5 Permeability Result from CRS1370 by Fahy (2014) . . . . 103
6-1 Summary of Hydrothermal Reaction Result from Author's Master The-sis. . . . . 123
6-2 Strain Rate for Smectitic Mudrock . . . . 123
6-3 Compression Curve for the Smectitic Mudrock . . . . 124
6-4 Permeability Data for the Smectitic Mudrock. The permeability line displays good linearity in n - log(', space. . . . . 125
6-5 Compression Curve for the K-Smectitic Mudrock and Na-Smectitic Mudrock (Fahy, 2014). . . . . 126
6-6 Permeability curve for the K-Smectitic Mudrock and Na-Smectitic Mu-drock (Fahy, 2014). . . . . 127
6-7 Permeability Curve Comparison . . . . 127
6-8 Ratio of Permeability. rk is the ratio of permeability of the illitic mudrock B over permeability of the smectitic mudrock. . . . . 128
6-9 Permeabilities of smectite, illite and kaolinite clay minerals (adapted from Mesri and Olson 1971) . . . . 128
6-10 Coefficient of Consolidation Comparison . . . . 129
6-11 Compression Curve for Illitic Mudrock A . . . . 129
6-12 Strain Energy Method to Determine the Preconsolidation Stress for
Illitic Mudrock A. The u' is determined to be 16 MPa. . . . . 130
6-13 Compression Curve Comparison for the Smectitic Mudrock and Illitic M udrocks. . . . . 130
6-14 Compression Curve Comparison for the Smectitic Mudrock and Illitic Mudrocks from 10 to 100 MPa. . . . . 131
6-15 Compressibility Comparison for the Smectitic Mudrock and Illitic Mu-drocks... ... 131
6-16 Compressibility Comparison Zoom In . . . . 132
6-17 Compressibility in Stress Space . . . . 132
6-18 Compressibility in Stress Space Zoom In . . . ... 133
6-19 Mineral Composition of the three Mudrocks . . . . 133
6-20 SEM Images for the Smectitic Mudrock and Illitic Mudrock B at around 90 MPa and a Porosity of 0.21. The magnification is 100kx. . . . . . 134
6-21 Illustration for the Smectite-to-illite Transformation (after Bowers 2011) ... 135
6-22 SEM Images for the Illitic Mudrock A and B. . . . . 136
6-23 Void Ratio Drop at Stage 2 & 3 due to Creep and Mineral Transformation. 137 6-24 Creep at Room Temperature. The zero time is from the time when excess pore pressure measured at the base of the high temperature CRS cell is zero. . . . . 137
6-25 Creep at Elevated Temperature. The zero time is from the time when the temperature of the high temperature CRS device starts to increase. 138 6-26 C, Value in This Study vs. Data from Karig et al. (2003) . . . . 138
7-1 General Model of Overpressure . . . . 151
7-2 The Compression Behavior of a mudrock going through S-I transition for a Free Draining System . . . . 152
7-3 The Proposed Overpressure Model for an Undrained System . . . . . 152
7-4 Explanation for Volume Expansion Due to bound Water Release . . . 153
7-5 The D-spacing Change of the Smectite . . . . 154 7-6 Procedures for Calculating Void Ratios for Blue Dot and Red Dot . . 154 7-7 Schematics for Void Ratio Calculation . . . . 155 7-8 Overpressure Model: Porosity vs. Stress . . . . 155 7-9 Porosity vs. Overpressure Ratio with Different Degree of Illitization . 156 7-10 Overpressure Ratio vs. Rp with Different Degree of Illitization when
n = 0.388. . . . 156
7-11 Overpressure Ratio vs. C,, to Cc, Ratio with Different Degree of
Illitization at 5 MPa effective stress . . . . 157
THIS PAGE INTENTIONALLY LEFT BLANK
List of Tables
2.1 2.2
Kinetic Model of Mineral Reaction . . . . Porosity Reduction in Test 7 and Test 8 . . . . .
3.1 Bulk Composition of Original GoM-EI . . . . 3.2 Mineral Composition of Clay Fraction (< 2prm) of
4.1 Tensile Strength of Different Stainless Steel . . . . 4.2 Properties of Different 0-rings . . . .
Original
Reaction Conditions for Illitic Mudrocks . . Summary of Smectitic vs. Illitic Tests . . . . Mineral Composition for the Clay Fraction . SSA of GoM-EI with different Cations (Unit: Summary of Total SSA . . . .
. . . . 110 . . . . 115 . . . . 116 m2/g) ... 118 . . . . 118 7.1 Summary Table . . . .
A.1 KCl Potatssium Chloride Solution Mixing Guide . . .
147 169 17 GoM-EI 29 32 65 66 79 79 6.1 6.2 6.3 6.4 6.5
THIS PAGE INTENTIONALLY LEFT BLANK
Chapter 1
Introduction
1.1
Problem Statement
In early 1960s, researcher found that the percentage of illite increases with depth in Gulf of Mexico basin due to smectite-to-illite (S-I) transformation. The ratio of illite to smectite is indicative of temperature and pressure condition in the basin. This ratio is used for oil reservoir characterization and overpressure prediction. During the transformation, the basal spacing of the smectite layer reduces. The interlayer water is released into pore space, causing an increase in pore pressure. Although there have been numerous studies on the mineralogical aspect of sinectite-to-illite transformation, the mechanical effects of the clay transition are not fully understood. The goal of my research is to study the permeability, compressibility change due to mineral transformation, as well as to propose a model to estimate the overpressure generation based on the degree of mineral transformation.
1.2
Thesis Objectives and Scope
This thesis is the phase two of my research. Phase one study investigates the reaction conditions for smectite-to-illite transformation such as temperature, time and KCl concentration (Ge, 2016). Phase one study provides valuable knowledge of the kinetics of the reaction. Difference combinations of temperature and time were tested on the
Gulf of Mexico-Eugene Island (GoM-EI) mudrock using hydrothermal cooker. Phase one study also develops solid analytic method to characterize mineral composition for transformed GoM-EI material using x-ray diffraction (XRD).
Phase two study presented in this thesis has three main objectives.
The first objective is to develop a multi-functional high temperature CRS device to measure the mechanical properties of a mudrock up to 100 MPa and to trans-form the clay minerals with effective stress. The second objective of the research is to compare the compressibility and permeability change of a mudrock due to the mineral transformation. The third objective is to develop a model to estimate the effective stress reduction or overpressure generation based on the degree of mineral transformation.
This research is part of the UT Geofluids Consortium, a collaboration between Tufts University (formerly MIT) and UT Austin. This consortium provides a wide breadth of data on different mudrocks all around the world, with the focus on "evolu-tion of pressure, stress, deforma"evolu-tion and fluid migra"evolu-tion through experiment, models and field study".
1.3
Organization of the Thesis
This thesis is organized into seven chapters and numerous appendices. The main chapters provide reader with entire investigation process from background, literature review to equipment design, data analysis process, and finally summary of result and interpretation. The appendices provide more detailed laboratory procedures, data sheets, and computer codes.
Chapter 2 provides a background summary of the smectite-to-illite transformation mechanism in the natural environment and the theoretical explanation for how this reaction causes overpressure. This chapter studies Gulf of Mexico Block 330 as an example for the overpressured basin. Extensive investigation into the literature is performed to validate the novelty of this research. Detail summary of effects of mineral transformation on compression and permeability behavior is given, followed
by a concise review of creep behavior of the mudrock.
Chapter 3 provides the geological information of the material used for the research as well as information about the material processing. Information about the geological setting, in situ temperature, mineralogy, pore pressure and vertical effective stress are recorded. This chapter also covers the leaching process, salt mixing procedures and resedimentation process.
Chapter 4 describes the method and equipment used in the research to measure the mudrock behavior change. Two different methods are used to induce the illitization. A detail description of control system for automating the tests is given. The method and equipment used for measuring the specific surface area is also provided.
Chapter 5 presents a solution for controlling the excess pore pressure when coni-pressing a high plasticity specimen in a uniaxial compression test. The control algo-rithm switches from constant rate strain in stage I to constant pore pressure in stage II when pore pressure reaches certain value. This chapter also presents corresponding equations and theories for analyzing data collected in stage I and stage II.
Chapter 6 summarizes the experimental results. A comparison on the compression behavior, compressiblity and permeability between the smectitic mudrock and the illtic mudrocks are discussed. The creep rate in room temperature and elevated temperature is shown. The difference in open system and closed system for the stress reduction model is presented. Clay fabric analysis is done using the SEM images of the smectitic mudrock and the illitic mudrocks.
Chapter 7 is a summary of main results of this research. Recommendations for future work are provided as well.
21
THIS PAGE INTENTIONALLY LEFT BLANK
Chapter 2
Background
Nomenclature
This background section contains considerable amount of terminologies in the clay
mineralogy and geology which is unfamiliar to most Civil Engineers. Readers should
refer to Moore and Reynolds (1989) and Chapter 3 in Ge (2016). The specific
defi-nitions needs to be well-acquainted are: smectite, illite, mix-layered mineral, I/S and
Reichweite ordering, fundamental particles, and MacEwan crystallite and
fundamen-tal particles. Geologists prefer terminologies like compaction and creep, whereas civil
engineers more frequently use compression and secondary compression.
2.1
Introduction
Overpressure or fluid pressure in excess of hydrostatic pressure has been observed
globally in different sedimentary basins. Tectonic stress, rapid deposition of low
permeability sediments and clay mineral diagenesis are recognized as potential
con-tributors to overpressure generation. In the petroleum industry, knowledge of the
distribution of overpressure is critical in geophysical interpretation and deep borehole
design. Figure 2-la summarizes three examples of the overpressured profile (Nadeau,
2005)(P. Nadeau, 2005). The Basin A pore pressure profile is similar to that of the
Gulf of Mexico, where the overpressure ramps at the shallowest depth starting at 2
km. Basin C is similar to Norwegian continental shelf, the overpressure kicks in at a
23
deeper stratum around 5 km. Although the pressure ramps start at different depths, they share the same temperature vs. pore pressure relation (Figure 2-1b). Pore pres-sure follows the hydrostatic line at low temperature, starts to ramp up from 80 'C to 120 0C, and almost reaches the lithostatic line when temperature is greater than 120
*C.
Nadeau (2005) observed the connection between the smectite-to-illite transforma-tion and overpressure generatransforma-tion. The illitizatransforma-tion vs. temperature relatransforma-tionship (Fig-ure 2-2) coincides with the pore press(Fig-ure vs. temperat(Fig-ure relationship. The illite%
(I%) in the mixed-layer mineral (I/S) starts to increase from 60-80 *C, slowly ramps
up from 80 0C to 120 *C, and increases at a sharp slope to unity when temperature is greater than 120 *C.
Studies by Lahann (2002) and Bowers also emphasize the connection between clay mineral diagenesis and overpressure. Bowers (2011) believes that density of interlayer water is denser than the pore water , when the interlayer water is released to pore space during the smectite-to-illite transformation, the volume of interlayer water expands. In a closed system or low permeability condition, the pore pressure will increase dramatically due to clay mineral diagenesis.
Studies by Osborne and Swarbrick (2001) and Hart et al. (1995) investigated the relationship between compaction disequilibrium and overpressure. If the sedi-mentation rate is slow, normal compaction occurs; this normal compaction generates hydrostatic pore pressure in the formation. If the sediments are unable to expel or partially expel their pore fluids in response to a rapid sedimentation rate or due to low permeability, compaction disequilibrium occurs. The remained fluid in the pores of the sediments must support all or part of the overburden, causing pore pressure to increase. It is observed in Gulf of Mexico that sediment's permeability is low enough to significantly cause overpressure.
Both mechanisms, mineral transformation and compaction disequilibrium, are the major contributor to the overpressure generation, but there is no actual measured data to confirm the theory, this motives the current research to study the relationship between overpressure generation and smectite-to-illite transformation.
2.2
Overpressure in the Gulf of Mexico Block 330
Block 330 in the Gulf of Mexico provides a perfect case study for researchers to study
an overpressurized basin. It is located off the coast of Louisiana shown in Figure 2-3.
The geological environment in Block 330 was well studied and documented by Losh
et al. (1999) and Hart et al. (1995). It was a major scientific endeavor to study and
understand the geologic, chemical, and thermal conditions of a major growth fault
(also termed the A fault in Figure 2-3 and Figure 2-4). The source material for this
research is cored from well A-20ST and A-12. The properties of the source material
are discussed in Chapter 3.
Losh et al. (1999) mapped the pore pressure for the cross section of Block 330
shown in Figure 2-5. Pore pressure profile is generated using fluid pressure
measure-ments in the sand layers from over 30 borings. He observed that the entire basin is
severely overpressured. In the upthrown side, the upper 1.5 km are hydrostatically
pressured, followed by a moderately overpressured transition zone from 1.5 km to 2
km, and then severe overpressures, equaling up to 95% of the total lithostatic
pres-sure occurring below 2 km. The pore prespres-sure profiles differ significantly across the
fault. The overpressure is much lower on the downthrown side than the upthrown
side. In the downthrown side, the offset between the pore pressure measurement and
hydrostatic line is about 2 MPa.
Figure 2-6 shows the vertical effective stress contour map. The effective stress is
also generated based on the pore pressure map of the cross section. The upthrown
side has significant reduction in vertical effective stress due to overpressure. Along
the A fault, the effective stress can be as low as 1.1 MPa. The position of A20-ST
well is illustrated in Figure 2-6.
2.2.1
I/S Profile along A20-ST Well in the Gulf of Mexico
Block 330
Observed by numerous researchers, the illite percentage (1%) in the I/S increases with
depth in sedimentary environment (Perry and Hower, 1970; Bethke and Altaner 1986,
25
Hower et al., 1976). Lahann et al.'s (2002) and Hower et al.'s (1976) data show very
similar trend. Mineral transformation profile in Figure 2-7 is a typical clay diagenesis
profile for the Gulf of Mexico Basin. From 1300 to 7600 ft, 1% in I/S is below 50%;
from 7600 to 11400 ft, the ratio increases to 68%; in the deeper section, the ratio
increases and stops at 80
%.
In the Gulf of Mexico, the depletion of potassium source
is the major reason that prevents the ratio from approaching unity.
Following the discussion of overpressure in the Gulf of Mexico Block 330, the
illitization profile in the well A20-ST (Figure 2-4) provides valuable data for
under-standing the mineral transformation process. Losh et al. (1999) found that the ratio
is unusually high for Pliocene-Pleistocene sediments at 2.3 km burial depth. Similar
high ratio is observed at shallower depth and lower temperature in A-20ST. I/(I+S)
%,
total layers of illite over the sum of total layers of smectite and illite ratio, increases
with depth (Figure 2-8). The I/(I+S)% is calculated by
Sillite%
+ (Iin I/S) x I/S%
illite% + I/S% + smectite%
If using Nadeau's (2005) generalized illite profile vs. temperature relation (Figure
2-2), with a in-situ temperature of 70 'C, there should be only negligible illite in the
well. The measured I/(I+S) % is around 50 % at the fault depth. The reason for
high illite content is not totally understood. There are two factors contributing to
the illitilization: 1. high potassium content in the brine; 2. thermal pulse at a higher
temperature than the ambient temperature in the present day.
Losh et al. (1999) claimed that K+ exchange for Na+ in smectite during early
diagenesis leads to a potassium-enriched smectite. This K+-smectite may transform
to illite at a lower temperature. In addition, he also conducted thermal history
modeling of the fault zone using information obtained from studying organic matter
maturity. He found that the in situ temperature in the fault zone is around 70 *C, and
an abnormal thermal pulse or thermal flow at 125 *C occurred for a period of 2500
years (Figure 2-9). The elevated temperature is believed to be the cause of higher
degree of illitization.
2.3
Stress Reduction due to Overpressure
Lahann et al. (2002) studied an overpressurized well B in the Gulf of Mexico to
investigate the effect of mineral transformation and compaction disequilibrium on
overpressure generation . The illite profile vs. depth is shown in Figure 2-7.
Lahann et al. (2002) generated the crossplot of density vs. effective stress for the
same well (Figure 2-10). The bulk density of shale is estimated from density logs, and
effective stress from sonic logs. Under normal pressure conditions (no overpressure,
<3600 ft
),
the effective stress increases monotonically with depth, and the sediments
continually consolidate, the bulk density continually increases to a depth of 7600ft
(the blue dots). Slight overpressure pore fluid is trapped by the low permeability of
mudrock in the initial stage of illitization (the pink dots, 7600
-
11400 ft). Under
the condition of compaction disequilibrium (7600
-
11400 ft), and when I in I/S is
below 45%, the sediments continue to load with illitization; When I in I/S is greater
than 45%, the sediments starts to unload with increasing degree of illitization, the
density keeps constant with reduction of effective stress. Lahann et al. (2002) argued
that with combination of undercompaction (low permeability) and higher degree of
illitization that the shale starts to unload.
Lahann et al. (2002) further explained that there are two bulk density and stress
relationships derived from illitic mudstone (Figure 2-11). In a closed system, the
permeability of deep sediments are so low that the fluid is not able to drain, then the
pore pressure builds up. The effective stress reduces dramatically while the density
remains constant (isovolume). While in a open system, where fluid is able to drain, the
density would increase at constant stress, which behaves similar to material undergoes
secondary compression (isostress).
2.4
Transformation Mechanism
This section discusses the origin and creation of illite in a diagenetic environment.
The knowledge of detrital illite is covered by Betard et al. (2009) and Meunier &
Velde (2013) in great detail.
The smectite-to-illite reaction pathway follows three stages in a shallow burial diagenesis environment like Gulf of Mexico. The transformation starts when the tem-perature is around 60-80 *C and reacts up to 120-140 'C. The first stage is a highly smectitic clay represented by randomly ordered I/S phase (RO). With increasing re-action, randomly ordered I/S are transformed into regularly interstratified structures (R>1). The third stage is that the ordered I/S reacts to a final discrete illite.
In a micro scale, two models for illitization are particularly important: 1. layer by layer transformation or solid state transformation (Hower et al., 1976); 2. neofor-mation mechanism (Nadeau et al., 1985; Boles & Franks, 1979) .
Layer-by-layer transformation is the remodeling of a smectite 2:1 structure. The fixation of K+ in the interlayer space leads to a non-reversible collapse of d-spacing from 15
A
(2 water layers smectite) to 10A
(illite). As illitization progresses, the number of fundamental particles (N) increases with addition of illite or smectite layers. Figure 2-12 illustrates the process in which additional layers attach to a McEwan structure. (Boles & Franks, 1979). This solid state transformation theory was supported by Ferrage et al.(2011)'s study using X-ray Diffraction (XRD) method. In Figure 2-13, Nadeau et al. (1985) further explains the origin of the additional illite layers. These layers are a result of dissolution-precipitation reactions under the condition of high K+ concentration in the pore fluid. Firstly, smectite dissolves in the pore fluid, thin illite precipitates and adds to I/S lattice creating a larger crystal. With increasing degree of transformation, thin illite also dissolves in solution and precipitates as larger illite crystallites.2.4.1
Time Factor
Boles and Franks (1979), Ferrage et al. (2011), Pytte and Reynolds (1989) and Ge (2016) have discovered that the smectite-to-illite transformation is temperature driven rather than depth or stress driven. The reaction rate increases with temperature. With ample supply of potassium, the reaction progresses much faster.
In addition to temperature and potassium concentration in the pore fluid, time is
another important element in the reaction.
One way to determine the age of illite is by the K-Ar dating method (Pevear, 1992). The K+ cation, which is fixed in the interlayer space during transformation, is used to determine the age of illite. To get an accurate measurement of the diagenetic age, researchers need to differentiate source of the illite. In a sedimentary basin, illite are mostly formed diagenetically in a low temperature environment (< 150 *C), but illite derived from the host rocks as a weathering product are formed in a much higher temperature. The neoformed I/S or neoformed illite records the thermal history of a sediment, but detrital illite age does not reflect the age of the sedimentary basin.
A more robust way to estimate the age is to study the kinetic model. Huang (1993) and Pytte and Reynolds (1989) used equation 2.2 to study the diagenetic age.
-dS -E_
d = A - exp( " )[K+] S2 (2.2)
dt RT
where S is the smectite percentage in the I/S, t is time,A is the frequency factor, Ea is the activation energy, R is the gas constant, T is the temperature and [K+] is the potassium concentration.
In table 2.1, for three carefully studied shales in the Gulf of Mexico (Pytte and Reynolds, 1989), the time required to reach 80 % illite in I/S varies from 300 million years to 1 million years depending on the temperature. The K+ concentration used is the average oil field brine, about 100-200 ppm or 0.1-0.2 g/L.
To summarize, in its natural condition, the reaction rate of a diagenetic illite is extremely slow.
Table 2.1: Kinetic Model of Mineral Reaction
Input Output
I % in I/S Temp. *C K+(ppm) Time (my)
80
70
100-200
300
80
100
100-200
10
80 127 100-200 1
2.5
Previous Experimental Study on Mineral
Trans-formation
In order to have better understanding of the smectite-to-illite transformation,
numer-ous researchers conducted hydrothermal tests to reproduce the reaction in a
labora-tory environment (Huang et al., 1993; Ferrage et al., 2011; Eberl, 1980; Montoya &
Hemley, 1975).
Hydrothermal reactions were conducted in high temperature and high potassium
concentration to accelerate the transformation, so that the reaction could be
com-pleted in a reasonable time scale, due to the fact that diagenetic illite takes millions
of years to form in low temperature and low potassium concentration environment.
Ferrage et al. (2011) elevated the temperature range to 200-400
0C.Figure 2-14
summarizes data from Ferrage et al. (2011) and Ge (2016) for different combinations
of time and temperature. Data from Ge (2016) are in the upper left box. Data from
Ferrage et al. (2011) are in the lower right box. The source material for Ge is the
Gulf of Mexico-Eugene (GoM-EI) mudrock, which has a I/(I+S)% ratio of 42 %. The
source material for Ferrage is pure smectite. In the most extreme case, 400 *C and
120 days, for a pure smectite starting material, the I/(I+S)% ratio increases to 82 %.
The I/(I+S)% of GoM-EI increases by 50% in 18 days at 300 *C, while pure smectite
only gained 32% in 30 days at the same temperature. The I/S phase in the GoM-EI
provides a template for illite to grow and catalyze the reaction.
Montoya and Hemley (1975) studied the formation of illite from a different
per-spective. They investigated the thermal stability of illite within a system whose
starting material is composed of K-feldspar, mica and silica. A phase diagram is
gen-erated using the data from thermal stability tests for K20-A1202-SiO2-H20 system
(Figure 2-15). Illite forms under the conditions of high temperature and K+
con-centration. However, the cooking temperature should not be over 600 'C, otherwise
the system is not favorable to form illite, but rather forms other type of minerals or
simply bakes pottery.
The hydrothermal tests have not considered the effect of interparticle stress in the
progress of mineral transformation. These hydrothermally altered clay minerals are
cooked in a slurry state with no effective stress, but mudrocks that undergo diagenetic
reaction in the sedimentary basin are under vertical effective stress. To study the
mineral transformation of a mudrock sample under more realistic condition, Duffy
(2012) cooked the cored sample from North Sea Basin in a triaxial cell to simulated
the in-situ stress field and temperature.
Duffy (2011)'s test procedures involved three stages: 1. consolidate the intact
sample to a target vertical effective stress of 30 MPa; 2. keep the vertical effective
stress constant for 300 hours. 3. increase vertical effective stress to 50 MPa and hold
stress for another 300 hours. Figure 2-16 displays the axial pressure, radial pressure,
p ore pressure and temperature for a heated test (test 7) and a room temperature
test (test 8). The samples for test 7 and test 8 are hydrostatically consolidated in
identical procedures except for the test temperature and pore fluid chemistry. Test
7
is heated to 150 'C while test 8 is conducted at 25 *C. The pore fluid chemistry is 3
mol/L KCl solution for test 7, and 3 mol/L NaCl solution for test 8.
Duffy compared the porosity reduction at the hold stress stage between test
7
at high temperature and test 8 with no heating (Table 2.2). At 30 MPa vertical
effective stress (stage 2), the porosity reduction for a duration of 300 hours increased
from 9% (test 8) to 19% (test 7). Then she increased the stress level to 50 MPa
vertical effective stress (stage 3). The porosity reduction increases from 17% (test 8)
to 27% (test 7). The porosity reduction increase is caused by combination effect of
temperature effect and K+-exchange. From XRD analysis, the heated sample of test
7 shows no sign of illitization but only cation exchange. This suggests the reaction
rate at 150 'C is not fast enough to see mineral change in 25 days, but a higher
reaction temperature challenges the performance of sealing material in the triaxial
cell. In short summary, her tests failed to induce diagenetic reaction, but confirmed
that at higher temperature, the creep rate increases; porosity of the hotter mudrock
is of lower value.
Duffy expressed the difficulty of conducting mineral transformation tests with
ef-fective stress at higher temperature. Fitts and Brown's (1999) experimental design
Table 2.2: Porosity Reduction in Test 7 and Test 8 Porosity Reduction, % Temperature, *C Pore Fluid at 30 Mpa at 50MPa
Test
7
150
3M KCl
19
27
Test 8 25
3M NaCl
9
17
avoided this challenge by studying the relationship between dehydration of smectite and overpressure generation. Using a modified 1D consolidometer, they found dehy-dration starts at 1.3 MPa effective stress and the three-water-layer smectite releases one interlayer water as effective stress increases (Figure 2-17). Smectite can take in water as zero, single, double or triple layers of water. Single, double, triple layers correspond to a d-spacing of around 12.5k, 15.4A, and 18.5A respectively for sodium saturated smectite. According to Colten-Bradley (1987), three-water-layer smectite only exists at shallow depth. As depth increases, three-water-layer smectite becomes two-water-layer smectite, and is stable between 50 to 75 *C depth zone.
2.6
Effects of Mineral Transformation on
Compres-sion and Permeability Behavior
Compaction (geology term) or compression (geotechnical term) is both a function of stress, temperature and time.
Mechanical compression is a function of effective stress. The void ratio or porosity of a sediment reduces with increasing effective stress or depth of burial. Mechanical compression is dominant over chemical compression with in the low temperature zone
(< 80-100 *C). At higher temperatures, chemical compression becomes dominant (Goulty et al., 2016).
2.6.1
Mechanical Compression
Mechanical and chemical compression occur simultaneously in a diagenetic basin. It is difficult to investigate chemical compression in the laboratory due to the low kinetics.
32
-Meade (1966, 1963) conducted 1D compression tests on reactant minerals -smectite
and product mineral-illite individually to see the change in compression behavior
due to mineral transformation. .
Meade(1966) found at any given effective stress, the porosity of smectite
(mont-morillonite in the figure), illite and kaolinite are in descending order (Figure 2-18).
Mondol et al. (2007) conducted uniaxial compression tests on a mixture of smectite
and kaolinite clay minerals. Figure 2-19 shows the same trend that pure smectite has
the highest porosity, pure kaolinite the lowest. Meade's also calculated the
compress-ibility, the relationship of three minerals over a stress level from 0.01 to 100 MPa are:
smectite
>
illite
>
kaolinite, at all stress range.
However, Mondol et al. (2007)'s result does not totally agree with Meade (1966)'s.
Mondal et al. (2007) used kaolinite instead of illite, because illite is the intermediate
mineral in terms of compression behavior change, kaolinite provides more drastic
differences in compressibility. He argues that the compressibility hierarchy of smectite
and kaolinite has three stages. Only at low stress level (<1 MPa) and transition stage
(< 5 MPa) is Meade's statement valid. At higher stress level, the pure smectite is less
compressible than pure kaolinite. In Figure 2-20 stage 1 and 2, the porosity reduction
rate of 100% smectite is higher than 100% kaolinite. In stage 3 the higher stress level,
the order reverses.
2.6.2
Chemical Compression
Chemical compression includes mineral transformation, clay mineral dissolution and
precipitation, quartz dissolution and precipitation, and framework weakening due to
temperature increase. In general, deeper, hotter mudrocks are more compressed at a
given effective stress due to chemical compression.
Pinkston (2017) summarized the measured porosity, temperature, and vertical
effective stress in Maconda well, Rigel well and well 562-1 in the Gulf of Mexico (Figure
2-21). In his fitted model, porosity reduces consistently with increasing temperature.
He thinks that the porosity loss is mostly caused by expulsion of interlayer water
during the illitization.
Smectite to illite transformation is often accompanied by quartz dissolution and cementation. In a sandstone reservoir or a shale reservoir filled with silica saturated pore fluid, Equation 2.3, 2.4, and 2.5 describe the diagenetic reactions with quartz dissolution and precipitation (Bjorlykke 1993).
K -
feldspar
+ H+ = Kaoliuite + K+ (2.3)K - feldspar + Kaolinite = illite + quartz (2.4)
smectite + K - feldspar = illite + silica (2.5)
Both pressure dissolution of quartz and clay mineral reactions lead to porosity reduction. With growth of quartz in the pore space, clay particles are cemented together with stronger shear resistance. In a macro scale, the stiffness of the material increases.
Framework weakening is caused by loss of shear strength between grain, or dis-solution of load-bearing grains when temperature increases (Lahann and Swarbrick, 2011). Framework weakening due to shear strength reduction is discussed in Sec-tion 2.8. It explains why framework weakening due to temperature leads to porosity reduction and decrease in compressibility when the mudrock is further consolidated past yield point (quasi-preconsolidation effect).
2.6.3
Permeability Change Caused by Diagenesis
Section 2.4 describes the process of smectite to illite transformation. As a result of layer addition in the 001 direction and lattice growth in the x-y plane due to dissolution-precipitation, the volume of illite increases. When the volume of a clay mineral increases, its specific surface area reduces. According to Kozeny-Carman equation 2.6 (Carman, 1956), permeability (k) is a function of porosity (n), tortu-osity (r) and total specific surface area (TSSA) (Sa), G, is the specific gravity. If
considering TSSA along and keeping the other variables constant, shale that goes
through the transformation would have a greater permeability, because the specific
surface area of neoformed illite is smaller than that of smectite. The TSSA will
fur-ther reduces as the neoformed illite grows to well crystallized illite. However, in most
observed sedimentary basin in the Gulf of Mexico where smectite-to-illite
transfor-mation is prevail, the shale permeability decreases.
n
3k
=r
2(l
n
(2.6)
r2i )2G2 Sa
Nadeau
(2005)
and Bjolykke (1998) discovered that illite can occurs as a fibrous
pore-filling mineral, in the sandstone or shale under a abnormal conditions where
high pore fluid supersaturation, high pore fluid velocity, high temperature exist
(Fig-ure 2-22). The fibrous illite largely increases the tortuosity of the flow path, thus
reducing the permeability significantly. At places where temperatures are above 100
*C, permeability in shale can be as low as 10~ Darcy or
10-21m
2due to fibrous
illitization (Nadeau. 2005). However, the fibrous illite is not commonly observed in
natural basin.
2.7
Texture and Fabric Study of Diagenetic Clay
Minerals
The study of clay mineral morphology replies heavily on the imaging technology. The
advancement of Scanning Electron Microscopy (SEM) and Transmission Electron
Microscopy (TEM) allow direct visual study of clay minearls down to the size of
micron scale and nanometer scale.
Three basic morphologies-elongated hairy illite, illite lath, and platy illite
flakes-are depicted in the Figure 2-23. The laths and plates flakes-are of common occurrence in
a diagenetic basin compared to fibrous or hairy illite. The morphology of neoformed
illite depends on the in-situ environment. According to Meunier and Velde (2004),
the lathy illite formed from RO to R1 stage, and platy illite mostly from R1 to more
35
ordered I/S. The lath shaped illite is most commonly observed in samples from a deep well in the Gulf of Mexico where S-I transition is from RO to R1. As illite grows from I/S to lathy shape, and finally platy shape, the thickness of I/S mineral and illite crystal increases. Figure 2-24 shows the fundamental particle (N) thickness increases as the I % in I/S increases (8rodon' & MaCarty, 2008). The thickness is measured by layer (N) counting from high resolution TEM lattice fringe images. Alternatively, Ferrage et al. (2011) obtained the N number from XRD profile fitting to estimate the thickness for each phases.
Nadeau (1985) use equation 2.7 to estimate the surface area of clay minerals using thickness of clay minerals.
800
S = 8(2.7)
T
where S is the total surface area in m2/g, T is the thickness of a clay mineral in nm.
Equation 2.7 suggests a inverse relationship between thickness of a clay mineral and surface area.
Day-Stirrat et al. (2011) investigated the orientation of clay minerals and effec-tive stress. At low stress level (<1 MPa vertical effeceffec-tive stress) and at the same vertical effective stress, smectite has less preferred orientation than illite. With in-creasing stress level, the difference between different minerals become less obvious. The stress level becomes the dominant factor in controlling clay particle preferred orientation at greater stress level (2.4 MPa vertical effective stress), clay particles becomes perpendicular to the direction of the vertical stress (Figure 2-25).
Day-Stirrat et al. (2008) and Ho et al. (1999) observed increasing degree of alignment and porosity reduction with mineralogical changes. Figure 2-26 shows that mineral transformation has a greater influence than stress on preferred orientation. Figure 2-26a shows moderate alignment while b has well alignment. Samples in Figure 2-26a and Figure 2-26b are subjected to similar vertical effective stress level, but Sample b has a higher degree of transformation than a. The comparison of the two SEM images suggests that in the mineral transition zone, chemical compression is the dominant mode compared to mechanical compression.
Ho et al. (1999) also found that the degree of preferred orientation increases abruptly with the transition from RO to R1 stage. The increase rate of preferred orientation drops in post-transition zone, the preferred orientation only increases slightly with increasing effective stress. This suggests chemical reactions including clay mineral transformation and quartz cementation have significantly stiffen the material.
Day-Stirat et al. (2008) also found that randomly oriented, curved smectitic particles are replaced by more rigid illite particles. The neoformed clay particles grow normal to the vertical effective stress, and the shape of those clay particles are platy. The effective stress does not affect the kinetics of the mineral transformation but only clay mineral morphology.
2.8
Time Dependent Behavior- Creep or Secondary
Consolidation
In general, creep 'or secondary compression is deformation without increase of effec-tive stress. For soft clay or mudrocks, secondary compression occurs after the end of primary consolidation (EOP). Log time method is generally used to determine the EOP point on a consolidation curve in e-log(t) space or strain-log(t) plot. Void ratio (e) reduction or strain increment due to secondary compression is separated from pri-mary consolidation by constructing two straight lines that intersects each other. The intersection point is EOP, the slope of the secondary compression in Figure 2-27 is
C0, and defined by Equation 2.8. Rate of secondary compression (Ca) is determined using 1D incremental loading test.
Ca =
e
(2.8)Alogt
C, is controlled by the viscous resistance of the material, it is a function of time,
temperature, and stress level. It is a function of time, temperature and stress level.
'In the geotechnical world, creep is often referred to as secondary compression.
At low stress level,
C
decreases with time. At a stress level which is similar to
the geologic scale,
C,
increases with time. At elevated temperature,
C,
increases
comparing to that at room temperature. With increasing consolidation stress, C,
keeps increasing in the overconsolidated (OC) range, then remains approximately
constant or reduces slightly in the normally consolidated (NC) range.
2.8.1
The Time Effect
Mesri and Castro (1987) found that
C
0decreases with time. With longer time
dura-tion,
C,decreases
(C,1 > Ca2 > Cea)in Figure 2-28.
Although
Ca
changes with time, the ratio of
C,
over
C,
stays rather constant
(Mesri and Castro, 1987). At low stress levels (< 1 MPa), the
Ca/Cc =
0.04
0.01,
for high plasticity soft clay, where
C,
is defined as
cc = , (2.9)
dogo,
Karig et al.'s (2003) observed that
C
0increases with time, which contradicts Mesri
and Castro's result. In Figure 2-29, three disaggregated sediments from OPD site 897
were consolidated at different stress level (5 MPa, 8 MPa and 12 MPa) and then held
stress to measure the rate of secondary compression.
Ca,,
2has a sudden increase
after 10' s.
C,
doubles or triples for C37 and C38 sample.
At high stress level, whether the rule for
Ca/Cc
ratio holds remains a question.
Karig et al. (2003) points out that the well explained geotechnical concepts might
not be valid under the geological conditions of high stress and very slow consolidation
rates.
2.8.2
The Temperature Effect
According to Mitchell and Soga (2005),
C
0increases with temperature. They
ex-plain that if sample is not heavily overconsolidated, with temperature increases, the
shearing resistance between particles decreases, causing framework weakening.
This
2C",,
is C0 in porosity space
reduction of shearing resistance leads to a reduction in the porosity until sufficient contact between grains are formed to regain shearing strength.
While the mechanism of increasing C, with temperature is well explained, there is not much experimental data quantifying the magnitude of the increase. Duffy (2012) had measured the porosity reduction of a shale specimen at high temperature for 300 hours, but it was not fully consolidated to the end of primary consolidation, and it resulted inaccurate measurement of C,.
2.8.3
The Stress Level Effect
According to Lambe & Whitman (1969), Ca increases in the OC range, and stays approximately constant or decreases with increasing stress level in NC region Figure 2-30. Karig et al. (2003) conducted 23 constant stress hold tests in the oedometers and found Ca increases with effective vertical stress in the OC range and then remains constant in the NC range (Figure 2-31). The modified C,,, of site 897 sample increases from a value of 0.001 at 1 MPa to 0.007 at 19 MPa. Although the data are scattered, the trend of increasing Ca, with increasing stress level in the OC range is clear.
2.8.4
Quasi-preconsolidation Effect
If a normally consolidated mudrock or soil sample undergoes extensive secondary compression, then continues to consolidate passing its present stress level, the stiffness of the material increases and it behaves like an overconsolidted sample. Once the vertical effective stress passes the maximum preconsolidation stress o', the material behaves like a normally consolidated sample (Figure 2-32).
According to Mesri and Castro (1987), the overconsolidation ratio (OCR) increases as the time of secondary compression increases, the OCR ratio is defined by
U t Ca/Cc
OCR= UP= (-)lC/c (2.10)
where is the preconsolidation stress resulting from secondary compression; a' is
01P is
the consolidation stress at which secondary compression holds, t, is the time to reach EOP, and C, is the recompression index.
Not only samples that experiences secondary compression, but also samples with quartz cementation or mineral transformation, experienced thermal hardening, dis-play this OCR effect or quasi-preconsolidation effect (Ladd, 1991; Mitchell et al., 2005). Combinations of several aspects often act together to create a overconsoli-dated sample.