HAL Id: hal-01613631
https://hal.archives-ouvertes.fr/hal-01613631
Submitted on 26 May 2020
HAL is a multi-disciplinary open access archive for the deposit and dissemination of sci-entific research documents, whether they are pub-lished or not. The documents may come from teaching and research institutions in France or abroad, or from public or private research centers.
L’archive ouverte pluridisciplinaire HAL, est destinée au dépôt et à la diffusion de documents scientifiques de niveau recherche, publiés ou non, émanant des établissements d’enseignement et de recherche français ou étrangers, des laboratoires publics ou privés.
Adaptive response under multiple stress exposure in
fish: From the molecular to individual level
Allison Gandar, Pascal Laffaille, Cécile Canlet, Marie Tremblay-Franco,
Roselyne Gautier, Annie Perrault, Laure Gress, Pierre Mormède, Nathalie
Tapie, Hélène Budzinski, et al.
To cite this version:
Allison Gandar, Pascal Laffaille, Cécile Canlet, Marie Tremblay-Franco, Roselyne Gautier, et al.. Adaptive response under multiple stress exposure in fish: From the molecular to individual level. Chemosphere, Elsevier, 2017, 188, pp.60-72. �10.1016/j.chemosphere.2017.08.089�. �hal-01613631�
Version postprint
Accepted Manuscript
Adaptive response under multiple stress exposure in fish: From the molecular to individual level
Allison Gandar, Pascal Laffaille, Cécile Canlet, Marie Tremblay-Franco, Roselyne Gautier, Annie Perrault, Laure Gress, Pierre Mormède, Nathalie Tapie, Hélène Budzinski, Séverine Jean
PII: S0045-6535(17)31311-5
DOI: 10.1016/j.chemosphere.2017.08.089
Reference: CHEM 19787
To appear in: ECSN
Received Date: 7 April 2017 Revised Date: 31 July 2017 Accepted Date: 18 August 2017
Please cite this article as: Gandar, A., Laffaille, P., Canlet, Cé., Tremblay-Franco, M., Gautier, R., Perrault, A., Gress, L., Mormède, P., Tapie, N., Budzinski, Héè., Jean, Sé., Adaptive response under multiple stress exposure in fish: From the molecular to individual level, Chemosphere (2017), doi: 10.1016/j.chemosphere.2017.08.089.
This is a PDF file of an unedited manuscript that has been accepted for publication. As a service to our customers we are providing this early version of the manuscript. The manuscript will undergo copyediting, typesetting, and review of the resulting proof before it is published in its final form. Please note that during the production process errors may be discovered which could affect the content, and all legal disclaimers that apply to the journal pertain.
Version postprint
M
AN
US
CR
IP
T
AC
CE
PT
ED
ACCEPTED MANUSCRIPT
Adaptive response under multiple stress exposure in fish: from the molecular to
1
individual level
2 3
Allison Gandar a, PascalLaffaille a, Cécile Canlet b, Marie Tremblay-Franco b, Roselyne Gautier b, Annie Perrault 4
a
, Laure Gress c, Pierre Mormède c, Nathalie Tapie d, Hélène Budzinski d, Séverine Jean a*. 5
6
a
EcoLab, Université de Toulouse, CNRS, INPT, UPS, Toulouse, France 7
b
Toxalim (Research Centre in Food Toxicology), Université de Toulouse, INRA, ENVT, INP-Purpan, UPS, 8
Toulouse, France. 9
c
GenPhySE, Université de Toulouse, INRA, INPT, INP-ENVT, Castanet Tolosan, France 10
d
LPTC, Molecular Sciences Institute (ISM) Université Bordeaux 1, CNRS, Talence, France 11
* corresponding author: [email protected] 12
Version postprint
M
AN
US
CR
IP
T
AC
CE
PT
ED
ACCEPTED MANUSCRIPT
Abstract
13Aquatic systems are subjected to various sources of stress due to global changes, such as increasing 14
temperature and pollution. A major challenge for the next decade will be to evaluate the combined effects of 15
these multiple stressors on organisms and ecosystems. For organisms submitted to chemical, biological or 16
physical stressors, the capacity to set up an efficient adaptive response is a fundamental prerequisite for their 17
long-term survival and performance. In this study, goldfish (Carassius auratus) were subjected to individual 18
and combined pesticide mixtures and increased temperatures to evaluate their adaptive response in 19
multistress conditions from the molecular to the individual level. Fish were exposed for 16 days to a mixture of 20
pesticides at environmental relevant concentrations (S-metolachlor, isoproturon, linuron, atrazine-desethyl, 21
aclonifen, pendimethalin and tebuconazole) and at two temperatures (22 °C and 32 °C). Three major 22
physiological traits of the stress response were measured: the hormonal response (i.e. plasma cortisol), the 23
metabolic balance from molecular to individuals’ levels (metabolomics, cellular energy allocation, energy 24
reserves and global condition indexes), and the cellular defense system induction (SOD, CAT and GST). Results 25
show that (1) environmentally relevant concentrations of pesticides lead to significant responses in fish at all 26
biological levels; (2) the metabolic response depends on the nature of stress (thermal vs. chemical); and (3) 27
fish may be unable to set up an efficient adaptive response when chemical and thermal stresses were 28
combined, with adverse outcomes at the individuals’ level. 29
Keywords: Pesticides mixtures, Climate Change, Temperature, Metabolomics, Nuclear Magnetic Resonance 30
NMR, Oxidative stress, Goldfish 31
Version postprint
M
AN
US
CR
IP
T
AC
CE
PT
ED
ACCEPTED MANUSCRIPT
1.
Introduction
33Global changes are increasingly exposing aquatic systems to multiple stressors, but predicting their 34
effects on aquatic organisms at different biological levels remains a challenge. The stress response is a set of 35
adaptive physiological responses of organisms submitted to a stimulus (a stressor) perceived as dangerous, 36
that helps maintaining homeostasis (Selye, 1950; Barton, 2002). For this purpose, the activation of the 37
sympathetic nervous system and Hypothalamic-Pituitary-Adrenal (HPA) axis initiates a cascade of physiological 38
changes triggered by catecholamines (i.e. adrenaline) and corticosteroid (i.e. cortisol) stress hormones. When 39
stress persists, organisms enter in a phase of resistance characterized by the induction of cellular defense 40
systems (Selye, 1946; 1950). The bioenergetic cost of the defense is supported by metabolic trade-offs 41
between maintenance, activity, growth, reproduction and energy storage (Calow, 1991; Handy et al., 1999; 42
Marchand et al., 2004). When stress is chronic or exceeds the defense and compensation capacities, adverse 43
effects on survival and fitness of organisms may occur (Selye, 1950; Barton, 2002). 44
France is the leading European country in terms of agricultural area (Alim’agri, 2012) and the fourth 45
largest consumer of pesticides in the world (Bonnefoy, 2012). The 15 most frequently detected molecules in 46
surface waters are herbicides and fungicides, essentially used to limit weeds production and control pathogen 47
invasion in field crops and viticulture (Butault et al., 2010). While the adverse effects of insecticides on non-48
target species are subject to a broad consensus within the scientific community, the toxicity of herbicides at 49
environmentally relevant concentrations for aquatic vertebrates remains largely controversial (Solomon et al., 50
2008, 2013; Van Der Kraak et al., 2014). Previous studies focused almost exclusively on the effects of a single 51
molecule. Studies on the effects of complex and realistic mixtures of pesticides on aquatic vertebrates are 52
extremely rare, which can lead to a dramatic underestimation of the risks for wildlife (Hayes et al., 2006). At 53
the same time, aquatic systems are submitted to environmental changes, such as increasing temperature. 54
Interactions between contaminants and water temperature can be particularly deleterious for ectothermic 55
species as the temperature directly affects many biochemical and physiological processes (López-Olmeda, and 56
Sánchez-Vázquez, 2011; Manciocco et al., 2014). Higher temperature leads to increased energy demand. By 57
affecting the metabolic level of individuals, the temperature can change the ability of aquatic organisms to 58
effectively respond to chemical contamination, and vice versa (Lemly, 1996; Kennedy and Ross, 2012; 59
Sokolova, 2013). The majority of studies thus shows a synergistic effect of temperature on the toxicity of 60
pollutants, especially in aquatic species (Schiedek et al., 2007; Noyes et al., 2009; Holmstrup et al., 2010; Laetz 61
et al., 2014). Inversely, the exposure to pollutants may affect the temperature tolerance in fish species 62
(Manciocco et al., 2014). However, there is a lack of knowledge about combined effects between temperature 63
and pesticide mixtures on aquatic vertebrates. In previous studies (Gandar et al., 2015, 2017), we exposed 64
goldfish (Carassius auratus) to higher temperature and a mixture of herbicides and fungicides at realistic 65
concentrations for 96 hours. Results showed significant cross effects between temperature and pesticides on 66
behavioral responses, energy reserves and hepatic proteome profile, suggesting that combined thermal and 67
Version postprint
M
AN
US
CR
IP
T
AC
CE
PT
ED
ACCEPTED MANUSCRIPT
chemical stressors impaired the stress response of the goldfish to individual stressors (Gandar et al., 2015, 68
2017). However, the effects of a longer exposure on fish global performance across biological levels remain to 69
be determined. 70
Therefore, the aim of this study was to assess the adaptive response to stress of goldfish submitted to 71
single and combined chemical and thermal stresses, integrating responses from the molecular to the whole 72
organism level. To that end, goldfish were exposed during 16 days to a mixture of six herbicides (S-73
Metolachlor, Isoproturon, Linuron, Aclonifen, Atrazine-desethyl and Pendimethalin) and one fungicide 74
(Tebuconazol) to a total concentration of 42 µg.L-1 at two temperatures (22 °C and 32 °C). The stress response 75
was investigated at 6 h, 96 h and 16 d of exposure, including plasma cortisol concentration, hepatic induction 76
of antioxidant enzymatic defenses (superoxide dismutase SOD, catalase CAT) and enzymatic system of 77
detoxification Glutathion-S-Transferase (GST), hepatic metabolome response by 1H-NMR metabolomic 78
analysis, energy reserves and cellular energy allocation in liver and white muscle, somatic indexes (muscle and 79
hepatic indexes) and global condition of fish (Fulton’s condition factor). 80
2.
Materials and methods
81
2.1. Pesticide mixture 82
The objective of the study was to characterize fish responses to environmentally relevant pesticide 83
mixtures at different temperatures. The mixture was developed on the basis of the pesticide contamination of 84
the Save River (France), assessed from March 2008 to November 2009 (Polard et al., 2011) as described by 85
Gandar et al. 2017. According to the analysis conducted by Pollard et al. (2011) and Taghavi et al. (2011), we 86
selected six herbicides and one fungicide using three criteria: the frequency of detection, the concentration 87
and the representation of the different families of molecules detected. Selected molecules are S-metolachlor, 88
Isoproturon, Linuron, Tebuconazol, Aclonifen, Atrazine-desethyl and Pendimethalin (Supplementary Table 1). 89
Pesticide concentrations in water were measured after 16 d of exposure. Water samples of 1 mL were spiked 90
with internal standards solution (Simazine D10, Atrazine-desethyl D7, Isoproturon D6, Linuron D6, Metolachlor 91
D6, Pendimethalin D5, Tebuconazole D6) and directly analyzed on an Agilent liquid chromatographic system 92
coupled with a triple quadrupole mass spectrometer (Agilent LC 1290 Infinity / 6460 Triple quadrupole) 93
equipped with an electrospray ionization source used in positive mode (ESI+) (adapted from Gamain et al., 94
2016). Pesticides were quantified using a quantification transition. Analytical method was validated in terms of 95
calibration linearity, specificity, and limits of quantifications (0.005 to 0.5 µg.L-1). Recoveries of samples of 96
fortified mineral water were evaluated for water analysis (from 89 to 116%). Control calibrating standards 97
were also injected every 15 samples and analytical blanks were performed. All solvents for chemicals analysis 98
were at least of analytical grade. The measured concentration of pesticides showing a slight decrease 99
compared to expected values (total concentration of 38.7 µg.L-1, Supplementary Table 1). Pesticide standards 100
were obtained from Sigma-Aldrich (St. Louis, MO, USA): S-metolachlor (CAS-No: 87392-12-9, 101
Version postprint
M
AN
US
CR
IP
T
AC
CE
PT
ED
ACCEPTED MANUSCRIPT
PESTANAL®,98,4% pure), Isoproturon (CAS-No: 34123-59-6, PESTANAL®, 99% pure), Linuron (CAS-No: 330-55-102
2, PESTANAL®, 99,7% pure), Atrazine-desethyl No: 6190-65-4, PESTANAL®, 99,5% pure), Aclonifen (CAS-103
No: 74070-46-5, PESTANAL®, 99,8% pure), Pendimethalin (CAS-No: 40487-42-1, PROWL®, 98,8% pure), 104
Tebuconazol (CAS-No:107534-96-3, PESTANAL®, 99,3% pure). Acetone (CAS: 67-64-1, Fisher Chemical, HPLC 105
solvent) was purchased from Fisher Scientific (Illkirch, France). Scintillation liquid (Flo-Scint II™) was purchased 106
from Perkin Elmer (Waltham, Massachusetts, USA). 107
2.2. Animal care 108
Fish were purchased from the fish farming Carpio (Consac, France) in the size range 10-12 cm. They 109
were first acclimatized for two weeks in opaque tanks under controlled conditions (18 °C with a 12:12 h light 110
regime). Water was aerated and dechlorinated prior to fish introduction. Half of the water was renewed every 111
day and fish were fed daily with commercial pellets. No mortality occurred during the acclimation period. 112
Experimental procedures were conducted under French animal handler’s certificate no.31-103, giving 113
authorization to experiment on living vertebrates. 114
2.3. Experimental design 115
Fish were exposed to a pesticide mixture and/or temperature increased to obtain four conditions: the 116
CONTROL group (fish at 22 °C non-exposed to pesticides), the TEMP group (fish at 32 °C non-exposed to 117
pesticides), the PEST group (fish exposed to pesticides at 22 °C) and the PEST*TEMP groups (fish exposed to 118
pesticides at 32 °C) as previously described (Gandar et al., 2017). Goldfish were placed in 60 L opaque aquaria 119
in a temperature controlled room (22 °C, 12 fish per aquarium and 2 aquaria per condition*exposure time). 120
Prior to pesticide exposure, the water of the TEMP and PEST*TEMP groups was gradually heated (1 °C/day) to 121
reach 32 °C. Fish were then exposed for 6 h, 96 h or 16 d to the mixture of pesticides. Water was renewed by 122
half every day. Temperature, pH, oxygenation and conductivity were assessed 1 h after the water renewal 123
(Supplementary Table 2). Ammonium, nitrites and nitrates concentrations were measured by colorimetry at 124
each time of exposure (Supplementary Table 2). Fish were fed daily and no mortality occurred during 125
exposures. 126
Twelve fish per condition were randomly sampled at 6 h, 96 h and 16 d. Fish were euthanized with an 127
overdose of benzocaine. Blood samples were collected from the caudal vein by puncturing using a heparinized 128
syringe and centrifuged. Plasma samples were kept at -80 °C. Fish were weighted (to the nearest 10 mg) and 129
measured (fork length to the nearest mm). Livers and white muscles were collected, weighted (to the nearest 130
0.1 mg), frozen in liquid nitrogen and kept at -80 °C. 131
2.4. Plasma cortisol concentration 132
Plasma cortisol concentration was assessed by radioimmunoassay (RIA) as previously described 133
(Désautés et al., 1997). The plasma cortisol concentration was expressed in ng.mL-1. 134
Version postprint
M
AN
US
CR
IP
T
AC
CE
PT
ED
ACCEPTED MANUSCRIPT
2.5. Metabolomic analysis 135 2.5.1.Metabolite extraction 136Metabolites were extracted from 50 mg tissue samples with a methanol/chloroform/water 137
(2.0:2.0:1.8) solvent mixture using a Twostep protocol adapted from Lin et al. (2007) and Wu et al. (2008) with 138
slight modifications. Briefly, livers of fish were ground and weighted. A 50 mg sample was homogenized using 139
a Fastprep® homogenizer with methanol (4 mL.g-1) and Milli-Q water (0.85 mL.g-1) and vortexed for 5 s. 140
Samples were then mixed with chloroform (4 mL.g-1) and Milli-Q water (2 mL.g-1) and vortexed during 5 s, 141
incubated 15 min at 4 °C and then centrifuged at 2800 g for 15 min. The entire upper layer was collected and 142
kept at -20 °C. 143
2.5.2.1D-1H NMR spectroscopy and spectral preprocessing 144
Samples were evaporated using a SpeedVac and resuspended in a phosphate buffer (pH 7.4) prepared 145
in a deuterated water (D2O) and containing 1 mM of sodium 3-trimethylsilyl-2,2,3,3-d4-propionate (TMSP,
146
internal chemical shift standard). Samples were centrifuged and 600 µl of supernatant were transferred in 5 147
mm NMR tubes. NMR Spectra were acquired at 600 MHz with a Bruker Avance spectrometer (Bruker, 148
Karlruhe, Germany) with a SampleJet autosampler using a NOESY 1D sequence to remove the water signal. For 149
1D spectra, 256 scans were collected into 64,000 data points with a relaxation delay of 2 s. The free induction 150
decays (FID) were Fourier transformed and spectra were phased, baseline corrected and calibrated (TMSP, δ 0 151
ppm) using TOPSPIN v2.1 software (Bruker, Karlsruhe, Germany). A variable size bucketing was used and 102 152
buckets were selected according to resonance signals and multiplicity between 9.4 and 0.5 ppm, excluding 153
residual water signal. The signal intensity in each bucket was integrated using AMIX software (version 3.9.13, 154
Bruker, Karlsruhe, Germany). Data were normalized with respect to the total spectrum intensity using mean-155
centering and Pareto scaling to allow comparison between samples. 156
2.5.3.Statistical analysis 157
Supervised Partial Least Square-Discriminant Analysis (PLS-DA) was used to assess the discrimination 158
between groups. OSC filter was applied prior to the analysis to remove the analytical and biological variations 159
that were not related to group discrimination (Beckwith-Hall et al., 2002). Q2 (predictability of the model, 160
threshold of 0.4) and R2 (total explained variations) values were used to confirm the validity of the models. 161
Permutation tests (200 iterations) were then applied to assess PLS-DA model robustness. The Variable 162
Importance in Projection (VIP, weight of variables for each component; value > 1.0 - arbitrary threshold) was 163
used to determine discriminant buckets. Comparisons between conditions were performed using Kruskal-164
Wallis tests and post-hoc tests (significance threshold = 0.05). 165
SIMCA P and R softwares were used respectively for PLS-DA analysis and Kruskal-Wallis test. 166
Version postprint
M
AN
US
CR
IP
T
AC
CE
PT
ED
ACCEPTED MANUSCRIPT
2.5.4.Peak assignments 167The discriminant metabolites were identified using the literature, home-made and freeware databases 168
such as the Biological Magnetic Resonance Data Bank (www.bmrb.wisc.edu/) (Ulrich et al., 2008) and the 169
Human Metabolome Database (www.hmdb.ca/) (Wishart et al., 2007). To confirm the chemical structure of 170
metabolites of interest, 2D 1H-1H COSY (Correlation Spectroscopy) and 2D 1H-13C HSQC 5Heteronuclear Single 171
Quantum Coherence Spectrosocpy) NMR experiments were performed on selected samples. The spectral 172
assignment was based on matching 1D and 2D data to reference spectra. 173
2.6. Energy reserves and cellular energy allocation 174
Energetic reserves at the molecular and cellular level are essential to sustain the stress responses of 175
fish. Total carbohydrate, lipid and protein contents and oxygen consumption rate in the electron transport 176
system (ETS) were measured in liver and white muscle of fish with protocols adapted from De Coen and 177
Janssen (1997). Carbohydrate concentration (µg.mg-1 of tissue) was quantified using a microplate 178
spectrophotometer at 492 nm against glucose in TCA. Protein concentration (µg.mg-1 of tissue) was quantified 179
by adding Bradford reagent and reading absortion at 595 nm against bovine serum albumin in 0,2 N NaOH 180
(Bradford, 1976). Total lipid concentration (µg.mg-1 of tissue) was measured by reading absorption at 525 nm 181
against tripalmitin in chloroform. The ETS activity (mJ.mg-1 tissue.h-1), was measured by absorbance reading at 182
490 nm when iodonitrotetrazolium (INT) was added and during 3 min. The molar extinction coefficient of 183
15,900 M-1cm-1 was used. 184
Carbohydrate, protein and lipid concentrations were transformed in their energetic values (mJ. mg-1 of 185
tissue) using their enthalpy of combustion (17, 24 and 39.5 kJ.g-1 respectively). Available energy (AE), energy 186
consumption (EC) and cellular energy allocation (CEA) in liver and white muscle were then calculated according 187
to Verslycke et al. (2004): 188
AE= carbohydrates + proteins + lipids (mJ.mg-1 tissue) (1) 189
EC = ETS activity (mJ.mg tissue-1.h-1) (2) 190 CEA = AE EC (h -1 ) (3) 191 192
2.7. Antioxidant and detoxification enzymes 193
The antioxidant system is a central component of the defense system against chemical and thermal 194
stressors. The activities of the SOD, CAT and GST were measured in the liver of fish by spectrophotometry. 195
Protocols were adapted from Feirrera et al. (2015). Briefly, tissue (50 mg) was homogenized at 4 °C using a 196
FastPrep® in K-phosphate buffer (1 mL, 0.1 M pH 7.8; 100 mM K-phosphate, 20% (v/v) glycerol and 0.2 mM 197
fluoride phenylmethylsulphonyl). Homogenates were centrifuged at 10,000 g for 15 min at 4 °C. Supernatants 198
Version postprint
M
AN
US
CR
IP
T
AC
CE
PT
ED
ACCEPTED MANUSCRIPT
(post-mitochondrial fraction, PMS) were distributed in 4 volumes of 100 mL and stored at -80 °C for two 199
weeks. 200
Protein concentrations were determined with the Bradford method. CAT activity was determined at 201
240 nm by measuring the breakdown of H2O2 (Babo and Vasseur, 1992). SOD activity was measured at 340 nm
202
for 5 minutes against standard SOD (Paoletti et al., 1986). GST activity was assessed at 340 nm for 5 min by 203
measuring the conjugation between 1-chloro- 2,4-dinitrobenzene and reduced glutathione (Habig et al., 1974). 204
The enzyme activity was expressed in units per mg of proteins (U.mg-1). 205
2.8. Somatic and condition indexes 206
At the individual level, energetic reserves and condition indexes are an essential component of the 207
physiological state of the fish. Hepatosomatic index (HSI) and white muscle index (MI) reflect the metabolic 208
status of the liver (Chellappa et al., 1995; Zheng et al., 2013) and white muscles (Moon and Johnston, 1980) 209
respectively. They were calculated as follow: 210
HSI = liver weight (g)
total weight(g) - liver weight (g)x 100 (4)
211
MI = muscle weight (g)
total weight(g) x 100 (5)
212
The Fulton’s condition factor (FCF) is an index of the “well-being” of fish and reflects their global 213
metabolic status (Smolders et al., 2005). It was calculated from weight and length of fish as follow: 214 FCF = weight (g) length (cm)3 (6) 215 216 2.9. Statistical analyses 217
Except for the metabolomics data, differences between groups were analyzed with ANOVA software 218
and LSD post-hoc tests after validation of the assumption of homogenous variances with Levene test. 219
Canonical analyses were used to integrate data from plasma cortisol concentration, AE and CE in liver and 220
muscle, somatic indexes (HSI and MI) and condition factor (FCF) of fish. The distance between groups was 221
calculated for each time of exposure with the Mahalanobis distance, and the obtained p-value was used to 222
determine significant separation with a threshold of 0.05. 223
224
3.
Results
225
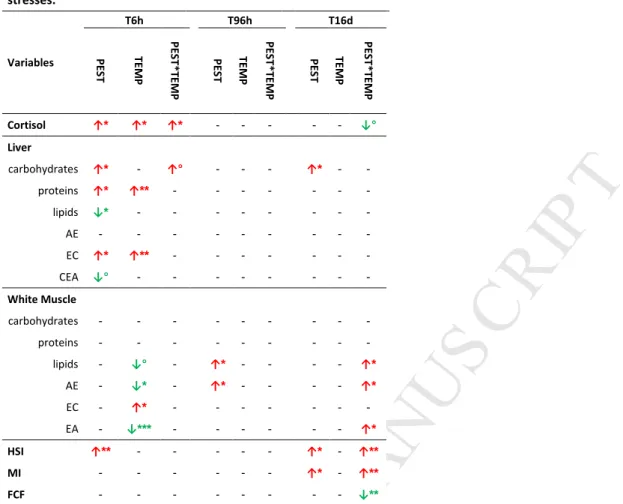
3.1. Endocrine, metabolic and physiological responses 226
The direction and significance of the endocrine, metabolic and physiological responses of fish to individual and 227
combined chemical and thermal stresses are presented in Table 4. The mean values for all parameters are 228
Version postprint
M
AN
US
CR
IP
T
AC
CE
PT
ED
ACCEPTED MANUSCRIPT
listed in the Supplementary Table 3. Compared to the CONTROL group, PEST exposure significantly increased 229
plasma cortisol at T6 h, hepatic carbohydrates at T6 h and T16 d, hepatic proteins at T6 h, liver EC at T6 h, 230
lipids and AE in muscle at T96 h and HSI at T6 h and T16 d. A decrease was found in liver lipids. At T6 h, the 231
TEMP group showed increases in cortisol, hepatic protein concentration and EC in liver and white muscle. A 232
decrease was observed in muscle AE and CEA. No effects were found at T96 h and T16 d (Table 4, Table S3). 233
The PEST*TEMP group showed an increase of plasma cortisol at T6 h compared to CONTROL, but the 234
concentration was similar to that observed in both individual stress groups (Supplementary Table 3). There 235
was no other effect compared to CONTROL at T6h. On the opposite, PEST*TEMP significantly increased muscle 236
lipids, AE and CEA, HSI and MI at T16d. A significant decrease in the FCF was observed at T16d. PEST*TEMP 237
also tended to decrease the plasma cortisol concentration compared to CONTROL group at T16d (p=0.053, LSD 238
post-hoc test). 239
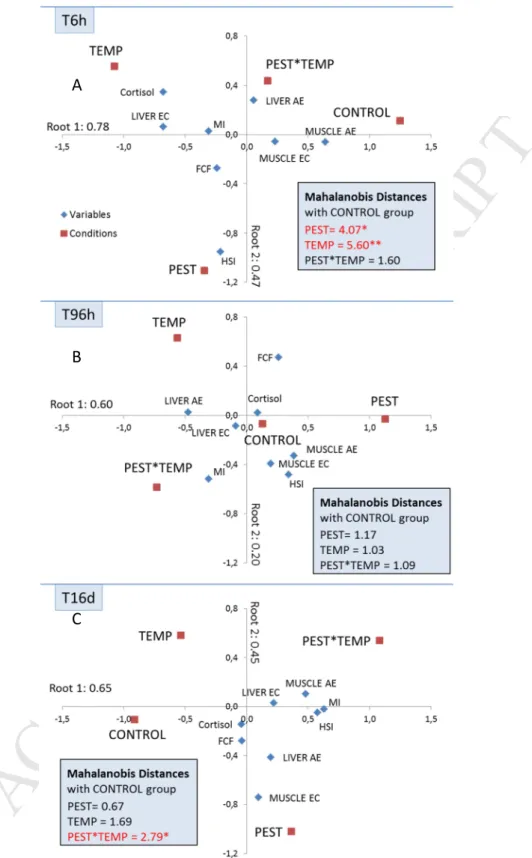
Plasma cortisol concentration, liver and muscle AE and CE, somatic indexes (HSI and MI) and condition factor 240
(FCF) of fish were integrated in canonical analyses associated to Mahalanobis distance computation to 241
measure the separation between groups. Canonical representations for each exposure time and Mahalanobis 242
distances between CONTROL and stressed groups were shown in the Fig. 1. Results showed a stress-specific 243
and time-dependent response of fish with an opposite trend between individual and combined stress effects. 244
The canonical analysis and Mahalanobis distances showed a significant separation between the CONTROL 245
group and both the TEMP and PEST groups at T6 h (Fig. 1A), but not at T96 h and T16 d (Fig. 1B and C 246
respectively). On the opposite, the distance between the PEST*TEMP and the CONTROL groups was non-247
significant after 6 h but increased over time to become significant after 16 d. 248
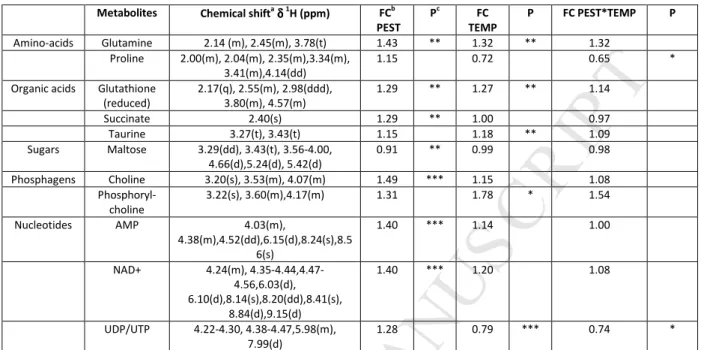
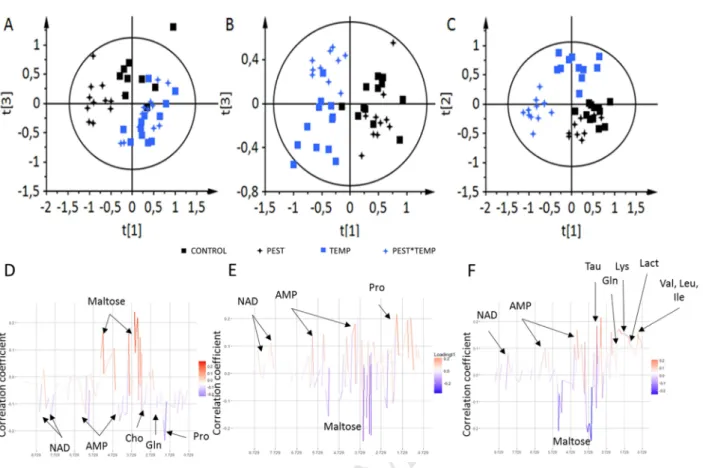
3.2. 1H-NMR metabolomic analysis 249
Representative 600 MHz 1H NMR spectra of control and exposed goldfish obtained from aqueous 250
extracts of liver tissues at time-point 16 days were shown in Supplementary Fig. 1. Primary metabolites have 251
been annotated in the spectra. OSC-PLS-DA score plots obtained for each exposure duration are shown in Fig. 252
2. 253
At T6 h, a valid and robust model (A=3 latent component, R2=52.7%, Q2=0.37) has been built for the 254
integrated spectra: the score plot of the PLS-DA (Fig. 2A) showed a clear separation between the group of 255
fishes at 22 °C and the group of fishes at 32 °C, regardless pesticides exposure. 256
36 buckets had a VIP value > 1.0 and was statistically different by the Kruskal–Wallis test. These 257
differences corresponded to 12 metabolites, according to 2D NMR spectra annotation. High temperature 258
(TEMP) increased glutamine, reduced glutathione, phosphorylcholine, taurine, and decreased UDP and UTP 259
compared to CONTROL group. The PEST*TEMP and the TEMP groups were not clearly separated on the OSC-260
PLS-DA score plot (Fig. 2A). However, PEST*TEMP exposure significantly decreased proline, UDP and UTP levels 261
Version postprint
M
AN
US
CR
IP
T
AC
CE
PT
ED
ACCEPTED MANUSCRIPT
compared to control fish, and PEST exposure significantly increased glutamine, reduced glutathione, succinate, 262
choline, AMP, NAD+ and decreased maltose level compared to control fish (Table 1 and Fig. 2D). 263
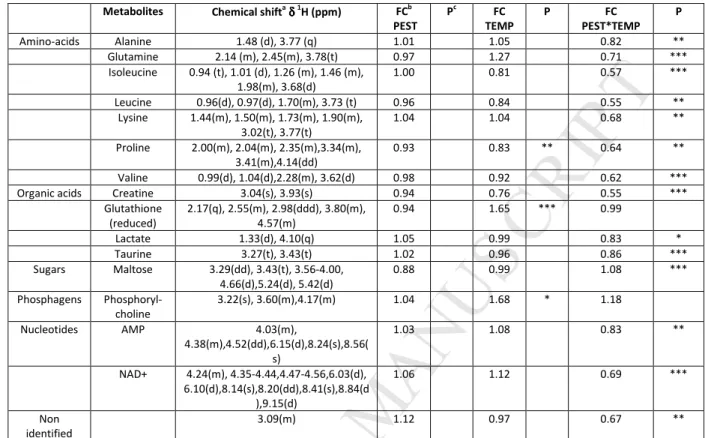
At T96 h, the score plot of the PLS-DA showed a clear separation between the 22 °C group and the 32 264
°C group along the first latent component, and between the exposed fish and the non-exposed fish for the 32 265
°C group (Fig. 2B). This analysis generated a PLS‑DA model with three latent components, with R2Y = 54.3% 266
and Q2 = 0.34. Thirty buckets were identified as discriminant in the metabolic profiles, corresponding to 8 267
metabolites. Despite close metabolic fingerprints for these two groups, PEST exposure significantly decreased 268
AMP compared to CONTROL. In the TEMP group, significant increase was observed for maltose, while proline, 269
malonate, AMP, NAD+, UDP and UTP decreased. PEST*TEMP exposure significantly decreased proline, 270
succinate, AMP, NAD+, UDP and UTP (Table 2 and Fig. 2E). 271
At T16 d, same patterns were observed in the score plot (Fig. 2C) but difference between exposed and 272
non-exposed fishes at 32 °C was more pronounced. 15 metabolites were found significant between at least 273
two groups. As compared to CONTROL, decreases were found in isoleucine, leucine, valine, alanine, proline, 274
lysine, glutamine, creatine, taurine, lactate, AMP, NAD+ and increases were found in maltose for the 275
PEST*TEMP group. TEMP condition increased significantly reduced glutathione and phosphorylcholine, and 276
decreased proline compared to CONTROL. No discriminant metabolites were found for PEST exposure (Table 3 277
and Fig. 2F). 278
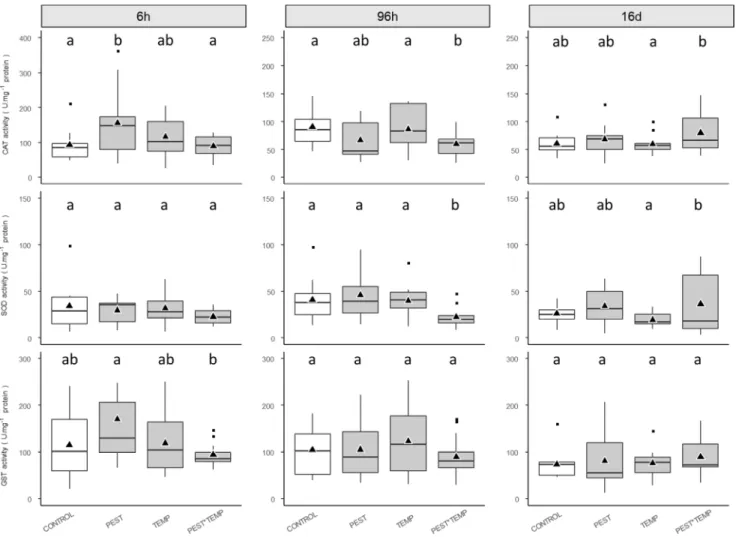
3.3. Defense system induction 279
SOD, CAT and GST activities were measured in the liver of fish (Fig. 3). An increase of CAT activity was 280
observed in the PEST group at T6 h. CAT and SOD activity decreased in the PEST*TEMP group at T96 h and 281
then increased at T16 d. GST activity tended to increase in the PEST group at T6 h compared to the CONTROL 282
and was significantly higher than in the PEST*TEMP group. No effects were observed at T96 h and T16 d. The 283
TEMP group showed no response of these enzyme activities. 284
285
4.
Discussion
286
The aim of this study was to assess the adaptive response of goldfish submitted to individual and 287
combined chemical and thermal stress. We first characterized the primary endocrine stress response (plasma 288
cortisol), then secondary responses (hepatic induction of enzymatic defense systems and metabolic responses 289
in liver and white muscles) and tertiary responses (global condition of fish). We found stress-specific and time-290
dependent responses of goldfish at all biological levels observed. Multivariate analyses showed two 291
contrasting patterns of response (1) Fish exposed to single chemical or thermal stressors had a significant 292
stress response at T6 h followed by a recovery at T96 h and T16 d from the molecular to the individual levels 293
(significant stress response and low deleterious effects across biological levels). In contrast, (2) fish exposed to 294
Version postprint
M
AN
US
CR
IP
T
AC
CE
PT
ED
ACCEPTED MANUSCRIPT
combined chemical and thermal stressors had no stress response at T6 h, followed by important deleterious 295
changes at T16 d from the molecular to the individual levels (absence of stress response and high deleterious 296
effects across biological levels). 297
4.1 Responses to individual stress (PEST and TEMP groups): an adapted and coordinated early 298
response. 299
4.1.1 Cortisol response to single stressors 300
In fish exposed to single stressors, we found an increase of plasma cortisol concentration at T6h in all 301
stressed groups compared to the CONTROL groups. Several studies have shown an increase in plasma cortisol 302
in fish exposed to herbicides (Waring and Moore, 2004; Soso et al., 2007), fungicides (Hashim and Zaki, 2005; 303
Tierney et al., 2006) or temperature increase (Lyytikäinen et al., 2002; Fernandino et al., 2013). Our results 304
show that both pesticide mixture and temperature increase triggers an endocrine stress response, showing 305
that fish have initiated a general stress response. It was associated to the induction of a number of antioxidant 306
defense systems, depending on the nature of the stress. For instance we observed an increase in CAT and GST 307
activities, glutathione, and glutamine - on which glutathione synthesis depends - and taurine. 308
4.1.2 Antioxydant response to single stressors 309
CAT and SOD catalyze the reduction of ROS, participating to their detoxification (Regoli et al., 2011; 310
Regoli and Giuliani, 2014). In another hand, GST intervenes in the detoxification of both ROS and lipophilic 311
chemicals, such as pesticides, by catalyzing their conjugation with glutathione. Induction of CAT, SOD and/or 312
GST are consistent with results of previous studies in fish exposed to herbicides (Jin et al., 2010; Guilherme et 313
al., 2012; Stara et al., 2012; Xing et al., 2012; Blahová et al., 2013; Nwani et al., 2013; Sinhorin et al., 2014) and 314
high temperature (Gorbi et al., 2005; Madeira et al., 2013; Yin et al., 2013). We observed a transient increase 315
activity of CAT and GST in the PEST group at T6 h, suggesting an increase in ROS production under the pesticide 316
exposure, although SOD activity remained at the control level. GST activity increased also suggesting an 317
induction of the hepatic detoxification process. In contrast, no responses of CAT, SOD and GST activity were 318
observed in the TEMP group, despite the fact that temperature increase is a well-known pro-oxidant factor in 319
ectothermic species (Cui et al, 2014). 320
Glutathione is a well-known ROS scavenger and was used as a biomarker of oxidative stress in many 321
studies (Regoli et al., 2011). Glutathione synthesis depends on the cellular concentration of glutamate and 322
glutamine (DeBerardinis and Cheng, 2010). NMR analysis showed an increase of these molecules at T6 h in 323
both the PEST and TEMP groups. Considering their extensive variety of critical roles in cell function and 324
antioxidant defenses, the increase of glutamine in the liver of fish can be considered as an important response 325
to both chemical and thermal stressors. 326
Thermal stressor also increased hepatic taurine levels at T6 h and decreased malonate at T96 h. 327
Taurine is a sulfur-amino acid which counteracts oxidative stress, although specific mechanisms are poorly 328
Version postprint
M
AN
US
CR
IP
T
AC
CE
PT
ED
ACCEPTED MANUSCRIPT
understood (Kumar et al., 2009; Rosemberg et al., 2010). On the opposite, malonate induces mitochondrial 329
potential collapse and ROS production, leading to cell death (Fernandez-Gomez et al., 2005). Consequently, 330
increased taurine level and decreased malonate may act in the same way to prevent ROS induced damages in 331
thermal exposed fish. 332
An increase in phospholipid precursor concentrations (choline and derivative) in both groups may also 333
be a response to lipid peroxidation caused by oxidative stress and requiring the synthesis of novel 334
phospholipids (Li et al., 2014; Xu et al., 2015). 335
4.1.3 Metabolic response to single stressors 336
At the same time, an increase in energy consumption is observed in the liver - increased liver energy 337
consumption (EC) at T6 h in both the PEST and TEMP groups - and, for the TEMP group, in the muscle. The 338
increase in basal metabolism is classic in fish subjected to stress and corresponds to the bioenergetic cost of 339
the induction of systems of protection, detoxification and repair of damage. Increased ETS activity was shown 340
in ectotherm species in response to chemical exposure and temperature increase (Gagné et al., 2006, 2007; 341
Sappal et al., 2015; Schmidlin et al., 2015), which is consistent with our results. ETS activity reflects the 342
production of ATP by mitochondria which depends directly on the cellular energy demand (Gagné et al., 2007; 343
Smith et al., 2012). The induction of defense systems, including detoxification, protection and reparation 344
processes, is a costly process which increases the cellular energy demand and requires metabolic 345
compensations (Sherwood et al., 2000; Trudel et al., 2010; Sokolova et al., 2012). Proteins are the most costly 346
energy molecules to synthesize (Jorgensen, 1988; Smith et al., 2001). Increased hepatic protein concentrations 347
were observed at T6 h in both the PEST and TEMP exposed fish. These increases may reflect the induction of 348
defense systems, including antioxidant enzymes or heat shock proteins (Viant et al., 2003). Increased 349
bioenergetic cost due to defense protein induction was shown in fish exposed to heat shock (Viant et al., 2003) 350
or pollutants (Smith et al., 2001). We can also note that protein concentrations increased at T6 h but not at 351
T96 h or T16 d, which is consistent with the induction of antioxidant defenses and the increased energy 352
consumed. In PEST exposed fish, the co-occurring increases observed at T6 h in liver EC, AMP and succinate, an 353
intermediary product of the TCA cycle, showed a metabolic compensation to the increased energy 354
requirement. In a consistent way, hepatic glucose and lipids, which are important substrates for the energy 355
production pathways, showed important decreases at T6 h. However, we found an increase in total 356
carbohydrate concentration in liver at T6 h and T16 d. Glycogen is the common form of storage of 357
carbohydrates in cells and increased glycogen deposition is a classic metabolic response to cortisol (Mommsen 358
et al., 1999). Maltose was also significantly decreased in livers after 6 h of pesticides exposure. Maltose as a 359
disaccharide could yield two monosaccharides of glucose upon hydrolysis. Maltose degradation could serve as 360
an energy supplement to replenish pesticides induced energy demand (Li et al., 2017). In the TEMP group, 361
energy consumption increased at T6 h both in liver and white muscle, associated with significant decreases in 362
muscular AE and CEA. In the tolerance range, a higher temperature affects biochemical kinetics and enzyme 363
Version postprint
M
AN
US
CR
IP
T
AC
CE
PT
ED
ACCEPTED MANUSCRIPT
activity leading to basal and active metabolism increased (Cech et al., 1985; López-Olmeda and Sánchez-364
Vázquez, 2011; Manciocco et al., 2014). The increased energy consumption observed in liver and muscle at T6 365
h, and the decreased available energy in muscle are consistent with systemic metabolic acceleration under 366
higher temperature. The drop observed at T6 h in the muscle CEA reflected a decreased metabolic status. 367
Inversely, the hepatic CEA remained constant despite the increased energy consumption. A similar dichotomy 368
between muscular and hepatic metabolic responses to heat shock was observed in Oncorhynchus mykiss 369
(Viant et al., 2003). Under stress, lipid and protein reserves in white muscles are released into the blood 370
system, carried to the liver and used as substrates for gluconeogenesis and protein synthesis (Mommsen et al., 371
1999). These results show that higher temperature induce an increased energy demand and metabolic 372
compensation through the whole organism. The vast majority of metabolic responses to higher temperature 373
disappeared at T96 h and T16 d, suggesting that thermal exposed fish reached an adapted physiological status. 374
So, with increased temperatures, the increase in metabolism is also directly related to the effect of 375
temperature on the enzymatic activity and kinetics of biochemical reactions. This energy cost is supported by 376
an increase in ATP production by ETS as well as glycolysis, Krebs cycle and gluconeogenesis from liver and / or 377
muscle proteins or lipids. 378
4.1.4 Physiological response to single stressors 379
Finally, the lack of effect on the general condition of the fish and the disappearance of most of these 380
responses at the end of the experiment suggest that the fish have an effective response to achieve a more 381
appropriate physiological state. However, some effects persist at T16 d in the liver of the PEST group, 382
especially for the HSI that increase at T6 h and T16 d. HSI increase was shown in fish exposed to pesticides 383
(Arnold et al., 1995; Biagianti-Risbourg and Bastide, 1995; Bacchetta et al., 2014). HSI is correlated to the 384
metabolic status of the liver, and may reflect increased glycogen storage (Chellappa et al., 1995; Zheng et al., 385
2013). But a swollen HSI may also be due to sequestration of lipophilic pollutants in lipid droplets (Biagianti-386
Risbourg and Bastide, 1995), increased detoxification capacities (Arnold et al., 1995; Bacchetta et al., 2014) or 387
degenerative changes in the liver tissue (Arnold et al., 1995; Guardiola et al., 2014). Histopathological analyzes 388
could determine whether this effect is indicative of histological damage caused by pesticides, increased liver 389
detoxification capacities or pesticide trapping in lipid vacuoles. We can therefore conclude that pesticide 390
exposure induced an increased energy demand in the liver of the goldfish, probably due to defense system 391
induction, and metabolic compensations. While other responses shut down, the increased HSI, MI and hepatic 392
carbohydrate concentration observed at T16 d indicated persisting metabolic and/or histological perturbations 393
in goldfish exposed to the pesticide mixture. However, compared to fish exposed to combined stressors, fish 394
exposed to single stressors had lower deleterious effects of treatments at the individual level. 395
To summarize, fish exposed to single stressors displayed a significant cortisol response with 396
coordinated effects on the metabolism and energetic reserves and low deleterious effects at different time 397
scales. These results are consistent with a metabolic compensation strategy, i.e. the set-up of a coordinated 398
Version postprint
M
AN
US
CR
IP
T
AC
CE
PT
ED
ACCEPTED MANUSCRIPT
stress responses and metabolic responses with a depletion of energetic reserves to maintain homeostasis and 399
limit the deleterious effects of single stressors (Sokolova et al., 2013). However, it is not clear yet whether fish 400
can implement such coordinated stress response when exposed to a combination of stressors that may have 401
synergistic or antagonistic effects. 402
4.2 Responses to combined stressors (PEST * TEMP group): an inhibited early response and significant 403
effects from the molecular to the individual scale at T16 d. 404
4.2.1 Cortisol response to combined stressors 405
Cortisol level in fish subjected to both an increase in temperature, and pesticides mixture increased at 406
T6 h. Surprisingly, combined stressors did not lead to an additional increase in cortisol secretion. This result 407
shows that fish under thermal stress does not respond to pesticide exposure by an increase in cortisol 408
secretion. First, a possible explanation is that pesticide mixture toxicity decreases with the increase in 409
temperature. However, the vast majority of studies on aquatic vertebrates showed an opposite effect (Gluth 410
and Hanke, 1984; Ferrando et al., 1987; Osterauer and Köhler, 2008; Rohr and Palmer, 2013). Second, the 411
exposure to a first stressor may affect the normal function of the HPI axis and prevent the induction of a stress 412
response to a subsequent stressor (Romero, 2004; Auperin and Geslin, 2008). In this last case, the 413
hyporesponsive HPI axis to a consecutive stressor could shut down the fish ability to perform an appropriate 414
stress response (Romero, 2004, 2010). 415
It is also interesting to note that cortisol concentration tended to decrease in the PEST*TEMP group 416
compared to controls after 16 days of pesticide exposure (p=0.053, LSD post-hoc test). A lower level of cortisol 417
is generally observed in organisms submitted to an extreme stress (Romero, 2004, 2010). This decrease could 418
be due to pesticide induced endocrine perturbation of the HPI axis function. Studies have shown that fish 419
exposed to chronic chemical stressors such as pesticides display a decreased corticosteroid response to a 420
second (Cericato et al., 2008, 2009; Bisson and Hontela, 2002; Nascimento et al., 2012; Koakoski et al., 2014). 421
This inhibition could be linked to a toxic effect of pesticides, including tebuconazole, on interrenal cells or a 422
regulation of the activity of the HPI axis at the level of the hypothalamus or pituitary (Koakoski et al., 2014; 423
Zhang et al. 2015). Endocrine disruption of the synthesis of steroid hormones, i.e. cortisol and/or sex 424
hormones can have important consequences on the fitness and survival of fish, affecting physiological traits 425
and behaviors associated with stress adaptation and reproduction (Ankley et al., 2002). 426
4.2.2 Antioxydant responses to combined stressors 427
Surprisingly, all defense systems and metabolic responses observed in response to individual stresses 428
were inhibited in fish exposed to multiple stressors at early time. The PEST*TEMP exposed fish showed no 429
response of CAT, GST, glutathione, glutamine, taurine, choline and phosphorylcholine at T6 h. Moreover, CAT 430
and SOD activities were reduced compared to control fish at T96 h. Similar patterns of reciprocal inactivation 431
of defense systems were shown in Pimephales promelas exposed to copper and heat shock (Lapointe et al., 432
Version postprint
M
AN
US
CR
IP
T
AC
CE
PT
ED
ACCEPTED MANUSCRIPT
2011). Moreover, it is well established that ROS (e.g. superoxide) oxidizes non enzymatic antioxidant defenses 433
and inactivates several enzymes including CAT (see a review in Valavanidis et al., 2006). Inhibition of the stress 434
defenses may indicate an overproduction of ROS under combined chemical and thermal stresses which 435
exceeded the antioxidant capacity of the cells. Inhibition of defense system reflects an antagonistic effect of 436
thermal and chemical stressors on the overall stress response. Interestingly, CAT and SOD activity increased 437
significantly at T16 d while other responses were still shut down. This delayed response emphasizes the 438
adverse effect of chemical and thermal induced oxidative stress on cellular components, with increased risk of 439
cell and tissue injuries. 440
4.2.3 Metabolic responses to combined stressors 441
At the molecular level, a decrease in the concentration of a large number of metabolites indicates a 442
significant disturbance of amino acid metabolism, energy production and defense against oxidative stress. In 443
the PEST*TEMP group, the metabolic responses to individual stressors measured at T6 h disappeared, 444
including the responses observed at the molecular, cellular and tissue levels. In particular, the ETS activity in 445
both liver and muscle decreased compared to the PEST and TEMP groups. The decreased ETS activity under 446
combined stressors could result from (1) perturbations in the normal function of the ETS or (2) a decreased 447
mitochondrial densities in cells (Lannig et al., 2006; Sokolova and Lannig, 2008; Lavergne et al., 2015). In 448
ectothermic species, mitochondrial plasticity plays a critical role in the metabolic response to environmental 449
stressors (Strobel et al., 2013). The incapacity of fish to maintain an elevated energy production under multiple 450
stress exposures could explain the absence of induction of the defense system observed at T6 h. 451
Consequently, it could potentiate oxidative damages on cellular components, including proteins. The creatine 452
phosphocreatine system plays a critical role in cellular energy metabolism (Sun et al., 2012; Wang et al., 2017). 453
Thus, the decreased creatine, found under combined exposure stressors at T16 d strengthens the perturbation 454
of energy metabolism which is consistent with the above conclusion. 455
PEST*TEMP exposed fish showed significant decreases in amino-acids levels as soon as T6 h, with 456
reduced levels of proline and lysine. At T16 d, reduced concentrations were found for isoleucine, leucine, 457
valine, alanine, proline, lysine, glutamate, glutamine, creatine and taurine, indicating an important 458
perturbation of amino-acid metabolism and/or oxidative damages on proteins. 459
4.2.4 Physiological responses to combined stressors 460
At the tissue level, the increase in HSI and the deposition of lipids in the muscles also indicate 461
disturbances in energy metabolism, sequestration of pesticides in lipid vacuoles and / or tissue damage. 462
Finally, a significant decrease in the overall condition of the fish (FCF) is visible at T16 d. When fish are 463
subjected to both combined stressors, the general stress response is inhibited, at least initially, with significant 464
individual-level effects on overall fish health. Given that the stress response is fundamental in enabling 465
organisms to acclimate to changes in their environment, its inhibition under multiple stressors seems to have 466
Version postprint
M
AN
US
CR
IP
T
AC
CE
PT
ED
ACCEPTED MANUSCRIPT
important consequences on fitness and fish performance affecting physiological traits and behavioral 467
responses related to stress adaptation and reproduction (Pankhurst and Van Der Kraak, 2011). 468
469
5.
Conclusion
470
Taken together, these results indicate that (1) single thermal and chemical stressors lead to a general 471
stress response and a metabolic compensation strategy, i.e. the set-up of a coordinated stress response and 472
depletion of energetic reserves limiting adverse effects at higher biological levels. The lack of effect on the 473
general condition of the fish (i.e. tertiary response) suggests that the stress response set up is adapted and 474
effective. However, (2) the patterns of metabolic response and defensive systems strongly depended on the 475
nature of the stress (thermal vs. chemical). Finally, (3) fish were unable to establish an effective stress 476
response when chemical and thermal stressors were combined, with deleterious effects at the individual level. 477
Exposure to combined chemical and thermal stressors disrupts the stress response and results in a decrease in 478
the overall condition of the fish, indicating a synergistic effect of temperature and pesticide mixture on 479
goldfish. These results also outline the central role of metabolism in these stress responses. The decrease in 480
cellular energy metabolism when the two stresses are combined is consistent with the shift from a 481
compensation strategy to a metabolic conservation strategy (Sokolova et al., 2013). In other words, exposure 482
to a combination of stressors might exceed the metabolic capacity of the fish, leading to an early inhibition of 483
the stress response (lower level of cortisol, antioxydant defenses, and lower depletion of energy reserves) with 484
potential high deleterious effects at the individual level. 485
To our knowledge this study is the first to evaluate the combined effects on the fish stress response of 486
temperature warming and water contamination by pesticide mixtures with an integrated molecule- individual 487
scale. The combined analysis of omic approaches, here metabolomics, and more conventional biochemical 488
approaches seems to be a powerful way to evaluate the response of organisms undergoing multiple stresses. 489
Future studies should now consider different combinations of stressors and evaluate their effects on 490
individuals across biological levels, from the molecules to the whole individual, while taking into account the 491
inter-individual variability of sensitivity. Because global changes are exposing organisms to a combination of 492
stressors at the same time, this will help understanding and predicting the responses of natural populations to 493
actual and future stresses. 494
495
Acknowledgments
496
The authors wish to thank Dr Lisa Jacquin for helpful comments and corrections on an earlier draft. 497
This work has been carried out as a part of “ADAPT’EAU” (ANR-11-CEPL-008), a project supported by the 498
French National Research Agency (ANR) within the framework of “The Global Environmental Changes and 499
Version postprint
M
AN
US
CR
IP
T
AC
CE
PT
ED
ACCEPTED MANUSCRIPT
Societies (GEC&S) program”. AG was supported by a doctoral grant of the French Ministry of Higher Education 500
and Research. The authors confirm no conflict of interest. 501
References
502
Alim’agri, 2012. Agriculture, Agri-food and Forest data. French Ministry of Agriculture, Agro-food and 503
Forest report. [WWW Document]. URL http://agriculture.gouv.fr/ministere/alimagri-chiffres-cles-2012 504
Ankley, G.T., Kahl, M.D., Jensen, K.M., Hornung, M.W., Korte, J.J., Makynen, E.A., Leino, R.L., 2002. 505
Evaluation of the Aromatase Inhibitor Fadrozole in a Short-Term Reproduction Assay with the Fathead Minnow 506
(Pimephales promelas). Toxicol. Sci. 67, 121–130. doi:10.1093/toxsci/67.1.121 507
Arnold, H., Pluta, H.-J., Braunbeck, T., 1995. Simultaneous exposure of fish to endosulfan and 508
disulfoton in vivo: ultrastructural, stereological and biochemical reactions in hepatocytes of male rainbow 509
trout (Oncorhynchus mykiss). Aquat. Toxicol. 33, 17–43. doi:10.1016/0166-445X(95)00006-P 510
Auperin, B., Geslin, M., 2008. Plasma cortisol response to stress in juvenile rainbow trout is influenced 511
by their life history during early development and by egg cortisol content. Gen. Comp. Endocrinol. 158, 234– 512
239. doi:10.1016/j.ygcen.2008.07.002 513
Babo, S., Vasseur, P., 1992. In vitro effects of Thiram on liver antioxidant enzyme activities of rainbow 514
trout (Oncorhynchus mykiss). Aquat. Toxicol. 22, 61–68. doi:http://dx.doi.org/10.1016/0166-445X(92)90036-M 515
Bacchetta, C., Rossi, A., Ale, A., Campana, M., Parma, M.J., Cazenave, J., 2014. Combined toxicological 516
effects of pesticides: A fish multi-biomarker approach. Ecol. Indic. 36, 532–538. 517
doi:10.1016/j.ecolind.2013.09.016 518
Barton, B.A., 2002. Stress in fishes: a diversity of responses with particular reference to changes in 519
circulating corticosteroids. Integr. Comp. Biol. 42, 517–525. doi:10.1093/icb/42.3.517 520
Baudiffier, D., 2012. Modes de perturbation de la stéroïdogenèse testiculaire et de la spermatogenèse 521
chez le poisson zèbre (Danio rerio) par des fongicides azolés. Université Rennes 1. 522
Beckwith-Hall, B.M., Brindle, J.T., Barton, R.H., Coen, M., Holmes, E., Nicholson, J.K., Antti, H., 2002. 523
Application of orthogonal signal correction to minimise the effects of physical and biological variation in high 524
resolution 1H NMR spectra of biofluids. Analyst 127, 1283–1288. doi:10.1039/b205128c 525
Biagianti-Risbourg, S., Bastide, J., 1995. Hepatic perturbations induced by a herbicide (atrazine) in 526
juvenile grey mullet Liza ramada (Mugilidae, Teleostei): an ultrastructural study. Aquat. Toxicol. 31, 217–229. 527
doi:10.1016/0166-445x(94)00065-x 528
Bisson, M., Hontela, A., 2002. Cytotoxic and endocrine-disrupting potential of atrazine, diazinon, 529
endosulfan, and mancozeb in adrenocortical steroidogenic cells of rainbow trout exposed in vitro. Toxicol. 530
Appl. Pharmacol. 180, 110–117. doi:10.1006/taap.2002.9377 531
Version postprint
M
AN
US
CR
IP
T
AC
CE
PT
ED
ACCEPTED MANUSCRIPT
Blahová, J., Plhalová, L., Hostovský, M., Divišová, L., Dobšíková, R., Mikulíková, I., Štěpánová, S., 532
Svobodová, Z., 2013. Oxidative stress responses in zebrafish Danio rerio after subchronic exposure to atrazine. 533
Food Chem. Toxicol. 61, 82–85. doi:10.1016/j.fct.2013.02.041 534
Bonnefoy, N., 2012. Information Report on Behalf of the Joint Mission of Information on Pesticides and 535
Their Impact on Health and the Environment. Report of the French Senate (in French). Paris, France. 536
Bradford, M.M., 1976. A rapid and sensitive method for the quantitation of microgram quantities of 537
protein utilizing the principle of protein-dye binding. Anal. Biochem. 72, 248–254. 538
doi:http://dx.doi.org/10.1016/0003-2697(76)90527-3 539
Butault, J.-P., Dedryver, C.-A., Gary, C., Guichard, L., Jacquet, F., Meynard, J.-M., Nicot, P., Pitra, M., 540
Reau, R., Sauphanor, B., Savini, I., Volay, T., 2010. Ecophyto R&D: What Ways to Reduce the Use of Pesticides? 541
Summary of the study report (in French). France. 542
Calow, P., 1991. Physiological costs of combating chemical toxicants: Ecological implications. Comp. 543
Biochem. Phys. C. 100, 3–6. doi:10.1016/0742-8413(91)90110-F 544
Cericato, L., Neto, J.G.M., Fagundes, M., Kreutz, L.C., Quevedo, R.M., Finco, J., da Rosa, J.G.S., Koakoski, 545
G., Centenaro, L., Pottker, E., Anziliero, D., Barcellos, L.J.G., 2008. Cortisol response to acute stress in jundiá 546
Rhamdia quelen acutely exposed to sub-lethal concentrations of agrichemicals. Comp. Biochem. Phys. C. 148,
547
281–286. doi:10.1016/j.cbpc.2008.06.008 548
Cericato, L., Neto, J.G.M., Kreutz, L.C., Quevedo, R.M., da Rosa, J.G.S., Koakoski, G., Centenaro, L., 549
Pottker, E., Marqueze, A., Barcellos, L.J.G., 2009. Responsiveness of the interrenal tissue of Jundiá (Rhamdia 550
quelen) to an in vivo ACTH test following acute exposure to sublethal concentrations of agrichemicals. Comp.
551
Biochem. Phys. C. 149, 363–7. doi:10.1016/j.cbpc.2008.09.002 552
Chellappa, S., Huntingford, F.A., Strang, R.H.C., Thomson, R.Y., 1995. Condition factor and 553
hepatosomatic index as estimates of energy status in male three-spined stickleback. J. Fish Biol. 47, 775–787. 554
doi:10.1111/j.1095-8649.1995.tb06002.x 555
Cui, Y., Liu, B., Xie, J., Xu, P., Habte-Tsion, H.M., Zhang, Y., 2014. Effect of heat stress and recovery on 556
viability, oxidative damage, and heat shock protein expression in hepatic cells of grass carp 557
(Ctenopharyngodon idellus). Fish Physiol. Biochem. 40, 721–729. doi:10.1007/s10695-013-9879-2 558
DeBerardinis, R.J., Cheng, T., 2010. Q’s next: the diverse functions of glutamine in metabolism, cell 559
biology and cancer. Oncogene 29, 313–24. doi:10.1038/onc.2009.358 560
De Coen, W. M. and Janssen, C. R. 1997. The use of biomarkers in Daphnia magna toxicity testing. IV. 561
Cellular Energy Allocation: A new methodology to assess the energy budget of toxicant-stressed Daphnia 562
populations. J. Aquat. Ecosyst. Stress Recovery.6, 43–55. 563
Version postprint
M
AN
US
CR
IP
T
AC
CE
PT
ED
ACCEPTED MANUSCRIPT
Désautés, C., Bidanel, J.P., Mormède P. 1997. Genetic Study of Behavioral and Pituitary-Adrenocortical 564
Reactivity in Response to an Environmental Challenge in Pigs. Physiol. Behav. 62,337-345. 565
Fernandez-Gomez, F.J., Galindo, M.F., Gómez-Lázaro, M., Yuste, V.J., Comella, J.X., Aguirre, N., Jordán, 566
J., 2005. Malonate induces cell death via mitochondrial potential collapse and delayed swelling through an 567
ROS-dependent pathway.Brit. J. Pharmacol. 144, 528–37. doi:10.1038/sj.bjp.0706069 568
Fernandino, J.I., Hattori, R.S., Moreno Acosta, O.D., Strüssmann, C.A., Somoza, G.M., 2013. 569
Environmental stress-induced testis differentiation: Androgen as a by-product of cortisol inactivation. Gen. 570
Comp. Endorc. 192, 36–44. doi:10.1016/j.ygcen.2013.05.024 571
Ferrando, M.D., Andreu-Moliner, E., Almar, M.M., Cebrian, C., Nuñez, a., 1987. Acute toxicity of 572
organochlorined pesticides to the European eel, Anguilla anguilla: The dependency on exposure time and 573
temperature. B. Environ. Contam. Tox. 39, 365–369. doi:10.1007/BF01688297 574
Ferreira, N.G.C., Morgado, R., Santos, M.J.G., Soares, A.M.V.M., Loureiro, S., 2015. Biomarkers and 575
energy reserves in the isopod Porcellionides pruinosus: The effects of long-term exposure to dimethoate. Sci. 576
Total Environ. 502, 91–102. doi:10.1016/j.scitotenv.2014.08.062 577
Gagné, F., Blaise, C., André, C., Salazar, M., 2006. Effects of pharmaceutical products and municipal 578
wastewaters on temperature-dependent mitochondrial electron transport activity in Elliptio complanata 579
mussels. Comp. Biochem. Physiol. C. 143, 388–393. doi:10.1016/j.cbpc.2006.04.013 580
Gagné, F., Blaise, C., André, C., Pellerin, J., 2007. Implication of site quality on mitochondrial electron 581
transport activity and its interaction with temperature in feral Mya arenaria clams from the Saguenay Fjord. 582
Environ. Res. 103, 238–246. doi:10.1016/j.envres.2006.05.006 583
Gandar, A., Jean, S., Canal, J., Marty-Gasset, N., Gilbert, F., Laffaille, P., 2015. Multistress effects on 584
behavior and physiology of Carassius auratus. Environ. Sci. Pollut. R. 3, 3323–3331. doi:10.1007/s12192-010-585
0223-9 586
Gandar, A., Laffaille, P., Marty-Gasset, N., Viala, D., Molette, C., Jean, S. 2017. Proteome response of 587
fish under multiple stress exposure: Effects of pesticide mixtures and temperature increase. Aquat Toxicol. 588
184, 61-77. doi: 10.1016/j.aquatox.2017.01.004 589
Gamain, P., Gonzalez, P., Cachot. J., Pardon, P., Tapie, N., Gourves, P.Y., Budzinski. H., Morin, B., 2016. 590
Combined effects of pollutants and salinity on embryo-larval development of the Pacific oyster, Crassostrea 591
gigas. Mar. Environ. Res., 113, 31-38. doi: 10.1016/j.marenvres.2015.11.002
592
Gluth, G., Hanke, W., 1984. A comparison of physiological changes in Carp, Cyprinus carpio, induced by 593
several pollutants at sublethal concentration - II. The dependency on the temperature. Comp. Biochem. 594
Physiol. C. 79, 39–45. doi:10.1016/0742-8413(84)90160-9 595
Version postprint
M
AN
US
CR
IP
T
AC
CE
PT
ED
ACCEPTED MANUSCRIPT
Gorbi, S., Baldini, C., Regoli, F., 2005. Seasonal variability of metallothioneins, cytochrome P450, bile 596
metabolites and oxyradical metabolism in the European eel Anguilla anguilla L. (Anguillidae) and striped 597
mullet Mugil cephalus L. (Mugilidae). Arch. Environ. Con. Tox. 49, 62–70. doi:10.1007/s00244-004-0150-9 598
Guardiola, F.A., Gónzalez-Párraga, P., Meseguer, J., Cuesta, A., Esteban, M.A., 2014. Modulatory effects 599
of deltamethrin-exposure on the immune status, metabolism and oxidative stress in gilthead seabream 600
(Sparus aurata L.). Fish. Shellfish. Immun. 36, 120–9. doi:10.1016/j.fsi.2013.10.020 601
Guilherme, S., Gaivão, I., Santos, M.A., Pacheco, M., 2012. DNA damage in fish (Anguilla anguilla) 602
exposed to a glyphosate-based herbicide – Elucidation of organ-specificity and the role of oxidative stress. 603
Mutat. Res-Gen Tox. En. 743, 1–9. doi:10.1016/j.mrgentox.2011.10.017 604
Habig, W.H., Pabst, M.J., Jakoby, W.B., 1974. Glutathione S-Transferases. The fist enzymatic step in 605
mercapturic acid formation. J. Biol. Chem. 249, 7130–7139. 606
Handy, R.D., Sims, D.W., Giles, A., Campbell, H. A., Musonda, M.M., 1999. Metabolic trade-off between 607
locomotion and detoxification for maintenance of blood chemistry and growth parameters by rainbow trout 608
(Oncorhynchus mykiss) during chronic dietary exposure to copper. Aquat. Toxicol. 47, 23–41. 609
doi:10.1016/S0166-445X(99)00004-1 610
Hashim, E.F., Zaki, M.S., 2005. Assessment of the hazardous effect of fungicide Dithane on Clarias 611
lazera (catfish) including haematological, biochemical, and immunological parameters. Arab Univ. J. Agric. Sci.
612
13, 1005–1018. 613
Hayes, T.B., Case, P., Chui, S., Chung, D., Haeffele, C., Haston, K., Lee, M., Mai, V.P., Marjuoa, Y., Parker, 614
J., Tsui, M., 2006. Pesticide mixtures, endocrine disruption, and amphibian declines: Are we underestimating 615
the impact? Environ. Health Persp. 114, 40–50. doi:10.1289/ehp.8051 616
Holmstrup, M., Bindesbøl, A.M., Oostingh, G.J., Duschl, A., Scheil, V., Köhler, H.R., Loureiro, S., Soares, 617
A.M.V.M., Ferreira, A.L.G., Kienle, C., Gerhardt, A., Laskowski, R., Kramarz, P.E., Bayley, M., Svendsen, C., 618
Spurgeon, D.J., 2010. Interactions between effects of environmental chemicals and natural stressors: A review. 619
Sci. Total Environ. 408, 3746–3762. doi:10.1016/j.scitotenv.2009.10.067 620
Hontela, A., 1997. Endocrine and physiological responses of fish to xenobiotics: Role of 621
glucocorticosteroid hormones. Rev. Toxicol. 1, 1–46. 622
Jin, Y., Zhang, X., Shu, L., Chen, L., Sun, L., Qian, H., Liu, W., Fu, Z., 2010. Oxidative stress response and 623
gene expression with atrazine exposure in adult female zebrafish (Danio rerio). Chemosphere 78, 846–852. 624
doi:10.1016/j.chemosphere.2009.11.044 625
Jorgensen, C.B., 1988. Metabolic costs of growth and maintenance in the toad, Bufo bufo. J. Exp. Biol. 626
138, 319–331. 627