HAL Id: hal-02411508
https://hal.archives-ouvertes.fr/hal-02411508
Submitted on 14 Dec 2019
HAL is a multi-disciplinary open access archive for the deposit and dissemination of sci-entific research documents, whether they are pub-lished or not. The documents may come from teaching and research institutions in France or
L’archive ouverte pluridisciplinaire HAL, est destinée au dépôt et à la diffusion de documents scientifiques de niveau recherche, publiés ou non, émanant des établissements d’enseignement et de recherche français ou étrangers, des laboratoires
For Sustainable Reinforcements of Infrastructures with
Coated Glass Fiber Grids
Daniel Doligez, Cyrille Chazalon, Hervé Pelletier, Eric Godard, Pierre
Hornych, Mai Lan Nguyen, Armelle Chabot, Laurence Lumiere, Maissa
Gharbi
To cite this version:
Daniel Doligez, Cyrille Chazalon, Hervé Pelletier, Eric Godard, Pierre Hornych, et al.. For Sustainable Reinforcements of Infrastructures with Coated Glass Fiber Grids. XXVIe Congrès mondial de la Route (http://piarcabudhabi2019.org), Oct 2019, Abou Dhabi, United Arab Emirates. �hal-02411508�
1
FOR SUSTAINABLE REINFORCEMENTS OF INFRASTRUCTURES WITH COATED GLASS FIBER GRIDS
D. Doligez 6D Solutions, France daniel.doligez@6d-solutions.com
C. Chazalon, H.Pelletier ICUBE/INSA Strasbourg, France
cyrille.chazallon@insa-strasbourg.fr; herve.pelletier@insa-strasbourg.fr E. Godard
Colas, France
eric.godard@campus.colas.fr
P. Hornych , M. L. Nguyen, A.Chabot, L. Lumiere, M. Gharbi IFSTTAR, France
pierre.hornych@ifsttar.fr ; mai-lan.nguyen@ifsttar.fr ; armelle.chabot@ifsttar.fr;
laurence.lumiere@ifsttar.fr maissa.gharbi@ifsttar.fr
Key words: Reinforcement, fatigue, damage, bond, recycling.
ACKNOWLEDGEMENT: The work presented in this paper was sponsored by the French National Research Agency (ANR - SolDuGri project ANR-14-CE22-0019).
SUMMARY
The road maintenance is a shared subject of concern worldwide and needs a substantial investment. The use of glass fiber grids, for the reinforcement of bituminous pavements and the fight against the rise of cracks, is a solution used successfully and in full development for which more and more examples show very good performance after monitoring roads for many years.
The SolDuGri ANR project brings together French companies, Colas, 6D Solutions and Epsilon and public researchers ICUBE/INSA, ICS, the French state laboratory IFSTTAR in order to contribute to the optimization of the choice and the use of these grids for a better efficiency.
This article presents the outline of the project and the first results obtained which consist in the study and the modelling of:
- The in situ damage of the grids. The mechanical properties (monotonic, elastic modulus, fatigue) of the grids, from a full scale test section, have been studied.
- The effect of their presence on the bonding with the asphalt layers. Different tests characterizing the bonding and crack propagation at the interface have been developed. - The IFSTTAR fatigue test track. A full scale test with 6 different sections of grid-reinforced pavement and its modelling have been performed and modelled. Beside these tests, 4 points bending fatigue tests are launched to compare their results with the fatigue test track ones.
- The recycling possibilities and the environmental influences of such products. Life cycle assessment analyses have been performed and compared to asphalt concrete based solution.
All these results will help these partners to propose recommendations for a better use of glass fiber grids and a design criterion of geogrid-reinforced pavement.
INTRODUCTION
A quick feedback of 5 reinforced roads presented during RILEM 1996 will be made, as well as a road officially monitored for 20 years in France. From these accurate examples which show the efficiency of such maintained roads, the working group has been able to determine the main elements to work on. Each chapter of this paper will show the works done and the first results.
Thus, the following topics will be addressed: the strength against damage during installation, especially during traffic and during compaction; the effects of the grids on the interlayer bond quality; tests on the fatigue test track of IFSTTAR Nantes with the study of six sections with four different reinforcing grids, their modelization into the asphalt structure. These materials can be recycled. The results of this last work and also their environmental contribution will be covered later. The final aim is to be able to propose a design method, which will be in fine adapted for each tested grid.
THE OLD WORKS
The behavior of the six presented roads was monitored for 20 years and more.
The details of these roads were explained during the RILEM Congress 1996 [1], RGRA n°713 [2] and in RGRA n°923 from 2014 [3]. A simple photo report demonstrates the interest of such a process, at that time empirically used.
a b c d
Figure 1- Bus way, Vaxjö, Sweden [1] Figure 2- RN 139, Port la Nouvelle, France [1] Road before works: a in 1992, c in 1993 – 22 years later: b and d
a b c d
Figure 3 - RD1015, Bouttencourt, France [2]. Figure 4 - Av. G. Eiffel, Narbonne, France [1] Road during works: a in 1993, c in 1994 – 22 years later: b and d
Rue A. Catel, Amiens in France, 1994 [1]. The road was designed for 15 years. In 2015, 21 years later, around 20% of the road is cracked and around 100m have been rebuilt.
RD624 at Castelnaudary in France, 1998 [3]. The behavior after 15 years, of 10cm base course and 6cm overlay is similar to 2cm regulating layer, the grid and the same overlay of 6cm.
3
1. SOLDUGRI PROJECT
From all these roads monitored for 15 to 25 years, we consider that the reinforcing capacity of some coated glass fiber grids is proved, and this reinforcing process imposes itself as a relevant and durable solution, saving significant amounts of materials compared to traditional solutions. Today the use of these products is empirical and cannot be significantly used due to a lack of method with a widely accepted consensus on the mechanical characterization of these complexes for design. And this is the same for the intrinsic characterization of the glass fiber grids which are summarily and unsuitable for this use.
The aim of this project is to develop a more rational and a more mechanical approach to evaluate the grids and to design such reinforced roads. These include blowing up three locks, which represent a brake to this technic:
- For a better understanding of the stress applied to the grids during installation, especially when there is traffic and compaction on the above layers;
- To study the mechanical behavior of the interlayers of the reinforced layer to their support;
- To improve the lifespan forecast of the reinforced roads by the study and the modelization of the fatigue properties of the grids, of the reinforced asphalt, of the interlayers…
This program is co-financed by « l’Agence National de la Recherche » of France. It contributes to the research of durable solutions for the building, reinforcement and maintenance of road infrastructures, and more precisely the ones which are built with 100% asphalt mix [5].
In order to determine and to select the efficient grids, two main behavior factors are under study performing tests in situ and in laboratory: the damage during installation and the bond quality of the interlayer with the reinforcement. Then, in order to estimate the structural improvement, a life size test at the fatigue test track of IFSTTAR in Nantes has been launched. It has especially compared three grids with the same mechanical strength G3, G4, G5, with one being referenced because used for more than 10 years (G3), and two other grids with less mechanical strength (G1, G2), G1 being also a reference (table 1), because used in such roads as explained in the first paragraph “old works”. The behavior at 1.5 million loads was checked for each section. Some grids were tested in fatigue according to EN 12697-24 in alternate 4 point bending. We shall try to correlate the test track result to the standard ones. Then the environmental issues were taken in consideration, taking care of the recycling capacity, the life cycle analysis, the release of particles when milled. This last part will be presented at a later publication.
All these tests are done in several laboratories:
- The INSA Strasbourg for the characterization of the mechanical properties of all the grids before and after damage, the numerical topographic study on the damaged glass fiber yarns reproducing in laboratory, by tribology of puncture and of stripe of the damages as seen with the in situ tests. The power in the modelization will also be used by Insa. - The IFSTTAR Nantes for the production of the test sections according to the damage tests, for the interlayer studies according to the PhD dissertation of M. Gharbi, and for the reel size onto the fatigue test track in order to compare and to modelize the behavior of the different grids in reel size.
‐ The COLAS for the characterization of the asphalt mix, the laboratory studies for the interlayer bond, the damage during implementation.
‐ The 6D SOLUTIONS for the grid production into various configurations.
All the tests, from the fatigue carrousel, to the track for damage and the track for interlayer bond tests and the 4 point bending tests are made with the same semi-course asphalt, class 3, made with the same formula, same aggregates batch of Bréfauchet at Chéméré and the same bitumen 35/50 batch of Donges.
The grids tested in this project are as indicated in table 1. The resins used do not melt whatever the temperature.
Stiffer resin G1 G3
Softer resin G2 G4 G5
Table 1 – The grids sed and their relative stiffness
2. DAMAGE DURING IMPLEMENTATION
A question which can disturb the users of these reinforcement products is to note that some products are destroyed by the works lorries traffic, especially when the surface is planned. We have therefore checked this item setting up several protocols. Thus we highlighted the damage of the grids due to traffic, and also due to compaction.
2.1. LABORATORY TEST TO SIMULATE TRAFFIC, RGRA n°944, 949, 2017 [4] [5]
The grids are applied on to a smooth surface with a tape. To simulate the traffic onto the grids on the work site, 250 come and go of a wheel loaded at 6 metric tons have been applied (500 loads). The loss of mechanical strength was measured.
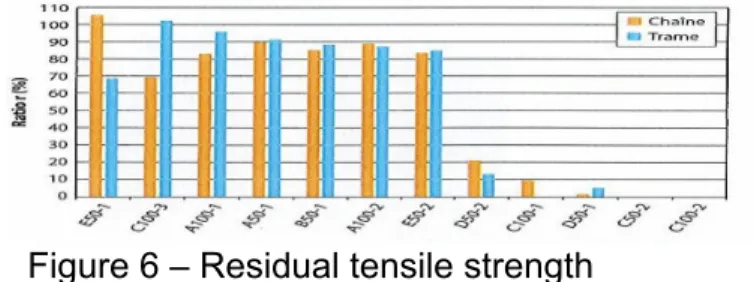
Figure 5 - traffic onto the grid Figure 6 – Residual tensile strength
Results: The 7 tested grids impregnated with a resin or bitumen kept between 70 to 100% of their mechanical strength, when the 5 unprotected grids kept less than 20% of their initial strength (figure 6).
2.2. LABORATORY TESTS FOR COMPACTION SIMULATION
A work was done by an Ad Hoc working group of the CEN TC189 and taken into this study. A paraffinic oil was used to substitute the bitumen with the same viscosity during compaction. No tack coat was applied and the asphalt production is done at ambient temperature.
5
Figure 7 - Compaction Figure 8 - grid release Figure 9 - Punctures
The results obtained [5] on the mechanical strength after damage by compaction are indicated in figure 10. Two compaction processes have been compared with the grid G1. The results with the MLPC (Matériel des Laboratoires des Ponts et Chaussées) slab compactor is less aggressive than the Cooper steel roller type: the losses of mechanical strength are respectively 16 and 34%. That can be explained by the aggregate’s movements during compaction: it has been seen that they are circular and small with the tire, when they are straight and long with the cylinder which generates more damage. We can also identify the temperature effect for example with the G1 grid. With the cylinder compaction and the same asphalt mix, one at hot temperature, the other one with the cold paraffinic oil, the loss of strength is only 31% with the tire with the paraffinic oil and 62% with the warm asphalt. But in this last situation, the release of the grid must be considered; bonding with the asphalt makes it difficult to remove without damage. Even if the resins used to coat the glass fiber do not melt, the temperature could affect them. On the other hand, the tack coat can be a favorable element for the behavior of the grid by the bond to its support with less aggregates movements. As expected the coating plays a major role in the resistance to grid damage. G8 and G9, the uncoated grids of this trail campaign show a lot lower resistance than the other grids: the residual mechanical strength at break are 36% and 27% respectively, when all the coated grids get a mean of 68%, with differences between the coated grid. The coating seems to be an essential element to consider for the resistance against damage. The differences between all the coated grids may also be explained by the type of coating, but others parameters such as the shape of the yarns or the grid’s assembly method, not studied here, can be considered. It explains why G1 and G3 grids, coated with the same stiff resin, present similar residual tensile strength (66 and 69% respectively), but not G2 and G4 grids (82 and 56%), even though they are coated with the same soft resin (figure 10).
Figure 10 – Residual tensile strength at break of cross direction yarns after laboratory compaction, compared with tensile strength of virgin yarns.
The values of the residual stiffness modulus are plotted on figure 11. The tests were performed using a local extensometer. We observe that the losses of stiffness modulus of coated grids are limited (from 3 to 14%), whatever the considered test. It suggests that, even if the tensile strength of coated grids may be lowered by the compaction process, their mechanical properties remain nearly identical. Thus, it can be assumed that their structural contribution to the pavement reinforcement is not affected by installation damage. It is not the case for uncoated grids: the values of residual stiffness modulus of grids G8 and G9 are only 71 and 55%, which is very low compared to coated grids. They seem to have suffered major deteriorations which lowered their properties: it raises serious doubts about their on-site effectiveness.
0 10 20 30 40 50 60 70 80 90 100 G1 G2 G3 G4 G5 G6 G7 G8 G9 Residual tensile strength (%)
Résistances mécaniques résiduelles à la rupture
Simulated AC/MLPC slab compactor CD (simulated AC/Cooper steel roller) HMA/Cooper steel roller
Figure 11 - Residual stiffness modulus after laboratory compaction tests, compared with stiffness modulus of virgin yarns.
2.3. IN SITU TRAFFIC AND COMPACTION SIMULATION TEST
A test section has been built with two support layers, one soft with a new asphalt layer (A), the other one planned (B). Several grids have been laid down where the lorry has run onto it and then the paving machine. Then were applied 50mm semi-corse asphalt, compacted, cooled, and again 50mm of the same asphalt (figure 12). Compaction was done with a cylinder. The grids were protected with an aluminum foil, to avoid impregnation by the tack coat, at specified areas in order to have them cleaned where the dynamometer jaws will be placed, dark parts figure 13 [5] [6] [7].
Figure 12 – Track scheme construction Figure 13 – Asphalt application
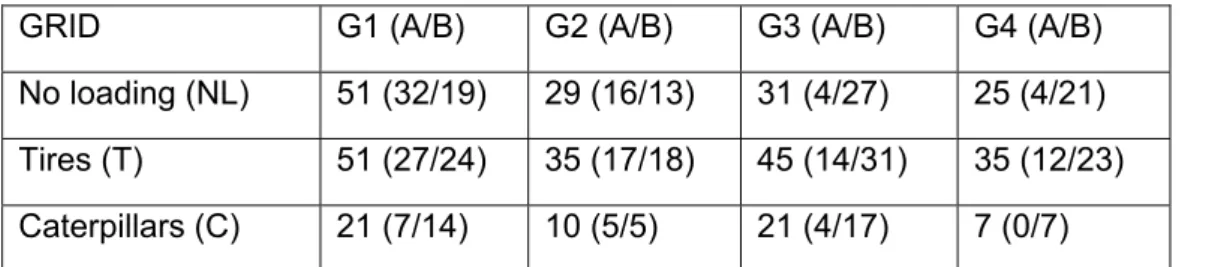
After several weeks, asphalt slabs have been sawn and each block was then placed inside a large oven, and heated to 40 °C to remove the grid. Although great care was taken for the recovering of the geogrid sections, 100% of the yarns could not be recovered properly without any damage, due to the strong bond between the geogrids and the asphalt concrete layers. In this case, they have not been tested. In total, 32 grid sections were placed in the test section, and could be recovered; 24 have been tested till now. Each section was trafficked on more than 50% of its surface by the wheels or the caterpillars of the finisher. This means that for the tension tests, slightly less than 50% of the yarns had been damaged only by the compaction, and a little more than 50% by both compaction and trafficking by the caterpillars or the wheels. During recovery, the loading received by each grid was carefully identified (see table 2), and three different loading processes were distinguished:
‐ The grids submitted only to compaction (no loading - NL).
‐ The grids submitted to compaction and to loading by the wheels (tire -T).
‐ The grids submitted to compaction and loading by the finisher’s caterpillars (C). Due to the narrow asphalt layers, a small finisher with an overall width of the caterpillars of 1.5m was used. 0 10 20 30 40 50 60 70 80 90 100 G1 G2 G3 G4 G5 G6 G7 G8 G9 Residual siffness modulus (%)
Modules de rigidité résiduels Simulated AC/MLPC slab compactor CD (simulated AC/Cooper steel roller) HMA/Cooper steel roller
Existing subgrade (>100 MPa) Levelled SCAC layer ‐ 5 to 7 cm
1stSCAC layer ‐ 5 cm 2ndSCAC layer ‐ 5 cm 3rdSCAC layer ‐ 5 cm
4thSCAC layer ‐ 5 cm Tack coat (300g/m² residual)
Tack coat (300g/m² residual)
Tack coat (300g/m² residual) Tack coat (500 g/m² residual) Geogrid
7
GRID G1 (A/B) G2 (A/B) G3 (A/B) G4 (A/B)
No loading (NL) 51 (32/19) 29 (16/13) 31 (4/27) 25 (4/21) Tires (T) 51 (27/24) 35 (17/18) 45 (14/31) 35 (12/23) Caterpillars (C) 21 (7/14) 10 (5/5) 21 (4/17) 7 (0/7)
Table 2 - Number of yarns tested, per loading type and per support type (A/B).
Each recovered grid was cut into individual warp yarns, which were submitted to tension tests. The yarn samples were about 29 centimeters long, and were tested at 20°C. For each yarn, the average stiffness modulus was determined, by performing 3 load cycles, in the small strain range, between 100N and 400N for grids G1 and G2, and between 100N and 1000N for grids G3 and G4. The same tests have also been performed on new grids, coming from the manufacturer, for comparison [6] [7].
3.3.1. Tensile tests
Figure 14 compares the average residual tensile strength of each warp yarn type with all loading conditions and considering all types of surface A and B. We can observe that the coefficient of variation is rather large for all grids. Figure 14 shows that for all grids (except G4 and to a lesser extent G2), cumulative loadings have an influence on the residual strength and that the grid which has the softer resin (G2) has a relatively higher residual strength than the stiffer one (G1), the results are reversed for the stiffer ones G4 and G3.
Finally, the warp yarns lying on a milled surface have higher residual tensile strength than on a new surface; we think that the ripples on the milled surface give better protection compared to a new surface. This could be explained by the effect of the tack coat at the interface, which could preferentially fill the hollow grooves made by the milling.
A B
Figure 14 – Residual tensile strength of yarns for a new layer under the grids (A) and for milled surface under the grids (B) submitted to each type of loading,
compared with Non-Loaded residual strength
3.3.2. Stiffness modulus tests
Figure 15 compares the average stiffness modulus, measured with a local extensometer, on each warp yarn type. The results show that the coefficient of variation is also important and that the stiffness modulus is less sensitive to the type of loading than the residual tensile strength (figure 14). The results show that the loss or damage section is always between 0 and 20%. This result proves that the strength loss is caused by multiple impacts on the grids made by aggregates which initiate concentration stress and a little section loss. If we compare the stiffness moduli obtained by extensometer in low stress range, and the secant stiffness modulus at peak, we observe the same tendency with a larger discrepancy of 0 to 30%.
A B
Figure 15: Residual stiffness moduli of yarns for a new layer above the grids (A) and for milled surface above the grids (B) submitted to each type of loading,
compared with Non-Loaded stiffness modulus
Two main difficulties have been noticed during these tests: on one hand, the protection of the end yarns by a thick aluminum foil has probably increased the aggregates movements during compaction, on the other hand the softer grids were stickier and more difficult to extract. This could partially explain the difference between the two resins.
3.4. REPRODUCTION OF IN SITU DAMAGE OF GEOGRIDS
In order to reproduce in laboratory the observed damage of the geogrids recovered after traffic and compaction, the first step was to make an accurate analysis of the topography of the asphalt blocks coming from the track, using a HIROX RH 2000 digital microscope. When carrying out the hot mix asphalt compaction tests (section 3.2), slabs were manufactured and then cut into small 15x15 cm2 surface blocks. The sub-layers of each ½ upper block of asphalt that were in contact with the grid were examined. Spikes were identified and then geometrically characterized: shape, characteristic dimensions such as height, length, angle and opening of edges. Two specific geometries of tips are systematically found for each surface resulting from a bituminous block: conical and V-shaped forms. Two average values can be extracted from FIG. 18 in which the blue, red and green dots represent the experimental values, respectively the forms designed conical and V-shape, an average angle opening of 110° and a tip radius of 0.7mm.
From these two average values were designed and manufactured a large number of conical or V-shaped indentors (45 different geometries), with an opening angle ranging from 90 to 130°, two values of angle of tip radius of 0.1 and 0.7 mm, and for V shapes, edge lengths ranging from 1 mm to 14 mm, as shown in Figure 17. The material used for these indentors is a hard steel Ni-Cr to prevent or limit their plastic deformation during indentation tests.
The objective is to find results corresponding to those found in the first three types of test paragraphs 3.1, 3.2, 3.3. A specific frame was designed in order to stretch the yarns and put them in a climatic chamber, figure 16. Different parameters were tested such as the depth of penetration (40% or 60%), the temperature (25° C or 100° C), the stop length of dihedron, the indentation angle of these dihedron, the vertex angle of conical tips and that for the G1 warp yarns. It is possible to reproduce the drops of mechanical resistances and modules observed in situ, by means of a single indentation for a type of grid yarn. On the other hand, in order to be able to characterize and compare different grids, these tests with deformation or imposed displacement are not the most discriminating ones, and tests making it possible to take into account the indentation depression in relation to the deployed energy are in progress [7].
9
Figure 16 - Equipment Figure 17 – Conic and V shape indentors
Figure 18 – Evolution of the opening angle versus the tip curvature radius
4. BONDING CHARACTERIZATIONS BETWEEN THE GRIDS AND THE
BITUMINOUS LAYERS
Linked to several international and previous works [8][9][10] [11][12][, the characterisation of debonding between layers of the ANR SolDuGri pavements has been studied by Gharbi PHD thesis (2018) [11][12][13][14][15][16]. To this end, the standard Wedge Splitting Test (WST) has been adapted for testing specimens extracted from the field. More than one hundred static fracture tests have been done under water or not in order to get the fracture behaviour, in mode I, of different types of interface with different mesh dimensions of the grids (30mm2 to 40mm2).
4.1. ADAPTED GEOMETRY OF THE WST SPECIMENS EXTRACTED FROM THE FILED TEST SECTION
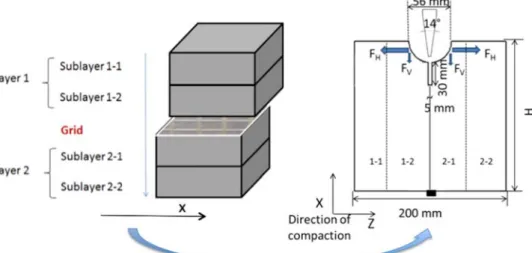
Several field test sections have been finally built in November 2016, using standard road equipment and glass fiber grid installation techniques. In order to extract WST specimens to test in the lab with more than 3 X 3 meshes at the interface and accordingly to the WST standard dimensions, the layer thickness of 100mm in each section has been constructed with two under layers of 50mm (Figure 19). After the construction step, numerous cubic specimens have been extracted from the middle of the test sections, in order to get samples with large interface dimensions in the direction of the compaction (x-axle). Then, the geometry of the WST specimens has been modified with a cylindrical notch (Ø 56mm) so that the transmitted loads of the machine can be applied directly, by means of the slitting wedge (angle of 14°), on the so extracted specimens.
Figure 19 - Layer construction details of the geometry of the WST specimens (after (Gharbi et al., 2017a))
4.2. WST MAIN RESULTS
All the specimens have been tested under a static controlled displacement value of 0.2mm/min and an average ambient temperature mainly controlled at 20°C. Two types of grids have been used: the reference grid of the project (called G3 in the following results) used in the tested section 2 on the carrousel (see the next section), and a new grid (Called G4). By means of Digital Image Correlation (DIC) techniques, the CMOD ( DIC) and the interface crack propagation length have been measured and estimated. From the splitting force (Fs) - Crack Mouth Open Displacement (CMOD) curves of the interface between layers 1 and 2 (Figure 20), tensile strengths, fracture energies and curve end results have been collected for the characterisation of the bituminous interfaces bond without grids comparatively to bituminous interfaces with grids (Figure 21).
Figure 20 –Fs - DIC curves of unreinforced (P8) specimens and reinforced (P7) specimens
with the G4
Similarly to Chabot et al. (2017) and in order to test if water may affect the bond, several tests have been produced under a water bath condition at two different temperatures (around 20°C and 7°C). The main results obtained have shown that :
11
- Due to the dispersion of the inter laminar fracture results that increase under water for unreinforced specimens and reinforced specimens with the standard Grid G3, one of the recommendations given by the RILEM TC 241-MCD (Petit et al., 2018b), to test at least no less than 10 specimens per configuration, is confirmed - The debonding initiation in mode I between any glass fibre grids of the project and
the bituminous layer and the debonding propagation is reduced from 1/3 and 2/3 respectively in comparison to interfaces without grids
- The lower the temperature, the less ductile the behaviour of interfaces
- Whatever the environmental (T°C and water) conditions are, the reinforced specimens with the G4 grid, unlike the ones with the standard G3 grid, perfectly bond to the bituminous layers. The WST opening debonding cracks are obtained inside the grid G4 itself (Figure 21)
(a) (b)
Figure 21 – Interlaminar fracture observation of reinforced (P7) specimens with the G4 grid tested at ambient temperature: without water condition (a) into water condition (b)
5. FATIGUE TESTS
5.1. ON THE FATIGUE TEST TRACK OF IFSTTAR
5.1.1 Track construction of 120m (19m radius) and instrumentation.
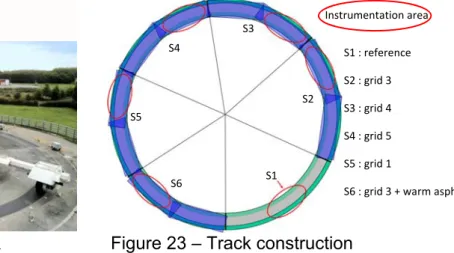
The road structure on this carrousel (figure 22) is made of a support soil of 95 MPa, of a sub-base layer of 145 MPa, of a semi course asphalt of 5cm, the interlayer with or without the grid, and the wearing course of the same SC asphalt of 6cm. This test runway of 120m long is split in six sections: five sections with the same hot asphalt including the reference without grid and four sections with several grids; the sixth section use the same asphalt formula but with a warm asphalt process and the same reference grid G3 as the second section (figure 23).
Figure 22 – Carrousel track Figure 23 – Track construction
S2 S3 S4 S5 Instrumentation area S1 : reference S2 : grid 3 S3 : grid 4 S4 : grid 5 S5 : grid 1 S6 : grid 3 + warm asphalt S6 S1
Substantial instrumentation is used to follow the experimental sections behavior. They are instrumented with horizontal deformation sensors on the base of each asphalt layer and vertical deformation sensors at the top of the sub-base layer as well as sensors to measure deflection and temperatures into the pavement layers.
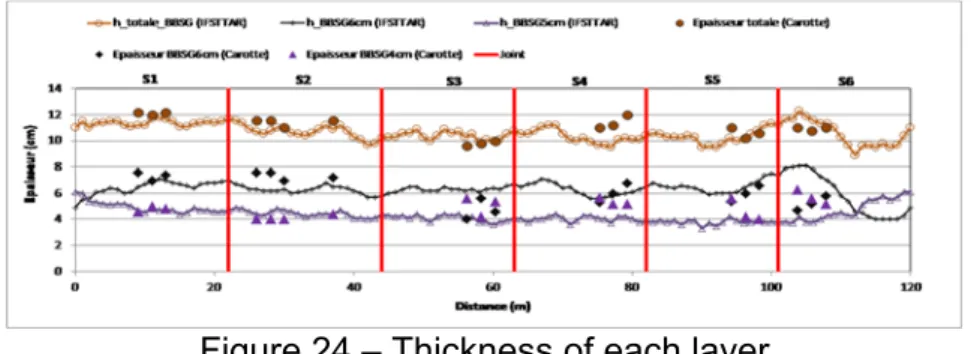
During and after the works, the thickness of each layer was measured by topography and coring, figure 24. It turns out that half of the section S2, all S3, half of S4, all S5, half of S6 have an average total thickness lower than the one of reference S1.
The bearing capacity and the deflection measurements after works also show slight differences between sections. These variations will be taken into account in the analysis of the results at the end of the carousel test.
Figure 24 – Thickness of each layer
5.1.2 General conditions of the fatigue test and first results
The carousel was loaded at 6.5 tons for the first 1.5 million cycles, from May to December 2018 except during summer, then to 7.5 tons for the next 250,000 cycles early 2019. The end of the test will therefore simulate a cumulative traffic of 2 million loads equivalent to 6.5 tons. Temperatures were recorded throughout the test, as well as rain precipitation. At the time of writing the article, we note that the level of deflections is directly related to the thickness of structures. It is also noted that instrumentation disrupts the behavior of zones with four out of five grids. Work will be done by retro-calculation on the values found as a function of bearing capacity of the support soil and the thickness of the asphalt layers. At 1.5 million cycles the areas behaving best are S1 the control (a little thicker), S5 with the grid that has the least mechanical resistance (G1) and the first half of S6 (the thickest) with the grid reference G3 and with warm asphalt. All the parameters at our disposal will be studied with precision in order to interpret the values found correctly.
5.2. FATIGUE TESTS AT ALTERNATIVE 4 POINT BENDING MOVEMENTS
The fatigue tests are done according to the European standard EN 12697-24 in alternate 4 point bending, thesis I. Arseni [17][18][19] [20]
13
The test being performed in alternating bending, it was therefore necessary to build the beam symmetrically. The size of the beams are 630 x 100 x 100 mm3. The thickness consists of 25mm of asphalt, the interlayer, 50mm of asphalt, the interlayer, 25mm of asphalt (semi-course asphalt class 3). According to I. Arseni’s thesis, it was decided for time reasons and the fact that the values were more homogeneous than on smaller beams, to carry out four tests per deformation level and not six as required by the standard. The tests were performed at 115 μdef, 130 μdef and 150 μdef at 15° C, 10 Hz. The references were tested according to the same three-layer construction, the G3 grid, the G4 grid, the G3 grid but with a spacing of 15mm, 70mm, 15mm and finally G3 at a temperature of 20° C, i.e. a total of 60 beams to test. Figure 25 shows the 4 point bending frame used.
The advantage of this procedure in alternating movements is that it highlights the potential weakness in compression of the reinforcement in the direction of the thread. On the other hand, working in imposed strain does not highlight the structural contribution of the grid sufficiently. Indeed, the first results by applying the standard do not demonstrate the correlation with the results of the fatigue test at the carousel and the feedback from the monitored works. Our interpretation comes from the fact that the interest of such reinforcements is to reduce the ultimate microdeformations due to fatigue aging of the mix. A study on this subject remains to be done.
6. ANALYSIS OF PARTICLES DURING RECYCLING
At some point, these reinforcements will probably be deposited. It is therefore important to address the issue of recycling and the consequences of planning the extraction of these grids from the roadway. All of this work will be completed in 2019. For milling, sections used for damage testing and in situ bonding tests have not been fully utilized. It was therefore possible to use a milling machine and instrument it. Sensors were thus inserted above the conveyor and against the planer as seen in figure 27. It was thus possible to recover the dust released in the conveyor (figure 28) and to carry out a dimensional and chemical analysis of the elements found.
Figure 27 – Conveyor sensors Figure 28 - Material ELPI type
Figure 29 - Particle flow: A without grid - B with grids
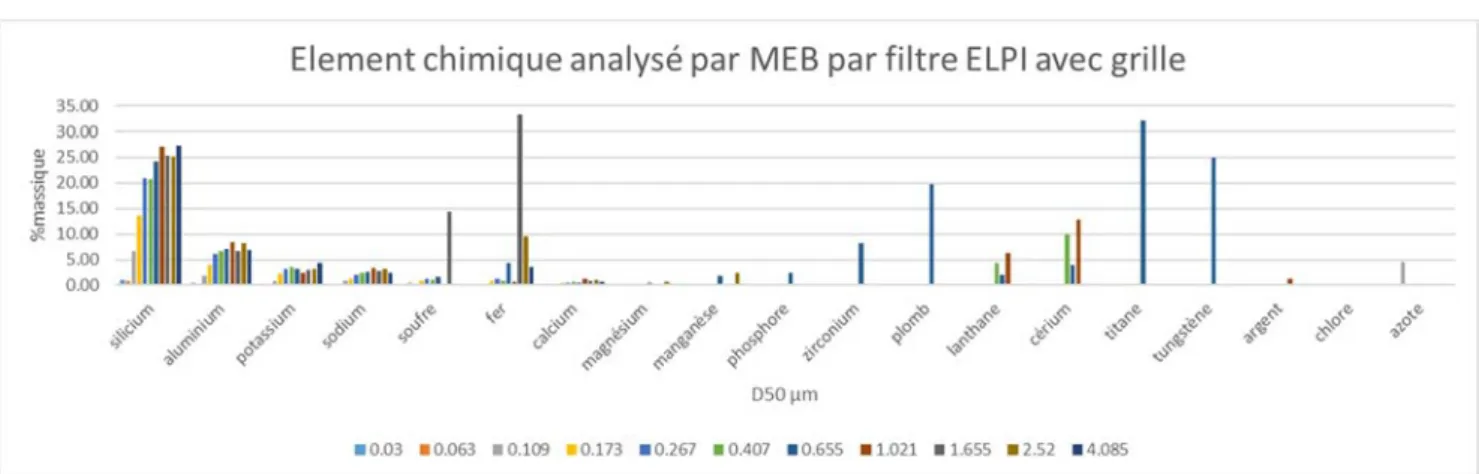
Figure 30 - Recovered chemical elements with grid
Figure 31 – Released aggregates aspect
The conclusion of the results found is not conclusive yet. There is less particle release when there is a grid than without, which requires confirmation. Chemical analysis shows that the constituents of this dust are those conventionally found in aggregate dust. During the disassembly of the carousel in 2019, the length of planning will be better and will provide more exploitable results.
Reuse of these aggregates with these segments of yarns will also be studied. The life cycle analysis is ongoing and will be presented later.
CONCLUSION
The trials of simulation of damage by trafficking and compaction in the laboratory are fairly representative, even if those practiced in situ in this study are probably more aggressive than in reality. After studying the effects of the multi-indentation, the depth and the indentation angle, the temperature of the test, it is possible to find the loss levels observed in situ during single indentation for a single yarn-resin couple. On the other hand, in order to be discriminating between the different types of coating resin that influences the capacity of the yarn to retain its initial properties, it will be necessary to adapt the test protocol: piloting in force or energies to be applied. If we find a correlation between the different results, then this test would be simple to execute and it would then be possible to easily compare the materials between them. The reinforcement must be protected by a coating to resist damage. Fiberglass reinforcements lose mechanical strength at break, but very little elasticity modulus for some grids. The grids without coating or with too soft coatings are not the best adapted to withstand the asphalt implementation.
15
In terms of bonding, we tried to experimentally characterize the interfaces’ bonding break using the wedge splitting with the failure mode I. It was necessary to adapt the procedure to test samples on the scale1. It is difficult to core exactly perpendicular to the forces that will be applied, and exactly in front of the interlayer area to place the wedges. This generates heterogeneous results. The support points are also a variable to take into account. From these results obtained at room temperature, or under water, it seems certain that the interposition of an interlayer disrupts the quality of the bonding. The peel force depends a lot on the quality of the grid. Values range from 30 to 60% of the force without a grid, with an average of 40% less force. The debonding is either on one side of the grid, or on the other, or it is the grid that disintegrates for those that stick best. It was also found that the opening of the interlayer is located 5 cm above for the reference samples. This bonding must be large enough for the reinforcement to provide reinforcement performance, even if it does not obtain the values of an interlayer without geosynthetic. It also seems difficult to find a simulation test for the behavior of the interface; the tests of direct traction, wedge splitting as well as those of shear do not represent perfectly the conditions of a roadway.
Fatigue tests show in the current state of the results that the best performing grid is not the one with the best mechanical resistance. An important work of exploitation of the raw information remains to be done. The standard on fatigue tests EN 12697-24 does not appear to represent the behavior of armed structures.
PERSPECTIVES
The first results show the strong interaction between the grid and the asphalt. The resistance to damage and the quality of the bonding are discriminating elements that must be taken into account.
The continuation of the tests will bring us more precision on the structuring capacities of each tested grid. Is there a grid that is more resistant to damage and more disruptive to bonding or vice versa? The trend shows that the first solution behaves better on the fatigue carousel for the lower resistant grid and the opposite for the stronger one.
Further investigations must be carried out on the fatigue test track for a better understanding of the information provided. We need all these elements to be able to model the behavior of an asphalt flexible structure and to provide a design methodology for the structures.
REFERENCES
[1] Doligez, D., Coppens, MHM., (1996). Fatigue improvement of asphalt reinforced by glass fiber grid. 3rd International Conference Reflective cracking in pavements, p 387-393, Maastricht.
[2] Godard, E., Doligez, D., (1993). Enrobé armé d’une grille en fibre de verre : comportement à la fatigue. Revue Générale des Routes et Aérodromes n°713.
[3] Gileni, F., Godard, E., (2014). Colgrill R dans l’Aude – 15 ans de retour d’expérience sur l’enrobé armé. Revue Générale des routes et de de l’aménagement n°923.
[4] Van Rompu, J., Godard, E., Brissaud, L., Loison, E. (2017). Procédé de renforcement d’enrobé Colgrill R. Qualification des grilles en laboratoire et exemple de réalisation. RGRA n° 944 p 30–35
[5] Godard, E., Chazallon, C., Hornych, P., Chabot, A., Nguyen, M.L., Doligez, D., Pelletier, H. (2017). Projet SolDuGri. Pour une solution durable du renforcement des infrastructures par grilles en fibre de verre. RGRA 949 p 24-33.
[6] Chazallon, C., Nguyen, T.C., Nguyen, M. L.,Hornych, P., Doligez, D., Brissaud, L., Godard, E. (2017). In situ damage evaluation of geogrid used in asphalt concrete pavement. 10th BCRRA 2017, 28/30 June, Athens, 8 pages
[7] Chazallon C., Barazzutti C., Pelletier H., Nguyen M.L., Hornych P. and Doligez D. (2018), Laboratory evaluation and reproduction of geogrid in situ damage used in asphalt concrete pavement, ISAP 2018, Fortaleza, 18-22 June 2018
[8] Chabot, A., Hun, M., Hammoum, F. (2013). Mechanical analysis of a mixed mode debonding test for “composite” pavements. Construction and Building Materials. Vol. 40, p. 1076-1087.
[9] Chabot, A., Buttlar, B., Dave, E., Petit, C., Tebaldi, G. (Eds) (1st ed. 2016). 8th RILEM International Conference on Mechanisms of Cracking and Debonding in Pavements. Springer Series: RILEM Bookseries, Vol. 13, ISBN 978-94-024-0866-9, DOI: 10.1007/978-94-024-0867-6
[10] Chabot, A., Hammoum, F., Hun, M. (2017). A 4pt bending bond test approach to evaluate water effect in a composite beam. European Journal of Environmental and Civil Engineering. Vol. 21 (sup1), p. 54-69.
[11] Petit C., Chabot A., Destree A., Raab C., 2018. Interface debonding behaviour. In Buttlar W.G., Dave E.V., Petit C., Chabot A., Tebaldi G. (Eds) Mechanisms of Cracking and Debonding in Asphalt and Composite Pavements. Chapter III of the State-of-the-Art Report of the RILEM Technical Committee 241-MCD Series, Vol. 28, p. 103-154, Springer, Cham, ISBN 978-3-319-76848-9, Series ISSN, 2213-204X doi: 10.1007/978-3-319-76849-6_3
[12] Petit, C., Chabot, A., Destrée, A., Raab, C (2018). Recommendation of RILEM TC 241-MCD on Interface Debonding Testing in Pavements. Materials and Structures, Vol 51 (4): article 96.
[13] Gharbi, M. (2018). Caractérisation du collage des interfaces de chaussées par essais de rupture en mode I. PhD thesis of ECN & ED SPI.
[14] Gharbi, M., Nguyen, M.L., Chabot, A. (2017). Experimental evaluation of the influence of surface coating on fiberglass geogrid performance in asphalt pavements, 7th International EATA Conference, 2017 June 12th – 14th, Dübendorf, Switzerland (Poster No. 103).
[15] Gharbi, M., Nguyen, M.L., Trichet, S., Chabot, A., (2017). Characterization of the bond between asphalt layers and glass grid layer with help of a Wedge Splitting Test. 10th BCRRA 2017, Athens June 28-30. In CRC Press (Verlag) -Taylor & Francis Group proceedings, p. 1517-1524, ISBN: 978-1-138-29595-7. [16] Gharbi, M., Nguyen, M.L., Chabot, A., (2017). Characterization of Debonding at the Interface between
Layers of Heterogeneous Materials coming from Roads, 23ème CFM, 28 août - 1 sept., Lille.
[17] Arsenie, I.M., Chazallon, C., Duchez, J.L., Hornych, P. (2017). Laboratory characterization of the fatigue behaviour of a glass fibre grid-reinforced asphalt concrete using 4PB tests. Road Materials and Pavement Design. Vol. 18 (1), p.168-180.
[18] Arsenie, I.M., Chazallon, C., Duchez, J.L., Mouhoubi, S. (2017). Modelling of the fatigue damage of a geogrid-reinforced asphalt concrete. Road Materials and Pavement Design. Vol. 18(1), p. 250-262. [19] Arsenie, I.M., Chazallon, C., Themeli, A., Duchez, J.L., Doligez, D. (2012). Measurement and prediction
model of the fatigue behavior of glass fiber reinforced bituminous mixture, RILEM 2012 p 653.
[20] Arsenie, I.M., Chazallon, C., Duchez, J.L., Doligez, D. (2014). Fatigue behavior of an asphalt concrete reinforced with glass fiber grid with 4PB test. ISAP Raleigh NC, USA.
![Figure 1- Bus way, Vaxjö, Sweden [1] Figure 2- RN 139, Port la Nouvelle, France [1]](https://thumb-eu.123doks.com/thumbv2/123doknet/14381469.506278/3.892.83.810.450.966/figure-bus-vaxjö-sweden-figure-port-nouvelle-france.webp)