Comparative analysis of RNA sequencing
methods for degraded or low-input samples
The MIT Faculty has made this article openly available.
Please share
how this access benefits you. Your story matters.
Citation
Adiconis, Xian, Diego Borges-Rivera, Rahul Satija, David S DeLuca,
Michele A Busby, Aaron M Berlin, Andrey Sivachenko, et al.
“Comparative analysis of RNA sequencing methods for degraded
or low-input samples.” Nature Methods 10, no. 7 (May 19, 2013):
623-629.
As Published
http://dx.doi.org/10.1038/nmeth.2483
Publisher
Nature Publishing Group
Version
Author's final manuscript
Citable link
http://hdl.handle.net/1721.1/85835
Terms of Use
Article is made available in accordance with the publisher's
policy and may be subject to US copyright law. Please refer to the
publisher's site for terms of use.
Comprehensive comparative analysis of RNA sequencing
methods for degraded or low input samples
Xian Adiconis1,4, Diego Borges-Rivera1,4, Rahul Satija1, David S. DeLuca1, Michele A.
Busby1, Aaron M. Berlin1, Andrey Sivachenko1, Dawn Anne Thompson1, Alec Wysoker1,
Timothy Fennell1, Andreas Gnirke1, Nathalie Pochet1, Aviv Regev1,2,3, and Joshua Z.
Levin1
1Broad Institute of MIT and Harvard, 7 Cambridge Center, Cambridge, MA 02142 USA 2Department of Biology, Massachusetts Institute of Technology, Cambridge, MA 02139 USA 3Howard Hughes Medical Institute, Massachusetts Institute of Technology, Cambridge, MA 02140
USA
Abstract
RNA-Seq is an effective method to study the transcriptome, but can be difficult to apply to scarce or degraded RNA from fixed clinical samples, rare cell populations, or cadavers. Recent studies have proposed several methods for RNA-Seq of low quality and/or low quantity samples, but their relative merits have not been systematically analyzed. Here, we compare five such methods using metrics relevant to transcriptome annotation, transcript discovery, and gene expression. Using a single human RNA sample, we constructed and sequenced ten libraries with these methods and two control libraries. We find that the RNase H method performed best for low quality RNA, and confirmed this with actual degraded samples. RNase H can even effectively replace oligo (dT) based methods for standard RNA-Seq. SMART and NuGEN had distinct strengths for low quantity RNA. Our analysis allows biologists to select the most suitable methods and provides a benchmark for future method development.
INTRODUCTION
RNA-Seq allows us to comprehensively characterize the transcripts present in a biological sample. While RNA-Seq can, in principle, be used to measure transcripts in any sample, it has been challenging to apply standard protocols to samples with either very low quantity or low quality (partially degraded) input RNA. First, most standard protocols in eukaryotic cells rely on oligo (dT) to isolate polyadenylated (polyA) RNA1, in order to deplete the highly abundant ribosomal RNA (rRNA). Although this is a powerful technique, it excludes many non-polyadenylated transcripts other than rRNA2. In addition, for RNA that is not
Correspondence should be addressed to J.Z.L. ([email protected]) or A.R. ([email protected]). 4These authors contributed equally to this work.
ACCESSION CODES. Gene Expression Omnibus: GSE40705 (sequence data).
NOTE ADDED IN PROOF
While this manuscript was under review, two RNA-Seq methods for low quantity samples were published20, but too late for us to include them in our comparisons.
AUTHOR CONTRIBUTIONS
J.Z.L, X.A., and A.R. conceived the research. X.A. prepared the cDNA libraries. D.B.-R., R.S., N.P., M.A.B. and A.R. developed and performed computational analysis. D.S.D. contributed code. D.S.D., A.M.B., A.S., A.W., and T.F. helped with computational
NIH Public Access
Author Manuscript
Nat Methods
. Author manuscript; available in PMC 2014 January 01.Published in final edited form as:
Nat Methods. 2013 July ; 10(7): . doi:10.1038/nmeth.2483.
NIH-PA Author Manuscript
NIH-PA Author Manuscript
intact, oligo (dT) selection will only isolate the most 3′ portion of each transcript, and oligo (dT) selection is not practical with small amounts of RNA. Moreover, low RNA input can lead to low complexity and suboptimal results, and thus often requires an additional amplification step.
Overcoming these challenges is critical to leverage the power of RNA-Seq for many biomedical applications. For example, total-RNA-Seq of low quality samples is important for formalin-fixed, paraffin-embedded (FFPE) samples, and for clinical samples available only from cadavers such as in the large-scale Genotype-Tissue Expression project (www.broadinstitute.org/gtex). Low quantity total-RNA-Seq paves the way for research with rare cell populations, with minute tissue samples in cancer, and even with single cells3–5.
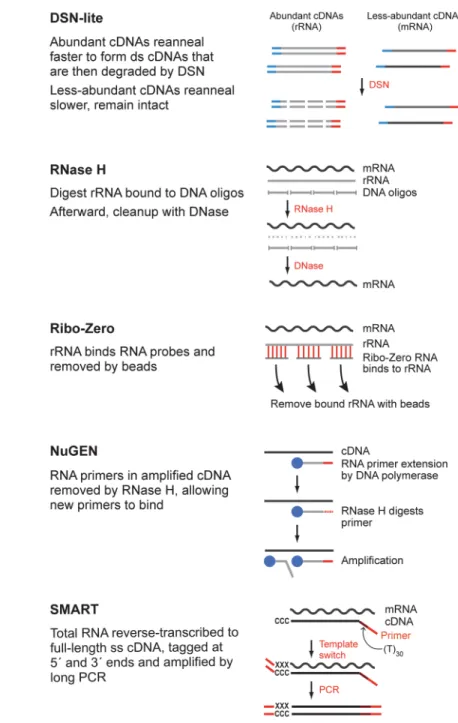
Several methods have recently been proposed to overcome the challenges of low quality and/or low quantity RNA samples, including RNase H (also known as SDRNA)6, 7, Ribo-Zero8, Duplex-Specific Nuclease (DSN) light normalization9, Ovation RNA-Seq system (version 110; version 2 tested here; “NuGEN”), and SMART4 (Fig. 1). However, identifying the relative merits of each method compared to a standard high input, high quality control and determining its suitability for a particular project requires careful comparison by multiple metrics11, 12. Such a comparison has not been conducted to date.
Whereas some metrics, such as percentage of exonic or rRNA reads are important for all studies, other features may be critical only in some settings. For expression profiling projects, metrics related to accuracy and biases in gene expression measurements are critical. Moreover, samples with low or high GC content transcripts need to give even greater weight to GC bias metrics. For polymorphism detection projects, such as somatic mutations in cancer, RNA editing, or allele-specific expression, evenness of coverage, 5′ to 3′ coverage bias, and complexity are important. For transcriptome annotation projects, such as studies of lincRNAs, alternative splicing, or fusion transcripts in cancer cells, evenness of coverage, 5′ to 3′ coverage bias, and coverage of 5′ and 3′ ends are most relevant. In all cases, ease of use and cost are important factors
Here, we compare five RNA-Seq methods for low quality and/or low quantity samples using a comprehensive set of metrics. Starting from one sample of total RNA from a human cell line, we constructed a set of libraries for each method, as well as two control libraries, and sequenced them to deep coverage. For low quality RNA, the RNase H method performed best. We confirmed those results with actual degraded samples. For low quantity RNA, the SMART and NuGEN methods each had distinct strengths.
RESULTS
A comparison of RNA-Seq methods starting from total RNA
We evaluated five methods for preparing RNA-Seq libraries from samples with low quality and/or low quantity (Fig. 1). For low quality samples, we tested four methods (DSN-lite, RNase H, Ribo-Zero, and NuGEN, Fig. 1) with highly-fragmented RNA (Online Methods), preparing six libraries in all. All these libraries started with 1 μg of total RNA, except for NuGEN 100f with 100 ng of fragmented RNA. For the RNase H method, we created a second library with no additional spike-in RNA (“NS” library; Online Methods) and for DSN-lite, we created a second library with PCR before DSN treatment (Online Methods). Since these libraries performed very similarly to their counterparts, we report their results only in Supplementary Tables 1–3. For low quantity samples, we tested two methods for 1 ng intact total RNA (NuGEN 1i and SMART, Fig. 1) as well as oligo (dT) selection (“TruSeq”). Finally, we tested NuGEN with one nanogram of fragmented RNA (“NuGEN
NIH-PA Author Manuscript
NIH-PA Author Manuscript
1f”), representing both low quality and low quantity input. As controls, we prepared two standard libraries from abundant high quality RNA – one with oligo (dT) selection of poly(A)+ RNA and the other from total RNA with no manipulation to remove ribosomal RNA.
For each method, we prepared a cDNA library for Illumina sequencing starting with total RNA from the human Chronic Myeloid Leukemia cell line, K-562. Using paired-end sequencing, we generated > 75 million reads for each library (Supplementary Table 1).
Efficiency of rRNA depletion
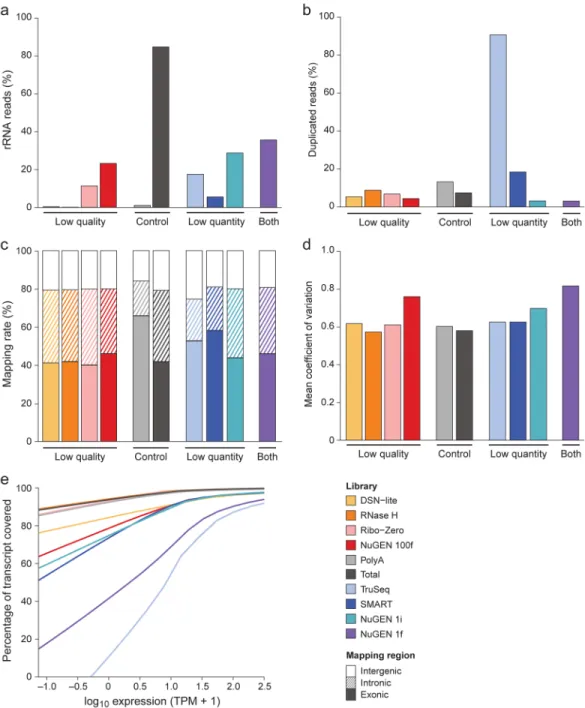
We first assessed the fraction of reads aligning to rRNA (Fig. 2a). Because rRNA reads are not informative for most RNA-Seq experiments, it is best to reduce their levels, thus maximizing coverage of the other transcripts present in a sample. Among the low quality RNA libraries (Fig. 2a), RNase H had the lowest fraction of rRNA-aligning reads (0.1%), while Ribo-Zero (11.3%) and NuGEN (23.2%) were substantially less efficient. Among the low quantity RNA libraries (Fig. 2a), SMART had a much lower fraction of rRNA-aligning reads (5.5%) than TruSeq (17.4%) or NuGEN 1i (28.7%). NuGEN 1f performed slightly less well than NuGEN 1i. Most of the rRNA-aligning reads in the NuGEN 100i, 1i, and 1f libraries (91%, 73%, and 52%, respectively), were derived from mitochondrial rather than cytoplasmic RNA.
Library complexity
To directly compare the libraries by a comprehensive set of metrics, we sampled equivalent sequence datasets for each library (Supplementary Fig. 1; Supplementary Note 1). We first examined library complexity based on their duplication rate. A higher complexity library provides a better sampling of the RNA present in a sample11. Among the low quality RNA libraries, all had a duplication rate below 20%, an acceptable rate of complexity at this depth of sequencing (Fig. 2b). The low duplication rate of NuGEN 100f (4.4%) is not comparable to the other libraries (Supplementary Note 2). As expected, DSN-lite with PCR before DSN treatment had a higher duplication rate than DSN-lite (22.0% versus 5.5%, Supplementary Table 2).
Complexity is especially important for low quantity libraries (Supplementary Note 2). As an alternative measure of their complexity, we compared the number of genes detected in each library (Online Methods). NuGEN 1i had slightly more genes with coverage (Transcripts Per Million (TPM) > 0.1) than SMART (14,149 versus 13,843) (Supplementary Fig. 2,
Supplementary Table 2). The TruSeq method performed poorly based on its extremely high duplication rate (90.7%) (Fig. 2b). NuGEN 1f did not perform as well as NuGEN 1i based on the number of genes covered (Supplementary Fig. 2 and Supplementary Table 2).
Relative coverage of annotated exons and introns
To examine the composition of transcripts selected by each method, we assessed the proportion of reads mapping to annotated exons, introns and intergenic regions. Methods that are not based on the presence of a polyA tail, also sample partially spliced (immature) RNA molecules, because RNA splicing precedes polyadenylation13. As expected, PolyA, TruSeq, and SMART, in which oligo (dT) was used to select for poly(A)+ RNA or to prime cDNA synthesis, had a greater fraction of reads aligning to exons (Fig. 2c), to a similar extent. All the non-oligo (dT) methods had similarly lower proportions of exonic reads (Fig. 2c). The fraction of intergenic reads did not vary much among all the libraries (Fig. 2c).
NIH-PA Author Manuscript
NIH-PA Author Manuscript
Evenness and continuity of transcript coverage
We next compared the evenness and continuity of transcript coverage among our libraries. For evenness of coverage, we calculated the mean coefficient of variation (CV) for each of the 1,000 most highly expressed transcripts in each library. A lower value indicating less variation is better. Among the low quality RNA libraries, RNase H and NuGEN had the lowest and highest mean CVs, respectively (Fig. 2d). Among the low quantity libraries, SMART outperformed NuGEN 1i (Fig. 2d). NuGEN 1f has the highest mean CV of any library (Fig. 2d).
To assess continuity of coverage, we considered the proportion of each gene’s length covered by reads and the number of uncovered gaps in each transcript. Since expression levels are expected to affect both measures, we compared the former to the expression levels (Fig. 2e and Supplementary Fig. 3), and calculated the latter for the top 1,000 expressed transcripts in each library (Supplementary Fig. 4). Among the low quality RNA libraries, RNase H and Ribo-Zero performed better than DSN-lite and NuGEN for both measures. Among the low quantity libraries, SMART and NuGEN 1i were comparable, with TruSeq showing the poorest performance. NuGEN 1f had less continuity of coverage than NuGEN 1i.
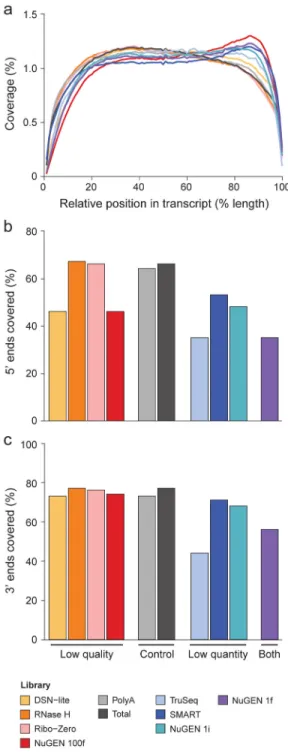
Coverage variation relative to 5′ and 3′ ends
Other measures of transcript coverage are the variation in coverage along each transcript from 5′ to 3′ (Fig. 3a), and the number of genes with covered 5′ or 3′ ends (Fig. 3b,c). Among the low quality RNA libraries, RNase H and Ribo-Zero had the best coverage from 5′ to 3′, as well as at the ends (Fig. 3a–c). All NuGEN libraries were biased towards increased coverage at the 3′ end (Fig. 3a), possibly due to the use of oligo (dT) primers in addition to random primers for first strand cDNA synthesis. Among the low quantity libraries, NuGEN 1i had more even coverage from 5′ to 3′ than SMART (Fig. 3a), but SMART had slightly higher coverage at the ends (Fig. 3b,c). NuGEN 1f performed similarly to NuGEN 1i with respect to 5′ to 3′ bias (Fig. 3a), but with fewer ends covered (Fig. 3b,c), though this could be partially due to fewer paired aligned reads for NuGEN 1f.
In some cases, the performance for these measures is affected by transcript length. Among the low quality libraries, 5′ end coverage in transcripts longer than 1,000 bases was substantially decreased in NuGEN 100f and DSN-lite, while RNase H and Ribo-Zero performed well even for longer transcripts (Supplementary Fig. 5a). There was a stronger 3′ bias in coverage in NuGEN 100f for transcripts shorter than 5,000 bases, but not in the other libraries (Supplementary Fig. 5b). Among the low quantity libraries, all of the libraries had better 5′ end coverage for transcripts shorter than 1,000 bases than for longer transcripts, with the NuGEN 1i performing similarly to SMART for transcripts longer than 5,000 bases (Supplementary Fig. 5a). Similarly, the 3′ end coverage also decreased with length for all libraries, but to a greater extent for TruSeq for transcripts longer than 5,000 bases
(Supplementary Fig. 5a). Furthermore, there was an increased 3′ bias in SMART at longer transcripts, and less such bias in NuGEN 1i (Supplementary Fig. 5b). The 3′ bias shown by SMART for longer transcripts has been observed previously4 and is likely due to the oligo (dT) priming of cDNA synthesis. NuGEN 1f performed slightly less well than NuGEN 1i with respect to length biases (Supplementary Fig. 5a,b).
Expression level performance
As many RNA-Seq experiments are focused on expression level measurements, examining the performance of each library in this area is particularly important. As a ‘gold standard’ control, we sequenced a library from total RNA very deeply to nearly one billion reads (Supplementary Table 1). After computationally removing all rRNA mapped reads, we
NIH-PA Author Manuscript
NIH-PA Author Manuscript
created a ‘truth’ dataset for libraries in which rRNA was removed in the laboratory and looked for those with the best correlation to this control. Spike-in RNA may also be used to assess expression performance (Supplementary Note 3).
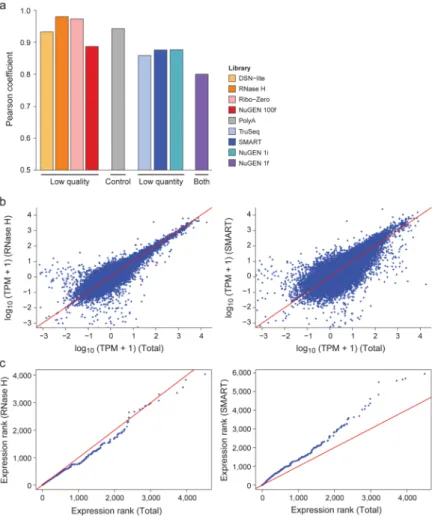
Among the low quality libraries, the RNase H (r = 0.962) and Ribo-Zero (r = 0.955) performed best, based on the highest correlations with this control library, and other measures of consistency at different expression levels, such as Q-Q and MA plots14 (Fig. 4 and Supplementary Fig. 6). Notably, RNase H NS had a correlation of 0.972 with RNase H– indicating that this method is reproducible (Supplementary Table 3).
Among the low quantity libraries, NuGEN 1i (0.861) performed essentially the same as SMART (0.860), followed by TruSeq (0.844) (Fig. 4 and Supplementary Fig. 6). NuGEN 1f had the lowest correlation (0.787) with the control library (Fig. 4), but was better correlated with NuGEN 100f (0.877) indicating that libraries made from fragmented RNA by NuGEN may perform relatively consistently (Supplementary Table 3).
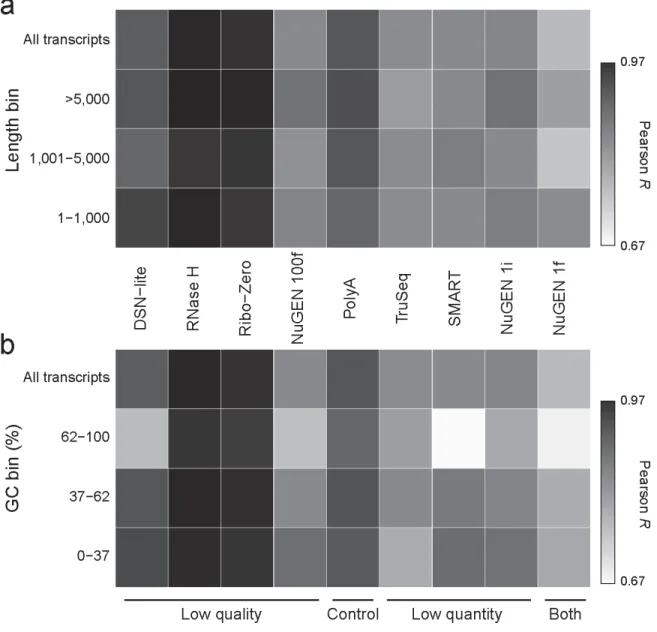
Effects of transcript length and GC content on expression
Finally, we tested if any of the methods introduced particular biases in estimating expression levels of specific subsets of genes. In particular, length and GC biases15, 16 have been reported previously in Illumina sequencing data.
For length bias, we compared library performance for short, medium, and long genes. There was not much variation in the expression metrics for genes of different lengths in any of the libraries (Fig. 5a and Supplementary Fig. 7a), except for NuGEN 1f, which performed slightly less well than NuGEN 1i with respect to length biases (Fig. 5a).
To detect GC bias, we examined expression metrics for subsets of genes with low, medium, or high GC content. Among the low quality libraries, RNase H and Ribo-Zero performed well, but NuGEN 100f and DSN-lite showed lower correlations to the control Total library at high GC (Fig. 5b and Supplementary Fig. 7b). The poorer performance of DSN-Lite is likely due to the hybridization proceeding more quickly for higher GC cDNA inserts, as previously reported with DSN normalization17. Among the low quantity libraries, although both NuGEN 1i (0.800 vs. 0.861) and SMART (0.676 vs. 0.860) had lower correlations to the control Total library for higher GC than for all genes, SMART performed particularly poorly, perhaps due to the first round of PCR amplification (Fig. 5b). NuGEN 1f performed similarly to NuGEN 1i (Fig. 5b).
Evaluation of methods with actual degraded samples
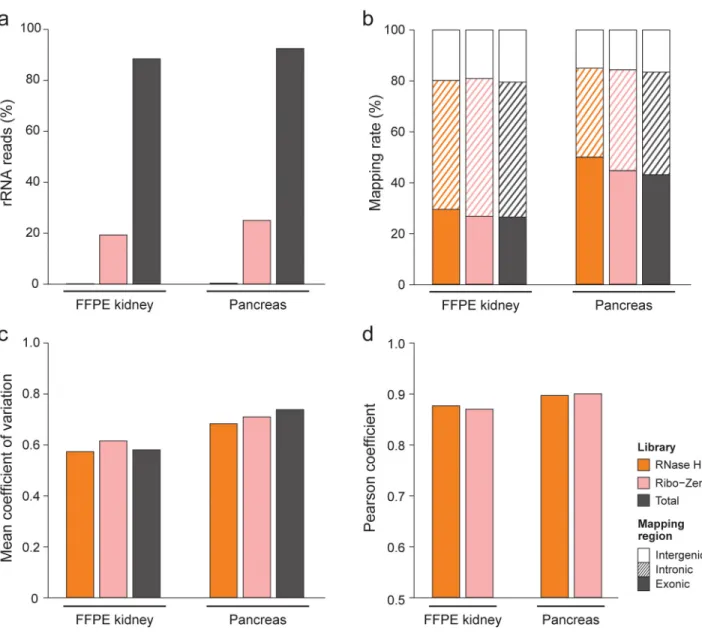
To further test the applicability of methods for low quality RNA in realistic clinical and biological settings, we applied the two most promising methods, RNase H and Ribo-Zero, to two RNA samples with degradation similar to what might be encountered in actual RNA-Seq experiments. One sample from kidney was degraded because of FFPE fixation and the other from pancreas was degraded during isolation as it is difficult to isolate intact RNA from this organ18. We also prepared a “Total” library from total RNA from each sample as a control.
By many metrics, our results with these libraries were similar to the fragmented K-562 libraries (Fig. 6 and Supplementary Fig. 8). The levels of rRNA reads were low for RNase H (0.1 –0.3%), but were substantially higher for Ribo-Zero (19.3 – 25.1%; Fig. 6a). The unexpectedly low fraction of reads aligning to the genome and transcriptome reference sequences for kidney Ribo-Zero was due to a large fraction of reads (46%) aligning to a ~300 bp region in the 45S rRNA transcript adjacent to the 3′ end of the 28S rRNA on an unplaced contig not included in our genome or transcriptome reference sequences
NIH-PA Author Manuscript
NIH-PA Author Manuscript
(Supplementary Table 1). This region also had reads aligning to it in other libraries though not as many (Supplementary Table 1). The complexity of RNase H and Ribo-Zero as measured by duplication rates were generally comparable and less than 20% (Supplementary Table 2). Libraries with better duplication rates had more genes detected (Supplementary Table 2). Furthermore, these tissue-derived libraries had more genes detected than those from K-562 cells. We observed a greater fraction of reads aligning to intron sequences in the FFPE libraries than in other libraries (Fig. 6b) as has been previously reported7. The
evenness of coverage was slightly better for RNase H than Ribo-Zero as measured by CV (Fig. 6c), proportion of gene length coverage (Supplementary Fig. 8a), and number of gaps in coverage of the top 1,000 transcripts (Supplementary Table 2). Transcript coverage from 5′ to 3′ (Supplementary Fig. 8b), at 5′ and 3′ ends (Supplementary Table 2), and for transcripts of different lengths (Supplementary Fig. 8c,d) were all comparable between the two types of libraries, with the possible exception of slightly decreased coverage of the 3′ ends for RNase H pancreas, especially for the longest transcripts. There was essentially no difference in expression level measurements among these rRNA-depleted libraries based on their correlation to levels measured in corresponding Total libraries (Fig. 6d), and other expression plots (Supplementary Fig. 8e–g). These correlations (r = 0.867 to 0.894) were lower than for the K-562 libraries from low quality RNA (r = 0.955 to 0.962) (Figs. 4a and 6d). Similar to the results for RNase H and Ribo-Zero with K-562 RNA, we did not detect any strong biases in expression correlation for these libraries with varying length and GC content (Supplementary Fig. 8h,i).
DISCUSSION
We compared five distinct methods for RNA-Seq with low quantity and/or low quality input RNA by a comprehensive set of quality measures. In addition, the methods also vary in the associated time and cost of materials and kits (Supplementary Table 4). The per-sample cost of the commercial kits (Ribo-Zero, NuGEN, and SMART) is significantly higher than the other methods (DSN-lite and RNase H). The amount of time per library for each method is similar, except DSN-lite requires about one additional day.
Overall, the RNase H method performed best for low quality RNA by most measures (summarized in Supplementary Table 5). Ribo-Zero performed similarly to RNase H by many metrics, so that Ribo-Zero might be acceptable for researchers preferring to use a kit or with only a few samples, despite the higher cost per sample and the need to sequence deeper to compensate for higher rRNA levels (Figs. 2a and 6a) and for other reads aligning in the 45S rRNA transcript adjacent to the 3′ end of the 28S rRNA (Supplementary Table 1). Finding similar results with actual degraded (pancreas and FFPE kidney, Fig. 6,
Supplementary Tables 1,2, Supplementary Fig. 8) as with chemically fragmented (K-562) RNA supports the use of the latter as a model for the former. SMART and NuGEN each had specific advantages for low quantity samples (Supplementary Note 4). We excluded some methods from our comparisons because of their technical limitations or performance issues (Supplementary Note 5).
Only some of the biases we found associated with length or GC content can be corrected computationally post hoc. For example, the ab initio RNA-Seq assembler Cufflinks19
controls for 5′ to 3′ and GC biases when estimating expression levels. However, if a method under-samples 5′ ends, it will inherently limit the ability to annotate and correctly assemble novel transcripts. Similarly, to identify SNPs with RNA-Seq, a bias in coverage cannot be computationally corrected and will prevent identification of many SNPs or require deeper sequencing and higher costs.
NIH-PA Author Manuscript
NIH-PA Author Manuscript
One of the major distinctions between methods is whether they use oligo (dT) to focus on polyA transcripts or capture both polyA and non-polyA RNAs. The former can measure mRNAs at a lower sequencing cost than the latter, and might simplify transcript assembly because a higher fraction of reads align to exons (Fig. 2c). The latter would help study non-polyA mRNAs as well as immature transcripts. Oligo (dT) selection did not perform well for our low quantity sample (“TruSeq”; Fig. 2–5) and is not appropriate for low quality RNA-Seq either, as discussed above. Notably, all of the non-polyA methods for low quality RNA can be extended to prokaryotic samples that do not have RNA with polyA tails, as we have recently shown for DSN-lite and Ribo-Zero17, thus broadening their utility. Furthermore, expression levels estimated with the PolyA or Total libraries are not identical
(Supplementary Table 3). Thus, an argument can be made that ‘standard’ RNA-Seq (with high quantity and high quality RNA) should nevertheless use an rRNA depletion method, such as RNase H, rather than using oligo (dT). In this way, we can capture a more complete view of the transcriptome as well as facilitate direct comparisons between high and low quality RNA samples.
ONLINE METHODS
Low quality RNA samples
To prepare fragmented RNA from high quality human K-562 RNA (RNA Integrity Number (RIN) 9.0; Ambion), we mixed 10 μg of K-562 total RNA (Ambion) with 2 μl of ERCC RNA Spike-In Control Mix 1 (1:10, Ambion), heated in 1× fragmentation buffer (Affymetrix) at 85°C for 3 minutes, quickly chilled on ice, and purified with 2.2× RNAClean SPRI beads.
For human kidney FFPE tissue sections (Cybrdi), we isolated total RNA with the
MasterPure RNA Purification Kit (Epicentre) following the manufacturer’s instructions with these modifications. In step C, we incubated the sample at 37°C for 30 minutes to remove contaminating DNA. In addition to the original protocol, we used
Phenol:Chloroform:Isoamyl Alcohol (25:24:1; Invitrogen) extraction and ethanol
precipitation to minimize possible carryover of organic solvent and proteins. We also did a purification with 1.0× RNAClean SPRI beads (Beckman Coulter Genomics) to remove RNA fragments that could be too small for standard Illumina sequencing and might affect the overall library quality.
For a partially degraded human pancreas total RNA sample (Zyagen), we did two rounds of purification using 2.2× RNAClean SPRI beads. We then removed contaminating DNA using TURBO DNase (Ambion) rigorous treatment and purified the DNase-treated RNA with 2.2× RNAClean SPRI beads.
We assessed the extent of RNA degradation in each sample (kidney FFPE, pancreas, and K-562) using a BioAnalyzer (Agilent; Supplementary Fig. 9). No fragmentation was necessary for the kidney FFPE and pancreas RNA. Although these particular samples were degraded to the point that no additional fragmentation was necessary to prepare libraries for RNA-Seq, this choice could be adjusted for other samples based on a check of their RNA integrity.
RNase H libraries
Our RNase H protocol is similar to the published method6, 7, with some minor differences including oligonucleotide composition and lengths and DNase (see below). To prepare rRNA oligonucleotide pools, we designed 195 50 base DNA oligonucleotides covering the reverse, complement of the entire length of each rRNA (Supplementary Table 6). We then
NIH-PA Author Manuscript
NIH-PA Author Manuscript
pooled together equal molar amounts of each these oligonucleotides (Eurofins MWG Operon).
To deplete rRNA, we added 1,000 ng rRNA pooled oligonucleotides to 1,000 ng of fragmented RNA, incubated in 1× hybridization buffer (200 mM NaCl, 100 mM Tris-HCl pH 7.4) in a final volume of 5 μl at 95°C for 2 minutes, then slowly ramped (−0.1°C/second) to 45°C. We added 5 μl preheated RNase H reaction mix that contains 10 U of Hybridase Thermostable RNase H (Epicentre), 0.5 nmol Tris-HCl pH 7.5, 1 nmol NaCl and 0.2 nmol MgCl2 to the RNA and DNA oligo mix, incubated at 45°C for 30 minutes, and then placed
on ice. We purified the RNase H-treated RNA with 2.2× RNAClean SPRI beads. We removed the oligonucleotides using TURBO DNase rigorous treatment and purified the DNase-treated RNA with 2.2× RNAClean SPRI beads.
For the RNase H NS library, we also prepared an RNase H rRNA-depleted sample by using 1,000 ng fragmented K-562 total RNA without ERCC RNA Spike-In control RNA
following the protocol described above.
For the pancreas and FFPE kidney RNase H libraries, we prepared rRNA-depleted samples starting from 1,000 ng RNA following this protocol omitting the fragmentation step. For all RNase H libraries, we synthesized double-stranded cDNA from RNase H-treated RNA using the ‘control (non–strand-specific)’ protocol as described11, except that we purified the double-stranded cDNA with 1.8× AMPure XP SPRI beads (Beckman Coulter Genomics). We prepared indexed paired-end libraries for Illumina sequencing as
described11, using Phusion High-Fidelity DNA polymerase with GC buffer (New England Biolabs) and 2 M betaine for the final PCR amplification step, with the following
modifications. First, we used forked adapters containing unique 8 base index sequences to enable pooling of libraries in the same flowcell lane. Second, we adjusted adaptor input proportional to the cDNA input with 2 μl 15 μM adaptor for each 1 μg cDNA but with no less than 1.2 μl. Third, we size-selected the ligation product by using two rounds of 0.7× AMPure XP SPRI beads cleanup after raising the volume of the ligation reaction to 100 μl. Fourth, we used 55°C as the annealing temperature in PCR with the universal indexing primers (forward primer
5′-AATGATACGGCGACCACCGAGATCTACACTCTTTCCCTACACGAC, reverse primer 5′-CAAGCAGAAGACGGCATACGAGAT). Fifth, we performed 10 cycles of PCR for the K-562 and pancreas samples and 12 cycles for the FFPE sample. Sixth, we removed PCR primers using 1.0× AMPure XP SPRI beads.
Ribo-Zero libraries
To deplete rRNA, we used 1,000 ng of fragmented K-562 RNA prepared as described above, with the Ribo-Zero rRNA Removal Kit (Catalog number RZH1046, Epicentre) following the manufacturer’s instructions, except at the last purification step we used 1.8× RNAClean SPRI beads instead of ethanol precipitation.
We also prepared rRNA-depleted samples from 1,000 ng each of the pancreas and FFPE kidney RNA described above with the Ribo-Zero Magnetic Gold Kit (Catalog number MRZG126, Epicentre) following the manufacturer’s instructions.
For the Ribo-Zero libraries, we synthesized double-stranded cDNA and prepared an indexed Illumina library as described for the RNase H libraries.
NIH-PA Author Manuscript
NIH-PA Author Manuscript
Poly(A)+ library
To isolate poly(A)+ mRNA, we used 10 μg of intact K-562 total RNA with the Dynabeads mRNA Purification Kit (Invitrogen) following manufacturer’s standard protocol except that we performed an additional round of purification before the final elution.
We added 1 μl Spike-In Control to 10 ng of poly(A)+ mRNA. We fragmented and purified RNA, synthesized double-stranded cDNA, and prepared indexed Illumina libraries as described for the RNase H libraries, except that we performed 12 cycles of PCR.
DSN-lite libraries
We used 1,000 ng of fragmented RNA prepared as described above. We synthesized double-stranded cDNA and prepared an indexed Illumina library using the same protocol as for the RNase H libraries, except that we omitted PCR before DSN treatment. To deplete rRNA cDNAs, we mixed all of the ligation products from the library construction ligation step with 4.5 μl hybridization buffer (2 M NaCl, 200 mM Hepes pH 7.3) in a total volume of 18 μl. We heated this hybridization mix at 98°C for 2 minutes followed by 5 hours at 68°C. We added 20 μl preheated 2× DSN buffer (Axxora) to the hybridization mix and incubated at 68°C for 10 minutes before adding 2 U of DSN (Axxora). We then incubated the reaction mix at 68°C for another 25 minutes, terminated the reaction by adding 20 μl of stop solution (Axxora), placed it on ice, and purified the reaction mix with 1.8× AMPure XP SPRI beads. We performed 9 cycles of PCR as described for the RNase H libraries.
In addition, we also constructed a second DSN-lite library with PCR before the DSN treatment. In this case, we performed 6 cycles of PCR after adapter ligation and used 100 ng of PCR-enriched cDNA library for DSN treatment and performed the final PCR as described for the RNase H libraries with 12 cycles except that we used a different reverse primer (5′-CAAGCAGAAGACGGCATACGAGATxxxxxxxxGTGACTGGAGTTCAGACGTGT with “xxxxxxxx” matching the 8-base index for each library). Oligonucleotide sequences © 2007–2012 Illumina, Inc. All rights reserved. Derivative works created by Illumina
customers are authorized for use with Illumina instruments and products only. All other uses are strictly prohibited.
NuGEN libraries
We synthesized and amplified cDNA using the Ovation RNA-Seq System (version 2, NuGEN) from the following three RNA samples: 1 ng intact K-562 total RNA with 0.5 μl ERCC RNA Spike-In Control Mix 1 (1:25,000) (NuGEN 1i), 100 ng fragmented RNA (NuGEN 100f), 1 ng fragmented RNA (NuGEN 1f) – with the latter two prepared as described above. We sheared all the cDNA under the following conditions: 3 minutes with 10% duty cycle, 5% intensity and 100 cycles per burst in the frequency sweeping mode (Covaris S2 machine). We purified the sheared cDNA with 2.2× AMPure XP SPRI beads and then prepared indexed Illumina libraries as described for the RNase H libraries, except that we performed 6 cycles of PCR.
SMART library
We synthesized and amplified cDNA from 1 ng intact K-562 total RNA using the SMARTer Ultra Low RNA Kit (Clontech) following the manufacturer’s protocol. We sheared the cDNA under the following conditions: 5 minutes with 10% duty cycle, 5% intensity and 200 cycles per burst in the frequency sweeping mode (Covaris S2 machine). We purified the sheared cDNA with 2.2× AMPure XP SPRI beads and then prepared a standard pair-end library for Illumina sequencing as described11, except that we size-selected the ligation product as described above for the RNase H libraries and we used 12 cycles of PCR.
NIH-PA Author Manuscript
NIH-PA Author Manuscript
TruSeq library
We used 1 ng intact K-562 total RNA in the preparation of the TruSeq library using the TruSeq RNA Sample Preparation Kit (version 1, Illumina) according to the manufacturer’s protocol except for that we used SuperScript III in 1st strand cDNA synthesis and incubated the reaction at 50°C instead of 42°C.
Total RNA libraries
We used 1,000 ng of fragmented K-562 RNA prepared as described above to prepare a control library using the same cDNA synthesis and indexed Illumina library construction protocol described for the RNase H libraries, except that we performed 6 cycles of PCR. We also used 1,000 ng each of the purified and DNased FFPE and pancreas RNAs described above to prepare the control libraries using the same cDNA synthesis and indexed Illumina library construction protocol described for the RNase H libraries, except that we performed 9 cycles of PCR for the FFPE sample and 7 cycles for the pancreas sample.
Sequencing
We sequenced each of the K-562 cDNA libraries with an Illumina HiSeq2000 (76 base paired reads, except SMART, which was 101 base paired reads). We sequenced the FFPE and pancreas libraries on an Illumina HiSeq2500 (76 base paired reads). All sequencing used version 3 flowcells and cluster chemistry. For indexed libraries, a third read of 8 bases was done as well. Sequence reads were binned by index read prior to further analysis. We used only PF reads for our analysis.
Library pre-processing
For the SMART library, reads were trimmed to 76 bases to match the other reads in this study. The amplified, long cDNAs contained adaptor sequences on both ends and these sequences were present in reads originating from sheared cDNAs derived from the cDNA ends. We further trimmed reads before aligning to the human genome or transcriptome to remove the specific adaptor-derived sequences (5′
AAGCAGTGGTATCAACGCAGAGTACTTTTTTTTTTTTTTTTTTTTTTTTTTTTTT and 5′ AAGCAGTGGTATCAACGCAGAGTACATGGG) present at the beginning of approximately 1/3 of the second of the paired-end reads.
Identification of rRNA reads
To calculate the percentage of reads originating from rRNA for each library, we aligned all reads to human rRNA (NR_003286.1, NR_003287.1, V00589.1, NR_003285.2, gi| 251831106:648-1601, gi|251831106:1671-3229) using BWA21 (version 0.5.9-r16) in paired-end mode and a maximum edit distance of .04 (default). We marked reads in which both mates aligned to rRNA as rRNA reads and discarded them from further analysis. We also used BWA to align reads not marked as rRNA to unassembled contig GL000220.1, which contains the 45S rRNA transcript comprising the 18S, 5.8S, 28S rRNAs, and two internal and two external transcribed spacer sequences22. We quantified the number of reads overlapping the 3′ external transcribed spacer region of the 45S rRNA (position
118,417-118,780).
Library mapping to the genome
We mapped all libraries to the human genome (hg19 including only chromosomes 1-22, X, Y, and mitochondria) using Tophat23 (version 1.3.3) with default parameters and without gene annotations. We removed unmated reads, retaining only read pairs in which both reads aligned to the genome. For each K-562 library, we then sampled 42.5 million of the
NIH-PA Author Manuscript
NIH-PA Author Manuscript
remaining reads for all subsequent analyses (except for NuGEN 1f, where we retained all 26.3 million reads that mapped as pairs). For the pancreas and FFPE kidney libraries, we sampled 12.8 and 23.7 million reads, respectively.
Calculation of read level metrics
After sampling equal numbers of genome-aligned reads, we generated alignment files for RNA-SeQC12. We sorted the alignment files by genomic coordinate, added read group information, and marked duplicate reads. We used RNA-SeQC (version 1.1.5) to calculate the following metrics: duplication rate, read alignment positions (exonic, intronic,
intergenic), coefficient of variation, percent of gene covered, and coverage gaps (≥ 5 adjacent bases without coverage). The coverage gap definition is somewhat arbitrary, but is consistent with our previous metrics11. We compiled the results in R (www.R-project.org) for downstream visualization. We used the UCSC Genome Browser24 knownGene transcript dataset (version 05-Feb-2012) to annotate the genomic alignments.
Library complexity based on duplicate reads
We determined the number of duplicated read pairs using MarkDuplicates in Picard Tools (http://picard.sourceforge.net). We defined duplicate reads as each having both mates being aligned to the same position (primary alignments) in the genome. The duplication rate estimates the fraction of identical read pairs in a library due to the final PCR amplification step.
Continuity of coverage
We obtained from RNA-SeQC the percentage of each transcript that is not covered. We then converted from transcript to gene (locus) by aggregating each isoform’s measures and weighing them equally (arithmetic mean). Next, we plotted this mean coverage versus the mean expression level across all isoforms per gene and calculated in each plot the LOWESS fit for the data using R.
Library mapping to the transcriptome
To calculate metrics related to transcript expression levels, we aligned all non-rRNA reads directly to a transcriptome-based index. First, we created a Bowtie alignment index based on the knownGene transcriptome annotations from the UCSC Genome Browser24, adding 125 base polyA tails to the end of each known transcript sequence as previously described25. We then used Bowtie26 (version 0.12.7) to align reads to this index allowing at most two mismatches per read, and all other default parameters of RSEM25. We required each read to align with its mate pair to the same transcript. For each K-562 library, we then sampled 20 million of the aligned reads (except for NuGEN 1f, which had only 12 million such mapped reads) and remapped those reads with RSEM using the same parameters as above, but allowing an unlimited number of hits per read. We used this mapping in the subsequent analyses. These RSEM calculations took between 4 and 12 hours of CPU time on a server using ten threads with four cores, each library taking about 1-2G of RAM. Similarly for the pancreas and FFPE kidney libraries, we sampled 6.6 and 6.7 million aligned reads,
respectively.
Coverage relative to 5′ and 3′ ends
Using the Bowtie alignments to the transcriptome, we examined read coverage at the ends and along the length of the transcripts. We used the knownGene annotation from the UCSC Genome Browser24 to obtain transcription start and end sites. We defined a transcript start or end to be covered if at least one read mapped to the first or last annotated 100 bp of the transcript, respectively. We excluded transcripts not expressed in the control Total library.
NIH-PA Author Manuscript
NIH-PA Author Manuscript
To avoid using reads mapping to the artificial polyA tail in the transcriptome index (see above), we removed all reads containing more than 40 consecutive A bases. After removing these reads, we found that SMART still contained a large number of reads mapping to the polyA tail due in part to the fact that some of the SMART reads derived from the 3′ end of transcripts, once trimmed of their adapters, were only 21 bases long. Therefore, we also removed reads with at least 21 consecutive A bases from the SMART library. While these reads comprised 3.4% of the remaining reads in the SMART library, they were < 0.1% of remaining reads in the other libraries. Finally, for transcripts that had more than 500 mapped reads, we divided each transcript into 100 equally sized length bins from 5′ to 3′ end. For each bin, we calculated the relative coverage compared to the coverage for the entire transcript. We calculated each metric for all transcripts as well as in transcript groups based on length.
Expression quantification and related metrics
We used the read alignments to the UCSC knownGene transcriptome as input to RSEM25 (version 1.1.17). RSEM calculates expression estimates that are corrected for isoform expression. RSEM-produced tau values were multiplied by 1,000,000 and are analogous to fragments per kilobase per million sequenced reads (FPKM) estimates. We refer to these expression values as ‘TPM’ and used them for all subsequent analysis.
To calculate expression correlations, we first added one to each expression value, and then used the log10 of this sum as input (to give more equal weight to genes with lower
expression values) to calculate the Pearson correlation between each of the libraries using R (version 2.14.2) and ggplot227.
For scatter, MA, and Q-Q plots, we compared two sets of expression level data points (D1,
D2). Scatter plots show the log10(D1+1) versus log10(D2+1). MA plots show
log10(D1)+log10(D2) versus log10(D1)-log10(D2). Q-Q plots show a quantile-quantile plot of
D1 versus D2. We removed the top ten most highly expressed transcripts from each of our
Q-Q plots, defined on a per-sample basis.
For spike-in RNA analysis, we aligned the reads for each library from a single lane of sequencing to the ERCC reference sequences (Ambion) with BWA21. We then used a custom Picard module to parse the aligned bam file in order to calculate the coverage (reads/ total reads) for each spike-in sequence. For each library, we calculated the Pearson
coefficient with the log10 (coverage + 1 ×10⁻⁸) relative to the log10 (stated input amounts +
1 ×10⁻⁸) (Ambion).
Number of genes covered
We estimated the number of genes detected by each library out of those genes (loci) that had at least one transcript detected at a TPM threshold of 0.1 in the control Total library. We calculated the number of genes detected at different TPM thresholds, showing that the relative ranking of methods is largely robust to the specific threshold.
Binning GC/length analysis
We aggregated the results from RNA-SeQC and the expression values produced by RSEM using R. We then calculated the mean of each tested measure (Pearson correlation, 5′ to 3′ coverage and ends, and expression plots) for bins of specific GC content or length of the transcript/gene. The bins for GC content were: 0–37%, 37–62%, and 62–100%. The length bins were: 1–1,000 bases, 1,000–5,000 bases, and greater than 5,000.
NIH-PA Author Manuscript
NIH-PA Author Manuscript
Supplementary Material
Refer to Web version on PubMed Central for supplementary material.
Acknowledgments
We thank D. Sinicropi for alerting us to his RNase H method, Broad Genomics Platform for sequencing work, C. Nusbaum, R. Johnson, M. Yassour, and V. Savova for helpful discussions, and L. Gaffney for assistance in drafting figures. Work was supported by an NIH Pioneer Award DP1-OD003958-01, an National Human Genome Research Institute (NHGRI) 1P01HG005062-01, an NHGRI Center of Excellence in Genome Science Award
(1P50HG006193-01), Howard Hughes Medical Institute, the Merkin Foundation for Stem Cell Research and the Klarman Cell Observatory at the Broad Institute (to A.R.), and by US NHGRI grant HG03067. N.P. was supported by a postdoctoral research fellowship of the Fund for Scientific Research - Flanders (FWO Vlaanderen), Belgium.
References
1. Aviv H, Leder P. Purification of biologically active globin messenger RNA by chromatography on oligothymidylic acid-cellulose. Proc Natl Acad Sci U S A. 1972; 69:1408–1412. [PubMed: 4504350]
2. Yang L, Duff MO, Graveley BR, Carmichael GG, Chen LL. Genomewide characterization of non-polyadenylated RNAs. Genome Biol. 2011; 12:R16. [PubMed: 21324177]
3. Tang F, et al. mRNA-Seq whole-transcriptome analysis of a single cell. Nat Methods. 2009; 6:377– 382. [PubMed: 19349980]
4. Ramskold D, et al. Full-length mRNA-Seq from single-cell levels of RNA and individual circulating tumor cells. Nat Biotechnol. 2012
5. Islam S, et al. Characterization of the single-cell transcriptional landscape by highly multiplex RNA-seq. Genome Res. 2011; 21:1160–1167. [PubMed: 21543516]
6. Sinicropi, D.; Morlan, J. Methods for Depleting RNA from Nucleic Acid Samples. 2011. 20110111409
7. Morlan JD, Qu K, Sinicropi DV. Selective Depletion of rRNA Enables Whole Transcriptome Profiling of Archival Fixed Tissue. PLoS One. 2012; 7:e42882. [PubMed: 22900061]
8. Huang R, et al. An RNA-Seq strategy to detect the complete coding and non-coding transcriptome including full-length imprinted macro ncRNAs. PLoS One. 2011; 6:e27288. [PubMed: 22102886] 9. Yi H, et al. Duplex-specific nuclease efficiently removes rRNA for prokaryotic RNA-seq. Nucleic
Acids Res. 2011; 39:e140. [PubMed: 21880599]
10. Tariq MA, Kim HJ, Jejelowo O, Pourmand N. Whole-transcriptome RNAseq analysis from minute amount of total RNA. Nucleic Acids Res. 2011; 39:e120. [PubMed: 21737426]
11. Levin JZ, et al. Comprehensive comparative analysis of strand-specific RNA sequencing methods. Nat Methods. 2010; 7:709–715. [PubMed: 20711195]
12. Deluca DS, et al. RNA-SeQC: RNA-seq metrics for quality control and process optimization. Bioinformatics. 2012
13. Beyer AL, Osheim YN. Splice site selection, rate of splicing, and alternative splicing on nascent transcripts. Genes Dev. 1988; 2:754–765. [PubMed: 3138163]
14. Yang YH, et al. Normalization for cDNA microarray data: a robust composite method addressing single and multiple slide systematic variation. Nucleic Acids Res. 2002; 30:e15. [PubMed: 11842121]
15. Aird D, et al. Analyzing and minimizing PCR amplification bias in Illumina sequencing libraries. Genome Biol. 2011; 12:R18. [PubMed: 21338519]
16. Rosenkranz R, Borodina T, Lehrach H, Himmelbauer H. Characterizing the mouse ES cell transcriptome with Illumina sequencing. Genomics. 2008; 92:187–194. [PubMed: 18602984] 17. Giannoukos G, et al. Efficient and robust RNA-seq process for cultured bacteria and complex
community transcriptomes. Genome Biol. 2012; 13:R23. [PubMed: 22455878]
18. Griffin M, Abu-El-Haija M, Rokhlina T, Uc A. Simplified and versatile method for isolation of high-quality RNA from pancreas. Biotechniques. 2012; 52:332–334. [PubMed: 22578126]
NIH-PA Author Manuscript
NIH-PA Author Manuscript
19. Roberts A, Trapnell C, Donaghey J, Rinn JL, Pachter L. Improving RNA-Seq expression estimates by correcting for fragment bias. Genome Biol. 2011; 12:R22. [PubMed: 21410973]
20. Pan X, et al. Two methods for full-length RNA sequencing for low quantities of cells and single cells. Proc Natl Acad Sci U S A. 2013; 110:594–599. [PubMed: 23267071]
21. Li H, Durbin R. Fast and accurate short read alignment with Burrows-Wheeler transform. Bioinformatics. 2009; 25:1754–1760. [PubMed: 19451168]
22. Maden BE, et al. Clones of human ribosomal DNA containing the complete 18 rRNA and 28 S-rRNA genes. Characterization, a detailed map of the human ribosomal transcription unit and diversity among clones. The Biochemical journal. 1987; 246:519–527. [PubMed: 3689320] 23. Trapnell C, Pachter L, Salzberg SL. TopHat: discovering splice junctions with RNA-Seq.
Bioinformatics. 2009; 25:1105–1111. [PubMed: 19289445]
24. Dreszer TR, et al. The UCSC Genome Browser database: extensions and updates 2011. Nucleic Acids Res. 2012; 40:D918–923. [PubMed: 22086951]
25. Li B, Dewey CN. RSEM: accurate transcript quantification from RNA-Seq data with or without a reference genome. BMC Bioinformatics. 2011; 12:323. [PubMed: 21816040]
26. Langmead B, Trapnell C, Pop M, Salzberg SL. Ultrafast and memory-efficient alignment of short DNA sequences to the human genome. Genome Biol. 2009; 10:R25. [PubMed: 19261174] 27. Wickham, H. ggplot2: Elegant Graphics for Data Analysis (Use R!). 2. Springer; New York: 2009.
NIH-PA Author Manuscript
NIH-PA Author Manuscript
Figure 1. Methods for total RNA-Seq
Shown are the salient details for five protocols for total RNA-Seq. DSN-lite (Duplex-specific nuclease, low C0t normalization), RNase H, and Ribo-Zero were tested for low
quality samples; SMART was tested for low quantity samples. NuGEN, which generates double-stranded cDNA amplified using Ribo-SPIA (Single Primer Isothermal
Amplification), was tested for both types of samples: (NuGEN 100f for low quality; NuGEN 1i for low quantity, and NuGEN 1f for low quantity and low quality). In each case, RNA and matching cDNA are in black, adaptors and primers in color, and rRNA is in grey.
NIH-PA Author Manuscript
NIH-PA Author Manuscript
Figure 2. Sequence alignment and uniformity of coverage metrics
Shown is the performance of each library (x axis, color coded as in legend) for each of (a) Percent of rRNA mapping reads; (b) Percent of duplicated reads; (c) Proportion of reads mapping to exons (solid), introns (hatched), and intergenic (white) regions; (d) Evenness of coverage. Shown is the mean coefficient of variation (y axis) for the top 1,000 expressed transcripts in each library (x axis); and (e) Proportion of transcript covered at each expression level. Shown are the Lowess fits of the percentage of the transcript length covered (y axis) for transcripts at each expression level (x axis). Transcript coverage was aggregated for all isoforms of each gene.
NIH-PA Author Manuscript
NIH-PA Author Manuscript
Figure 3. 5′ to 3′ sequence coverage
(a) Normalized coverage by position. For each library, shown is the average relative coverage (y axis) at each relative position along the transcripts’ length. (b,c) 5′ and 3′ end coverage. For each library, shown is the percentage of annotated 5′ (b) and 3′ (c) ends covered by reads.
NIH-PA Author Manuscript
NIH-PA Author Manuscript
Figure 4. Expression metrics
(a) Pearson correlation coefficient between each library and the control Total library. (b–e) Illustrative scatter plots (b,c) and Q-Q plots (d,e) between a low quality library (RNase H,
b,d, y axis) or a low quantity library (SMART, c,e, y axis) and the control Total library (x axis). For Q-Q plots, if the two samples originated from the same distribution, then the points will lie on a straight line. TPM = Transcripts Per Million.
NIH-PA Author Manuscript
NIH-PA Author Manuscript
Figure 5. Length and GC biases in expression metrics
Shown are the Pearson correlation coefficient between each library (columns) and the control Total library for either all transcripts (top row) or for transcripts with (a) different lengths; or (b) different GC content. The number of transcripts expressed in the control Total library in bins with length < 1,000, 1,000–5,000, and > 5,000 was 3,716, 38,088, and 7,050, respectively. The number of transcripts expressed in the control Total library in bins with GC content < 37%, 37–62%, and > 62% was 2,358, 42,660, and 3,836, respectively.
NIH-PA Author Manuscript
NIH-PA Author Manuscript
Figure 6. Performance for actual degraded samples
Shown are key metrics for RNase-H (orange), Ribo-Zero (pink) and total (black) libraries from pancreas and FFPE kidney RNA. (a) Percent of rRNA mapping reads; (b) Proportion of reads mapping to exons (solid), introns (hatched), and intergenic (white) regions; (c) mean coefficient of variation (y axis) for the top 1,000 expressed transcripts in each library (x axis); (d) Pearson correlation coefficient between each library and a control Total library.