CHEMILUMINESCENCE AND PHOTOLUMINESCENCE OF
RUTHENIUM CHELATES
by
Fred Edward Lytle B.S , Juniata College
(1964)
Submitted in Partial Fulfillment of the Requirements for the
Degree of
DOCTOR OF PHILOSOPHY
at the
MASSACHUSETTS INSTITUTE OF TECHNOLOGY August, 1968
Signature of Author
Department of th irs , August 27, 1968
Certified by ___ V V
Thesis Supervisor
Accepted by
Chairman, Departmental Committee on Graduate Students
Archives
OCT 3 1968
LISRARISS
-2-This doctoral thesis has been examined by a Committee of the Department of Chemistry as follows:
Professor Kerry W. Bowers
7
Professor David Mo Hercules(Chairman)
(Thesis Supervisor)
Professor Richard Co Lord ._
3
-CHEMILUMINESCENCE AND PHOTOLUMINESCENCE OF
RUTHENIUM CHELATES by
Fred Edward Lytle
Submitted to the Department of Chemistry
on August 27, 1968, in partial fulfillment of the
requirements for the degree of Doctor of Philosophy
ABSTRACT
Chemiluminescence-Most solution chemiluminescence that has been reported, to date, can be placed into one of three categories: reactions involving molecular oxygen or peroxides, oxidation of anion radicals, and alternating current electrolysis of aromatic hydrocarbons
Earlier work in our laboratory prompted a closer look at possibilities for producing chemiluminescence by electron transfer to a potential emitter, ioeo by reducing a compound to a luminescent species by a one electron reduction process.
The over-all reaction for the first type of system studied can be written as
RNH2+ m + reductant+ RNH2+ hv
The radical-cation of 1, 6-diaminopyrene proved to be an example of a chemiluminescent electron acceptor fitting this general type of reaction. For the case where hydrazine was the reducing agent, it was shown that the emitting species was the narent diamine. And for the case where the
naphthalene radical-anion was the reducing agent, it was shown that enough energy is available to produce an excited state of 1,
pyrene by a simple one-electron reduction reaction.
The over-all reaction for the second type of system studied can be written as
ML +(n+l) + reductant 4 ML +n+hv
x x
where M represents a metal ion and L a suitable ligand. The Complexes successfully used in the present study all had ruthenium as the central metal ion (n=2). The ligands were 2,2'-bipyridine, 5-methyl-l,10
phenanthroline, 5,6-dimethyl-1,10-phenanthroline, and
3,5,6,8-tetramethyl-1,O0-phenanthroline (all having x=3). For the case where 2,2'-bipyridine was the ligand, it was shown that the emitting species was the ruthenium (II) chelate when either hydrazine or hydroxyl ion were used as the reducing agent, It was also shown that the published
mechanism for hydrazine oxidation does not completely describe all of the reactions occuring in the Ru(III)(bipyr) 3C12-hydrazine
chemilumin-escent system.
The results of this research, combined with the earlier studies, indicate that electron-transfer reactions involving a potentially
luminescent acceptor show great promise for discovering new chemilumin-escent reactions,
Photoluminescence-No previously published explanation of the luminescence of tris-(2,2'-bipyridine) ruthenium (II) dichloride has been completely adequate in explaining all of the experimental data. Evidence is presented in this thesis that supports assignment of the emission as charge-transfer, spin-forbidden luminescence. Spin-orbit coupling existing in the complex enhances the probability of singlet-triplet transitions and yields an abnormally short-lived phosphorescence. -- --- ~
-5-In an EPA solvent, the rate constants for phosphorescence, triplet internal conversion, singlet internal conversion, fluorescence and
intersystem crossing have been determined as:
5 -1 3 5 -1 1 8 -3
k 2.9 x 10 se ; k i 3.1 x 10 se-1 ; k 1 5 x 10⁸ see
-p ic ic
5 -1 10 -1
k f 4 x 10⁵ sec ; and k > 5 x 10 sec respectively.
Thesis Supervisor: David M. Hercules Title: Associate Professor
-6-I go, I went, I have gone; Leaving my Footprints In the sands Of time. But, alas;
They end not With a man,
But a Hole. -~--- - -- -'-- ~
7
-ACKNOWLEDGEMENTS
The author would like to express his appreciation to Professor David Mo Hercules for the suggestion of the problem. The patience and encouragement sustained during the course of the research at M.I.T., in
addition to the beginning years at Juniata College, amply demonstrate his ability as a fine teacher. Appreciation is also due Professor Kerry W, Bowers for helpful suggestions and criticisms during the course of
the work and in reading the manuscript.
The author wishes to thank the following individuals, outside of the laboratory, whose help concerning various facits of the research was invaluable; Professor W. E. Ohnesoxge of Lehigh University for a general understanding of transition-metal-complex luminescence; Dr. Jack Chang of Eastman Kodak for electrochemical measurements and
teaching the author a systematic approach to experiment6tion; Mr. George K, Turner of Go K. Turner Associates for a lengthy discussion concerting
fluorometer calibration; and Mr. Eo T. Meserve of TRW for helpful discussions concerning the Nanosecond Spectral Source.
The author wishes to thank his colleagues for many interesting and enlightening discsi1ons. Tony Vaudo should be mentioned for aid in constructing the constant temperature cryostat. Steve Carlson should also be mentioned for doing all of the "dirty work" connected with the NMR studies.
The author is indebted to his parents for the extreme
financial hardships that they had to endure to guarantee him an under-graduate education.
-8-And finally, the author is indebted to his wife, Marsha, for often boosting his morale and for enduring hardships beyond the call of duty,
9 -TABLE OF CONTENTS ?Pa2ge ABSTRACT 3 ACKNOWLEDGEMENTS 7 TABLE OF CONTENTS 9 INDEX OF FLGURES 1z INDEX OF TABLES 15 I, Chemiluminescence Introduction 17?
II. Photoluminescence Introduction 20
III, Experimental 23 A. Chemicals 23 B. Solutions 25 C. Spectral Instrumentation 26 D. Temperature Control 37 E. Kinetic Measurements 45 1, Slow reactions 45 2. Fast reactions 45 F. Miscellaneous Instrumentation 46 G. Procedures 47 1. Fluorometer Calibration 47 2. Quantum Yield 57
- 10
-Page
IV. Photoluminescence Studies 64
A. Results 64
1o Absorption and Emission Spectra 64
2. Temperature Dependent Spectral Properties 72 3, Wavelength Dependence of the Quantum Yield 85 4. Wavelength Dependence of the Emission Lifetime 93
B. Discussion 93
1. Transition Types 93
2. Absorption and Emission 99
3, Long Wavelength Absorption land 101
4. Temperature Dependent Spectral Properties 104
5. State Diagram 105
V. Chemiluminescence Studies 111
A. Qualitative Observatio 111
1. Chelate Reactions iii
2. Arcmatic Radical-Cation eactions 114
Bo Results 116
1. Spectra 116
2. Electrochemistry 116
3. Electron Paramagnetic Resonance 121
4. Chelate Auto-reduction Kinetics 128
5. Chelate-Hydrazine Kinetics 131
C. Discussions 139
1. Identification of Emitting Species 139
2. Energy Consideration 139
3. Reaction Kinetics 141
VI. Appendixes 147
A. Kinetic Modeling Computer Program 147
1. Object
1IIIIC -
.
- 11 -Page 2. Method of Calculation 147 3. Program Description 149 4. Coefficient Matrix 176 5. Input 178 6. Program Check 182
Bo Nuclear Magnetic Resonance Studies 184
1o Introduction 184
2. Ligand Spectra 184
3. Protonated Ligand Spectra 185
4. Chelate Spectra 193 5. Analytical Applications 197 BIBLIOGRAPHY 199 BIOGRAPHICAL NOTE =--iiLII 202
- 12
-INDEX OF FIGURES
Number Title Page
III-1 Fluorometer Constructed from Aminco Building Blocks 27 111-2 Wavelength Driving and Monitoring Systems 31
111-3 "T" Mixer 35
111-4 Thermostating Cell 38
111-5 Constant Temperature Cryostat 40
111-6 Cryostat Cell Holder 42
111-7 Detector Calibration Curves 52
111-8. Spectral Distribution of Lamps 55
III-9 " Fluorometer Calibration Check 58
III-10 Deoxygenation Apparatus 61
IV-I Absorption and Emission Spectra of Ru(bipyr)3C12 66
IV-2 Low Temperature Absorption and Emission Spectra
of Ru(bipyr) 3C12 68
IV-3 Absorption and Emission Spectra of 2,2'-Bipyridine in
50% H2S0 4 70
IV-4 Temperature Dependence of the Half-width of the
Protonated Ligand 3.45p -1 Band 73
IV-5 Infrared Spectrum of 2,2'-Bipyridine 75
IV-6 Infrared Spectrum of Ru(bipyr)3C12 77 IV-7 Dependence of the Ru(bipyr) Cl2 Lifetime on Temperature 79 IV-8 Dqpendence of the Ru(bipyr)3 Cl2 Quantum Yield and
Lifetime on Temperature 81
IV-9 Arrhenius Plot for Ru(bipyr) 3C12 in DMF 87
- 13
-Number Title Page
IV-11 Excitation Spectra of Ru(bipyr) 3C12 91
IV-12 Log Intensity vs. Time Plots for Ru(bipyr)
3C12
Emiss ion 94
IV-13 Orbital Diagram for Ru(bipyr)
3C12 96
IV-14 Ru(bipyr)3C12 State Diagram 106
V-1 Chemiluminescence and Phosphorescence Spectra
of Ru(bipyr) 3C12 117
V-2 Chemiluminescence and Fluorescence Spectra of
1,6-Diaminopyrene 119
V-3 Current-voltage Curve for Millimolar Ru(bipyr)
3C12
in lN HNO3 122
V-4 Current-voltage Curve for Millimolar 1,6
Diaminopyrene in Dimethylformamide 124
V-5 Electron Paramagnetic Resonance Spectra for the
1,6-Diaminopyrene Radical Cation in Dimethylformamidel26 V-6 Auto-reduction of Ru(III)(bipyr)
3Cl3 at PH = 3 129
V-7 Chelate-Hydrazine Stopped-flow Curves 132
V-8 Chelate-Hydrazine Stopped-flow Curves 134
V-9 Chelate-Hydrazine Stopped-flow Curves 137
VI-1 Main Routine, MAIN 159
VI-2 Input Subroutine, INPUT 161
VI-3 Calculating Subroutine, CALC 164
VI-4 Negative Concentration Subroutine, NEGC 166 VI-5 Print Preparation Subroutine, PRINTP 170
VI-6 Output Subroutine, OUTPUT 172
VI-7 Plot Preparation Subroutine, PLOT 174
- 14
-Number Title Pag
VI-8 NMR Spectrum of 2,2'-Bipyridine 186
VI-9 NMR Spectrum of Diprotonated 2,2'-Bipyridine 189
VI-10 Downfield Shift of the 2,2'-Bipyridine Protons
as a Function of Acidity 191
- 15
-INDEX OF TABLES
Number Title Page
IV-1 Band Maxima and Intensities 65
IV-2 Temperature Dependence of the Luminescence 84 Quantum Yield and Lifetime
IV-3 Arrhenius Constants from Lifetime Data 87
- 16
-COMMONLY OCCURRING STRUCTURES
Structure Name 1, 10-phenanthroline 2,2 '-bipyridine rub rene 1,6-diaminopyrene
0
0
.00
000
- 17
-Io Chemiluminescence Introduction
Chemiluminescence can be defined, simply, as the production
of light by a chemical reaction. The phenomenon is not new and has
been recognized since 1877, when Radziszewski demonstrated that
lophine reacted with oxygen in alcholic potassium hydroxide producing
light (38). Two well known examples of phemiluminescent compounds -re luminol (1) and luciginin (14)o The general subject has been reviewed recently by McCapra (29), Most solution chemiluminescence that has been reported, to date, can be placed into one of three categories; reactions involving molecular oxygen or peroxides (15), oxidation of anion radicals (7, 8), and alternating current electrolysis of aromatic
hydrocarbons (51, 44, 18).
In the course of Lansbury's (19) work on the alternating current electrolysis of rubrene, it was discovered that the radical-cation
reacted with electron donors to produce chemiluminescence. These results prompted a close look at other possibilities for producing chemilumines-cence by electron transfer to a potential emitter, i. e. by reducing
a compound to a luminescent species by a oneelectron reduction process. The general scheme for an electron-transfer reaction cani be written as
A + D + A + D 11
where A is the electron acceptor and D is the electron donor.
- 18
-if three criteria are meto First, sufficient energy must be available from electron-transfer to produce an excited state of the reduced
species. Second, the reduced species must be capable either of emitting or energy transfering to a potential emitter. Third, the kinetics of
the reaction must be sufficiently rapid so that the rate of photon production is detectableo
When initally investigating the general electron-transfer reaction shown in Equation I-i, two possibilities came to mind: the reduction
of aromatic hydrocarbon radical cations and the reduction of metal chelates. Instead of experimenting with the unstable radical-cation of rubrene, it seemed more advantageous to utilize Wurster's salts, which are stable radical-cations derived from aromatic diamines. For this family of compounds the overall reaction can be written as
+m
RNH2 + reductant - RNH2 + hv
The radical-cation of 1,6-diaminopyrene proved to be an example of a chemiluminescent electron acceptor fitting this general type of reaction
The over-all reaction for the second type of system studied can be written as
ML +(n+l) + reductant + ML +n + hv
x x
where M represents a metal ion and L a suitable ligand. The complexes successfully used in the present study all had ruthenium as the central metal ion (n=2). The ligands were 2,2'-bipyridine, 5-methyl-1,
3,5,6,8-tetramethyl-- 19
-1,10-phenanthroline (all having x=3) .
The aim of the present chemiluminescence research was the elucidation of the mechanism with respect to chemical reactions9
electron-transfer processes and the characteristics of the resultant excited molecular electronic states involved in the emission process. The chemiluminescence of Ru(II)(bipyr)3C12-hydrazine solutions was
chosen as a representative reduction reaction and i. considered iL detail.
The results of this research, combined with the earlier studies (19), indicate that electron-transfer reactions involving a potentially luminescent acceptor show great promise for discovering new chemiluminescence systems,
t Chemiluminescence from a ruthernium chelate has also been observed by J. P. Paris (unpublished studies, Juniata Colleg, Huntingdon, Pa., 1962).
- 20
II, Photoluminescence Introduction
Because the origin of the luminescence of Ru(bipyr)3C12 was
not clearly established, an extensive investigation was undertaken to elucidate the emission mechanismo Ruthenium is a group VIII
second-row transition element having a [Kr] 4d6 electronic configluration in the dipositive oxidation state. 2,2' Bipyridine is a well know
chelating agent and is fully discussed in the review by Brandt, et al. (3), Of the group VIII elements, cobalt, ruthenium, rhodium, osmium, iridium and platinum have been reported to form luminescent complexes
(9,55,32).
The first published account discussing the origin of the luminescence of Ru(bipyr)3C12 was by Paris and Brandt (35). These
authors used arguments similar to those of Jrgenson (23) to assign intense bands in the chelate absorption spectrum to d& wr*
charge-transfer transitions. Since the long wavelength band was attributed to a d~+ w* transition, they treated the emission as **+d
charge-trans-fer fluorescence. In his Ph.Do thesis, however, Paris (34) described the process as phosphorescence. An attempt to measure the emission lifetime yielded an upper limit of 100 microseconds. Paris assumed that the lifetime was abnormally short because spin-orbit coupling made the spin-forbidden transition more allowed. He also suggested that the tail on the long wavelength charge-transfer absorption band could be due to a singlet-triplet transition.
- 21
-Porter and Schlafer (37) referred to the emission as a d* * d
phosphorescence and Crosby et al.(10) concurred with the d* * d trans-ition type but concluded that the emission was fluorescence. The basis for Crosby's assignment was two low intensity long wavelength
absorption bands. Qne of these bands was assigned to a d + d* spin-allowed transition, and the other to the corresponding spin-forbifian transition. However, Palmer and Piper(33) pointed out that the spin-allowed d + d* transition for Ru(bipyr)3C12 would lie to the blue of the
long wavelength charge-transfer band and could not possibly account for the observed absorption. In a personal communication to Palmer and Piper, Crosby stated that the absorption band attributed to the
spin-forbidden d + d* transition was due to an impurity in their chelate preparation.
Subsequently, Crosby and Klassen(25) presented new evidence indicating a charge-transfer assignment for the luminescence. They synthesised a series of bis-(bipyridine) ruthenium complexes having widely different values of 10 Dq, In every case the emission started
at the long wavelength end of the charge-transfer absorption band. Consequently, the energy of thp emission did not follow the value of
10 Dq as would be expected for a d -+ d* transition. The long
wave-length tail in the absorption Rpectruim was assumed to be a vibronic component of the charge-transfer transition, They did not suggest an emitting state multiplicity. However, Crosby and Demas(ll) did propose phosphorescence on the basis of the four micro-second emission
lifetime at 77*K.
- 22
-The purpose of the photoluminescence investigation is to
clarify the reported data and to establish the luminescence mechanism. A charge-transfer spin-forbidden transition adequately explains all of
- 23
-III, Experimental
A. Chemicals
All inorganic and common organic chemicals were reagent grade or better and were used without further purification, unless otherwise noted,
All solvents were either Eastman "Spectru-grade" solvents or
Matheson, Coleman and Bell "Spectroquality" solvents and were used without further purificationo
1,10 -Phenanthroline and its 5-methyl, 5-phenyl, 5,6-dimethyl
and 3,5,6,8-tetramethyl derivatives were purchased from G. Frederick Smith Chemical Company and were used without further purification.
2,2' -Bipyridine was purchased from Eastman Organic Chemicals and was twice recrystallized from ethanol (m.p. 68-69*C, uncorrected,
reported 70*C)o
Pyrene was purchased from K and K Laboratories and was twice recrystallized from ethanol (m.p. 151-152C, uncorrected, reported
700C).
Rubrene was purchased from Aldrich Chemical Company and was vacuum
sublimed several times. The resultant product was pure as indicated by thin layer chromatography.
Ruthenium trichloride hydrate was purchased from Alfa Inorganic Company and was used without further purification.
Tris-(2,2'-bipyridine) ruthenium dichloride was purchased from G. Brederick Smith Chemical Company and was twice recrystallized from
- 24
-water. The final product was identified by Nuclear Magnetic Resonance (NMR) with respect to ligand type and number of ligands.
Tris-(l 10-phenanthroline) ruthenium dichloride and the correspond-ing complexes of the 5-methyl, 5-phenyl, 5,6-dimethyl and
3,5,6,8-tetramethyl derivatives were prepared by a modification of the method of Veening and Brandt(49)o 200 ml of water containing 002gm of RuCl3
OH20, 005 gm of appropriate ligand and 2.5 gms of hydroxylamine
sulfate was refluxed for two hours. The resultant mixture was cooled and extracted several times with benzene. The volume of the lqueous layer was reduced to about 50 ml by boiling. The solution was filtered hot and then cooled in an ice bath. The resultant precipitate was
recrystallized from watero
1.6-Diaminoyrene was prepared by a modified method of VOllman, et alo (52)o 10 gms of pyrene in 100 ml of glacial acetic acid, at 90*C, was mixed with stirring to 75 ml of nitric acid. A mixture of 1,4 - and 1,6-dinitropyrene immediately precipitated. This mixture was stirred for one-half hour at 100*C, cooled, and filtered. The precipitate was thoroughly washed with ethanolo To separate the two isomers, the above precipitate was added to 100 ml of pyridine, stirred for several minutes, filtered and washed. The pyridine insoluble
1,6-dinitropyrene was dried in a vacuum desiccator (m.p. 294-296 0C, uncorrected, reported 309C)..
1 gm of the purified 1,6-dinitropyrene was added to 20 ml'of alcoholo This solution was brought to a boil and 10 ml of an aqueous
- 25
-60% sodium sulfide solution x4qs slowly added. The mixture was refluxed for a few hours until it definitely turned a dark green color. After cooling, the solution was vacuum filtered in the absence of oxygen. The precipitate was washed twice with deoxygenated water and twice with
deoxygenated alcohol. The resultant 1,6-diaminopyrene was dried in a vacuum desiccator (mopo 218-220*C, uncorrected, reported 23200).
11-daLnipy~reene radical-salt was prepared by a modified method of Scott, et alo(42) 0.12 gmins of 1,6-diaminopyrene were dissolved in 1000 ml of xylene by stirring overnight. This solution was continually bubbled with nitrogen to prevent the oxidation of the diamine. A
solution of 0005 gms of bromine in 5 ml of carbon tetrachloride was dropwise added to the xylene solution until the diamine
fluorescence disappeared. The precipitate was vacuum filtered and washed with xyleneo The radical salt was dried in a vacuum desiccator.
B, Solutions
Ru(bipyr)3C12 is slowly air oxidized to the tripositive state
when it is in a 50% sulfuric acid solution. Thus, all such solutions were prepared using previously deoxygenated solvents.
Ru(bipyr)3Cl2 decomposes over a period of several days in an
EPA solvent (5 parts diethyl ether; 5 parts iso-pentane; 2 parts ethyl alcohol by volume). The product was not identified. All measurements with this solvent were made within 24 hours of preparation; no
- 26
-The 1,6-diaminopyrene radical salt slowly reacted with water
to form an unidentified producto All solutions containing this salt
were kept as dry as possible, and all measurements were taken within
an hour of solution preparation.
Co Spectral Instrumentation
Spectrophotometer - Absorption spectra were recorded using a Cary Model 14 spectrophotometero
Fluorometer - Emission spectra were recorded with a fluorometer constructed from Aminco-Building Blocks. Figure 11-1 shows the component configuration and optical path, The monochromators are Aminco Grating Monochromators (4-8401) equipped with variable slits
(D42-61041) and mounted on an optical bench (D65-61041). The
excitation monochromator is blazed for 3Wdmumdhile the emission
monochromator is blazed for 500mu, The sample chamber has provisions for right angle excitation (C111-61041), front surface excitation (C66-62140) and phosphorescence (C195-61041).
The detector is an EoMoIo 9558 QA photomultiplier. The photo-cathode is of a tri-alkali type (S20) which in conjunction with the
quartz window yields a spectral range of 165 to 850mu. The applied voltage is 1250 volts across the dynode chain, which for the
partic-ular tube employed yields a sensitivity of 300 amps/lumen. The dynode
chain is a linear configuration with all of the resistors being 200 K ohm except for a 470 K resistor between the tenth and the eleventh
- 27
-FIGURE III-1
Fluorometer Constructed from Aminco Building Blocks Top View Key B - Optical bencho C - Thermoelectric cooler. D - Detector. E - Emission monochromator. F - Fluorescence cell. G - Grating. L - Lamp.
M - Front surface mirrorso S - Slit mechanism
- 29
-dynodeso Instead of a resistor, a 150 volt Zener diode is used between the photocathode and the first dynode. No capacitors were used in the dynode wiring.
The photomultiplier is powered by a Kepco regulated d.c. supply, Model ABC 2500M. At 1000 volts the aoco ripple is about 20 millivolts. This is a sufficiently low aoc. component for this particular applicat-ion. The supply is connected for negative high voltage per the manual and was modified by replacing the provided banana plug outlets with
chassis BNC connectors.
The photomultiplier temperature is held at -30*C by a thermo-electric junction. The particular cooling chamber used is a Products
for Research Model TE-104, The dynode assembly mentioned above is designed to mate with the cooler and was purchased from the same
corporation. The chamber was mounted directly to the optical bench and alligned with the light beam exciting the emission monochromator.
The output from the photomultiplier anode was filtered by the LRC network shown below:
IN
Aour
The amplifier used is a Hewlett Packard Model 412-A-VTVM. The input impedance was utilized as the load resistor. The amplifier output, connected to the recorder, was one volt full-scale regardless
- 30
-of the range setting.
The noise level of the fluorometer is quite lowo With an input impedance of 10 megohms the photomultiplier dark voltage is usually about fifty microvolts.
The wavelength driving and monitoring systems are modifications of those used by Amico The electrical schematic for the wavelert h driving system is shown in Figure III-2A. The scan switch allows the motor to be driven clockwise (increasing the wavelength), counter-clockwise (decreasing the wavelength) or to be turned off. The speed adjustment controls the rate (in mu/sec) that the spectrum is scanned. The jog switch bypasses the speed adjustment and operates the motor at its fastest rate. The electrical schematic for the wavelength
monitoring system is shown in Figure III-2Bo The grating is mechan-ically coupled to the 30 K ohm variable resistor. The zero adjust is a ten-turn variable resistor. The voltage output to the recorder is the potential difference between the two variable resistors. The gain (mu/in) adjustment is made with the recorder.
The recorder is a Hewlett Packard Model 7005B. The input impedance is one megohm on both channels (x and y) for the ranges in use.
Three lamps are currently available for use with the fluorometer; Xenon, Mercury-Xenon, and Quartz-Iodine. The Xenon and
- 31
-FIGURE 111-2
A - Wavelength Driving System B - Wavelength Monotoring System
~'-i---lY--ru"---r---~----
~-~V
B
500
K
90 v
50
K
ZERO
JOG
0AN
CW
II - I .- --.--- -- I C. -.- - - , _ . ; . _ 1- 33
-Mercury-Xenon lamps are those supplied by Aminco (416-992 and 416-993 respectively). The lamp housing (C188-61041) and the lamp power supply (D2-62000) are also supplied by Amincoo The Quartz-Iodine lamp is a 400 watt Sylvania product (400 T4Q/CL/F). The power supply for this lamp is an 8 amp Variac connected to the house line through an 8 amp Sola constant voltage transformer. The lamp is operated at 110 volts. Both sets of lamps are cooled with forced air when operating.
Lifetimes-Fluorescence and phosphorescence lifetimes were measured on a spectrometer constructed from a TRW Nanosecond Spectral Source System. The system is comprised of a Model 31A Nanosecond Spectral Source, Model 32A Decay Time Computer, Model 33A Photomultiplier Unit, Model 34A Fluorescence Excitation Chamber, and two Model 35A Relay Lens Assemblies. The signal, measured across a 50 ohm load resistor, is pre-amplified with a Tektronix Model lAl vertical plug-in and displayed on the upper beam of a Model 556 Oscilloscope. The
Decay Time Computer output is pre-amplified with a Tektronix Madel B vertical plug-in and displayed on the lower beam of the same oscillo-scope . Fluorescence lifetimes as short as 1.7 nanoseconds can be obtained directly from the Decay Time Computero
A phosphorescence attachment was made to fit into the Model 34A
Fluorescence Excitation Chambero To facilitate this modification, the Model 35A Fluorescence Sample Holder was removed and replaced with a
piece of sheet metal so constructed as to hold the Aminco phosphori-meter dewar assembly, When measuring phosphorescence lifetimes of
- 34
-compounds emitting above 500mu, an RCA 7265 photomultiplier was used to detect the emission. The photocathode of this tube is of the tri-alkali type (S20), This tube was held in a Pacific Photometric Instruments potted cryogenic housing Model 77. The detector assembly
could then be cooled to dry ice temperatures, reducing the dark current. The photomultipler was powered by a Kepco regulated doc, supply, Model
ABC 2500M.
When measuring phosphorescence lifetimes longer than 100
nano-seconds, the Decay Time Computer was not used. In this case, the photomultiplier output was displayed on the Model 556 oscilloscope and recorded with a Tektronic Model C-12 camera and Polaroid Type
107 film. The pulsewidth of the source was insignificant in comparison to such phosphorescence decays, and simple log intensity-versus-time
plots were used to calculate the lifetimes.
Chemiluminescence-Since the chemiluminescence of interest is
short lived its spectral distribution must be measured under flow
conditions. The reactants were placed into two 200 ml syringes which
were mounted on a Harvard Appartus Model 600-2-200 syringe pump. The outlets of the syringes were connected with teflon tubing to a special mixer. Figure 111-3 shows the "T" mixer used to introduce the chemiluminescing solution into the fluorometer cell compartment. The mixer is constructed from 8 mm glass tubing having a 2 mm bore. The special feature of the mixer is the platinum gauze which is glass blown directly into the capillary. The gauze produced a turbulent flow _U~ _li_
- 35
-FIGURE II-3
"T" Mixer - Side View
A - Input for reagent Ao B - Input for reagent B. G - Platinum gauze.
0 - Output for reaction products.
V - Cross section of mixer viewed by the fluorometer.
0000 *00
B
I
IG
000000Gf".
~ ~
* 0 000 0 0 0 000- 37
-which greatly enhanced the mixing. While the solution was flowing, an emission spectrum was recorded on the fluorometer. Since flow arti-facts are frequently observed, the true spectrum was determined from a composite of several runs.
Do Temperature Control
Above ambient-For spectral measurements above ambient, the cell shown in Figure 111-4 was employed. Temperature control of the thermostating liquid was achieved with an Instrumentation Laboratory, Constant Temperature Bath Model 127. Temperatures were measured with a mercury thermometer placed in the thermostating bath.
Below ambient-a cryostat capable of maintaining constant temperatures from,300* to 68*K was constructed. The entire unit, shown in Figure 111-5, is mobil, and the cryostat can be operated in the spectrophotometer, fluorometer and the nanosecond spectral source sys temo
An Air Products Cryo-tip nitrogen refrigerator Model AC-1-110
is utilized having a Spectroscopy Shroud WMX-1 modified to accomodate one-centimeter square Beckman cells (described in Section III G.3). The cell holder is specially made for our application and is shown in Figure 111-6. The shroud windows are Thermal American Spectrosil A optically flat quartz discs, 13/4 inches in diameter and 1/8 inch in thickness.
- 38 -FIGURE 111-4 Thermostating Cell Be ckman ce ll Thermostating liquid Mercury thermometer. Thermostating liquid Rubber stoppero Test tube. inlet, outlet.
- 40
-FIGURE 111-5
Constant Temperature Cryostat
Key
C - Cryostat with the spectroscopy shroud. D - Diffusion pump.
E - Electrical control panel. F - Forepumps.
G - Gas control panel.
H - High pressure flexible nitrogen lines. J - Lab jack.
M - Medium pressure flexible nitrogen lines. R - Recorder.
a.41
I
SI
-*Ng.
- 42
-FIGURE 111-6
TOP
TO
TO
FIT
BECKMAN CELL
S12 x 12 x
46 mm
.218
-REAR
35mm
a
2
I2
FRONT
-- --- -I "'"1"'-'' 1' ---ICL" -' -~.---'-'--'~--' .'~ ;Ci'- "~'~--~~;~ . -I ...--.- I.--.~~.--- --- --II~
- 44
-Products Model OC-11 Gas Control Panel, which is connected to the cryostat by flexible gas lines. This panel is modified by the replacement of the provided high pressure shut-off valve with a Whitey microregulation valve Model 22-R54-A. The source of gas is a high pressure manifold connected to four tanks of prepurified nitrogen. The output of this manifold is attached directly to a high pressure regulator, which drops the nitrogen to 200-1500 pounds per square incho The medium pressure nitrogen is carried in 1/4 inch copper tubing to several convenient locations in the laboratory. The gas is then transferred to the Control Panel by a Swagelok flexible metal hose.
The shroud vacuum is maintained by a Welch Duo-seal vacuum pump #1405B and a Consolidated Vacuum Corporation MCF-60 two inch water cooled diffusion pump #8419. Since the volume of the space to be evacuated is small, the shroud can be slowly "roughed" through the operating diffusion pump. A Vactron Lab tquipment Bellows Valve CVB-50L-Q separates the cryostat from the vacuum system, facilitating sample changes.
A second vacuum pump, Welch Duo-seal high capacity #1397B, is used to evacuate the nitrogen lines. It also provides a vacuum for the low pressure side of the refrigerator when operation below 80*K is desired.
Temperatures are determined by use of a calibrated
- 45
-The voltage from this device, if measured with a Leeds and Northrup
Type K-3 Universal Potentiometer, is accurate enough to determine the temperature to within one degree. Qualitative observation of temper-ature changes is possible when the thermocouple output is displayed on
a Varian Model 10-A strip chart recorder.
E. Kinetic Measurements
1i Slow reactions
For slow reactions the reagents were mixed by stirring and
then transferred to spectrophotometer cell. The Cary 14 was utilized by operating the instrument so that it displayed the absorption at a
particular wavelength as a function of time. Attempts to monitor
solution emission as a function of time failed. 2. Fast reactions
Basic Instrumentation-The basic instrumentation used for studying fast reactions was the Durrum-Gibson Stopped-Flow
Spec-trophotometer. The principles of operation of this instrument are set forth elsewhere.(6) Zero offset, filtering and triggering networks
were ccutructed per the Durrum Manual.
Output-For very fast reactions the signal from the photomultiplier is amplified by a Tektronix Type 2A63 differential plug-in and is displayed on a 564 Storage Oscilloscope equipped with a
Type 3B3 time base. The data are then recorded with a Tektronix Model C-12 camera and Polaroid Type 107 film.
~---L~---
S46-For moderately fast reactions the signal from the photomultiplier is amplified by a Hewlett Packard Model 17501A Input Module and
displayed on a Model 7100B strip chart recorder.
Chemiluminescence Mode-To measure chemiluminescence intensity, the input to the Durrum Mirror Box must be taped shut so
that room light is not detected. The output is the photomultiplier
signal as a function of time.
Absorption Mode-The light source for the absorption mode
is the 400 watt Sylvania Quartz'Iodine lamp described in conjunction with the fluorometer. The lamp, operated at 100 volts doc., is powered by a series connection of Technipower Model L80-12M and L20-L2M
regulated power supplieso The monochromator is a Jarrel Ash 0.25
Meter Ebert, Model 82-40O The monochromated light is adjusted so that
it properly enters the Durrum Mirror Box, With no absorption, the voltage applied to the photomultiplier is adjusted for a full-scale
deflection of the recording device. The output is the photomultiplier signal as a function of time,
F. Miscellaneous Instrumentation
Electrochemical-Current-voltage curves were measured by
use of Heath Kit Model EUA-19A operational amplitiers and a Model
EUA-19-2 polarpgraphy module. The results were displayed on a Houston Model HR-100 x-y recorder.
- 47
-unless otherwise mentionedo It was separated from the sample solution by means of a vycor plug. For aqueous solutions, the indicator
electrode was contructed from a wax impregnated graphite rod. For non-aqueous solutions a platinum electrode was employed. The counter electrode was platinum and was separated from the bulk of the solution by a glass frito
Nuclear ,agnetic Resonance-All nuclear magnetic
resonance spectra were recorded on a Varian Model A-60 NMR spectro-meter.
Infrared-All infrared spectra were recorded on a Perkin Elmer Model 237B infrared spectrometer.
Electron Paramagnetic Resonance-All electron paramagnetic resonance spectra were recorded on a Varian Model 4502 EPR spectro-meter equipped with a 9 inch magnet.
Absolute Fluorescence Spectra-The absolute emission spectra for compounds emitting at wavelengths lower than 600mtu were recorded on a Turner Spectro Model 210.
G. Procedures
1. Fluorometer calibration
Wavelength-The emission monochromator can be calibrated for wavelength accuracy by placing a mercury pen lamp in the sample chamber and measuring its emission spectrum. The excitation monochro-mator can be calibrated by placing a fluorescent solution in the sample
- 48
-chamber and running an excitation spectrum using the Mercury-Xenon lamp.
Bandpss-The bandpass of the monochromators can be
identified with the half-width of any spectral line. Such results must be corrected for other wavelengths since the bandpass is a cosine
function of the grating angle, The table below simmarizes the results for the 3650A mercury line.
Slitwidtmm) Bandpas( Slitwidth(mm) Bandpass(A)
1/8 10 3/4 50
1/4 30 1 80
1/2 40 2 140
Emission-The response of a fluorometer to emitted light varies considerably as a function of wavelength. The intensity of fluorescence, as measured, can be computed by the following equation.
F(h,a )" s(A) -- I(X)-[I-T(A( ) 1] III-1
where F (X,X') is the measured fluorescence intensity; S(A) is the wavelength dependent instrumental sensitivity;
*
is the quantum yield of fluorescence; I (Xi) is the intensity of the exciting wavelength of light; T (Xi) is the transmission of the fluorescing solution atthe exciting wavelength; and k is a wavelength independent quantity that depends upon the fraction of the total emitted quanta that arrive
at the detector.
If the total quanta emitted from a fluorescent substance are denoted Q, then the spectral distribution will be dQ/dX if the
- 49
-is linear in frequency, the spectral d-istribution -is then dQ/dX, which is equivalent to (dQ/dX)oX2 (36).
To determine the wavelength dependancy of S(X), the photo-multiplier-monochromator combination must be calibrated. One of the easiest methods employs a U.So National Bureau of Standards lamp, which when properly operated emits energy according to Planck's Blackbody equation (24,45)o
The output of the lamp, from 380 to 770utu can be calculated by the equation,
E()= (.56)5(expc,/0.56 T]-l) 111-2
X
5(exp [c2 /XT]-1)2c
where c2 is a constant provided with the lamp; Tc is the color
temperature at which the lamp is operated; and 0.56 is the normalizing wavelength in microns, To convert this energy output to quanta, it is necessary to multiply by the wavelength since,
E total = (number of quanta) o hc/X
Once the spectral response of the fluorometer to the standard lamp has been measured, the sensitivity can be calculated. Since the
instrument is operated at finite bandpass, it is usual to express the response as dR/dA. The calculated lamp output then becomes dQ/dX,
and the sensitivity and fluorescence intensity are likewise modified. S(A) is then calculated in a straightforward fashion,
S
dR/dX
111-3
S()= dIII-/d
dQ/dA
- 50
-Operationally, the light from the NBS lamp is allowed to illuminate a microscope slide coated with magnesium oxide(48). This slide is placed at 45* in the sample chamber and a spectrum is recorded from the reflected lighto Several experimental details must be taken into account.
a) The light is very intense and the voltage on the photomultiplIer will have to be reduced so that the signal can be recorded. As
indicated in the Section III-C Fluorometer discussion, a Zener diode should be placed between the photocathode and the first dynode. This assumes that the characteristics of the tube do not change as the supply voltage is lowered,
b) The magnesium oxide layer is formed by burning a strip of magnesium metal and allowing the smoke to deposit on a clean glass surface. First, treat the strip with acetone to remove any rolling oil that may be presento Then ignite the strip with burning ethanol,
since this will not contaminate the smoke or strip 0 Put two separate
layers on the glass plate, one on top of the other,
c) The reflectivity of the magnesium oxide is as follows:
X % REFLECTED X % REFLECTED 240 96 400 97.4 260 94 420 97.7 280 91 440 97.9 300 92 460 98.2 320 93 480 98.4 340 93+ 500 98.6 360 94 600 99.4 380 95 700 99.7
- 51
-d) For any instrument where polarization is important, use two reflective surfaces. Let the NBS lamp illuminate one surface which in turn illuminates the second surface. The instrument will then monitor the light reflected from the second surface.
e) Be positive that any area the photomultiplier "sees" is flat black, excepting the illuminated magnesium oxide surface.
f) A check should always be made to see how valid corrections made with one slit width are for another slit setting. Remember that dR/dX implies a finite slit width.
g) Also remember that the bandpass of a grating monochromator varies as a function of the cosine of the grating angle. if the standard lamp varies as a function of bandpass, this affect probably should be taken into account.
Figure 111-7 shows the NBS lamp output in units of energy and quanta, the measured response curve and the calculated sensitivity. All of the data are normalized to unity at 560mp. It is to be noted
that the value of dR/dX did not change upon going from 1/8 mm
slitwidth to a 1 mm slitwidth. Therefore, no correction was made for bandpass or grating angle. No correction was deemed necessary for the wavelength dependence of the magnesium oxide reflection. Figure 111-7 also shows the calculated monochromator efficiency curve. These latter
data were determined by dividing the calculated sensitivity by the published response curve for the photomultiplier (13). The result
agrees with Aminco's data for their 500qpulblazed grating.
FIGURE 111-7
Detector Calibration Curves
Key
E - NBS lamp output in energy. M - Monochromator efficiency.
Q - NBS lamp output in quanta. R - Measured responseo
3.5
U) - 1.5 0d* / 1 / 0.5' E/400
600
600
Wavelength
(m
p)
--- '--.."~r~-- -- -- ;--- ---- -" --- - ~--E-~--- 54
-considerably as a function of wavelength, The source output can be determined by use of the following consideration.
For the case of a fluorescent substance having a wavelength independent quantum yield in solutions where T(A')< 1% the intensity of fluorescence, as measured, can be computed by the following equation.
F(X,A)=kos(X) o°I(X v) 111-4
If an excitation spectrum is measured for such a case, the fluores-cence intensity at any fixed emission wavelength then becomes,
F ( )=koI(X') 111-5
It is then possible to directly determine I(A~) since it is related only by a constant to the measurable FX (').
-2
Operationally, a 2 x 10⁻² M solution of Rhodamine-B in ethylene glycol is utilized (53,47,54). This solution has a quantum yield independent of A' In a 1 mm cell such a solution will absorb above 2.0 at all wavelengths lower than 600mu.
A front surface excitation spectrum is used to measure F (!) and a 6 40mu ,4gh-pass filter is inserted before the emission mono-chromator to insure that no scattered source output reaches the photomultiplier.
Figure 111-8 shows the measured output of both the Xenon(-and -1
Quartz-Iodine lamps. It is to be noted that the Xenon lamp output did change upon going from 1 to 1/2 mm slitwidth. However the Quartz-Iodine lamp output did not changeo No correction was made for the
55
-FIGURE 111-8
Spectral Distribution of Lamps
X - Xenon lamp, 1mm slitwidth. Q - Quartz-iodine lamp
4
ca
X
2-350
450
550
Wavelength (m
p)
~-~ L~IL __~C~ --- _ __ '';' "'' - .~ .- ... c ---,- I~. -- .... --- 57
-presence of the front surface mirror in the measuring configuration. Calibration check-The fluorescence spectrum of a dilute solution of fluorescein was measured, at the same excitation wave-length, on both the Aminco and the Turner Spectro Model 210. The Aminco data were corrected for instrumental sensitivity and normalized
to match the Turned spectrum at the emission maximum. Both curves are shown in Figure III-9. The match is very good except at long
wavelengths where the Turner is known to overcompensateo It is thus
shown that the calculated Aminco sensitivities are correct.
2. Quantum Yield
Wavelength Independent-By integrating the combinations of Equations. III-1 and III-3 the following expression for relating the area under the corrected emission curve to the quantum yield can be derived0
A d_ --dF/dA =ko*I(A')*[1-T(A1) ] III-6 dX ds/dX
This equation is true as long as 4 and k are independent of X.
If the same excitation wavelength is used for both the unknown, u, and the standard, s, the following equation can be derived from Equation 111-6.
Au ,1 [1-T ]
-- = III-7
A s C. [l-Ts ]s* s
For all the quantum yields measured, rubrene was used as the standard. In dilute (T(X') >99%) n-hexane solutions, this compound
- 58
-FIGURE 111-9
Fluorometer Calibration Check
- -. Turner fluorescein spectrumo
7
005-0
I
r
0e-
o
0*3-0 0 0 0
I0
IO
I 00
0 0500
600
700
Wavelepgth (mp)
0- 60
-has a quantum yield of unity. Equation III-7 then simplifies to
= A" [1-Ts]
Aso [-lTu] 111-8
When T(A') < 80%, it is best to account for the change in the
intensity of the exciting light as it traverses the sample cell(17). The equation for the quantum yields, so corrected, becomes
SA o[l-Tr]!oF
-. T
Tu]IFu
111-9where F = exp (-abc), and "a" is the molar absorptivity, b is the distance between the front of the cell and the point of observation, and c is the molar concentration.
For all solutions requiring this correction, a 1 mm mask was placed in front of the sample cell so that b=1/2 and F=exp(-1/2" absorption) ,
Wavelength Dendent-Equation 111-4 can be used to
determine the quantum yield as a function of exciting wavelength. By monitoring the fluorescence at a fixed wavelength, for a solution where T (A') < 1% over all,of the wavelengths of interest, Equation 111-4 is reduced to
( ')=k ( III-10
where F (A') is the measured excitation spectrum and I (X') is the lamp intensity.
3. Deoxygenation and cells
All spectal measurements, except those in the ultra-violet, were performed using Beckman one-centimeter square pyrex
-
61
-cells modified by the addition of 8 mm pyrex 10/30 outer ground glass joints. All solutions were deoxygenated in these cells by bubbling with nitrogen. The apparatus used is shown in Figure
III-10. The nitrogen, pre-saturated with solvent, is rapidly flowed for several minutes to flush the system free of oxygen. Then the bubbling capillary is lowered through stopcock Sl into the sample solution. All solutions are bubbled for 15 minutes. The capillary is removed through stopcock Sl, which is then closed. The solution is frozen solid with liquid nitrogen and stopcock S2 is opened to
the house vacuum. The stems on the Beckman cells are then sealed by heating and collapsing the tubing.
tA comparison with vacuum degassing demonstrated that the deoxygenation method described above was adequate for all of the measurements of
- 62 -FIGURE III-10 Deoxygenation Apparatus Ke B - Capillary bubbler, C - Beckman cell,
J - 10/30 ground glass jointo
N - Nitrogen inlets, from solvent bubblers. S - Sealed section of the stem.
Sl - Two-way stopcock.
S2 - Three-way stopcock0
V - Vacuum inlet.
SL~---S2
SI
-- ~rr -- -I- 64
-IV. PHOTOLUMINESCENCE STUDIES
A. Results
1o Absorption and Emission Spectra
Chelate spectra-The room temperature absorption and emission spectra of the Ru(bipyr)3C12 complex in water are shown in Figure
IV-1o Absorption bands appear at 5.40, 4.80, 4.20, 4.00, 3.50, -l
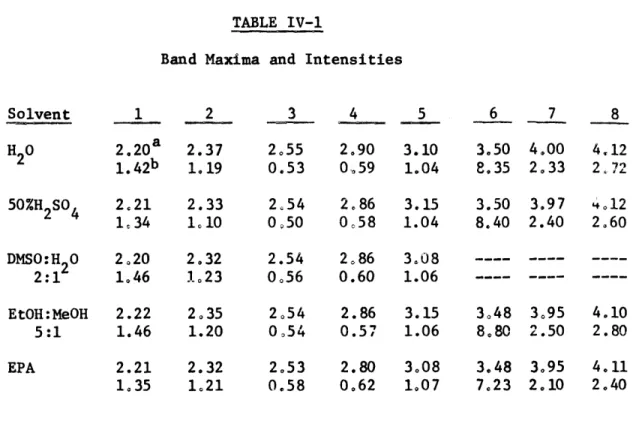
3.10, 2.90, 2.55, 2.37 and 2.20p . The emission maximum appears at 1.60p-1, No large solvent effects were observed on either the locations of the maxima or the intensities of the bands. The spectral data for several solvents are summarized in Table IV-1.
Low temperature absorption and emission spectra of the chelate in an ethanol: methanol (5:1) glass are shown in Figure IV-2. The
-1
most intense absorption band appears at 2.20 while that for
emission appears at 1.70u- . Both the emission and absorption bands exhibit a regular vibronic progression; the spacing of the absorption
-1 -1
band is ca. 0.17I while that of the emission band is ca. 0.13pI . 2,2'-Bipyridine spectra-Figure IV-3 shows the absorption and emission spectra of 2,2'-bipyridine in 50% sulfuric acid. in this medium, both nitrogens are protonated and the electrical properties will be similar to those found in the coordinated compound. Absorption bands appear at 5.10, 4.40 and 3.45-1. o The fluorescence maximum
appears at 3.00 - and the phosphorescence maxima appear at 2.25 and
-1
- 65
-TABLE IV-1
Band Maxima and Intensities
1 2 3 4 5 6 7 8 2.20a 2.37 2.55 2.90 3.10 3.50 4.00 4.12 1.4 2b 1.19 0.53 0,59 1.04 8,35 2.33 2,72 50%H2SO4 2,21 2.33 1.34 1,10 DMSO:H 0 2.20 2.32 2:1 1.46 1,23 EtOH:MeOH 5:1 EPA 2.22 2.35 1.46 1.20 2.21 2.32 1,35 1.21 2,54 2.86 3.15 3.50 3.97 4.12 0,50 0,58 1.04 8.40 2.40 2.60 2.54 2.86 3.08 0.56 0.60 1.06 2054 2.86 3.15 3.48 3.95 4.10 0,54 0.57 1.06 8.80 2.50 2.80 2.53 2.80 3.08 3.48 3.95 4.11 0.58 0.62 1.07 7.23 2.10 2.40 -1 a) Band maxima in
b) Band intensities in liter/mole-cm
Solvent H20
66
FIGURE IV-1
Absorption and Emission Spectra of Ru(bipyr) 3Cl 2
-4
A - - Absorption, xl-4O M in H20, icm path length.
______-4
B - - Absorption, 5x10⁻⁴M in H20, lecm path length.
-4,
--- Emission, 5x10 M in H20.
Emission is corrected for photomultiplier-monochromator response, and is in relative units.
- -r
-1.5
A
B
1.0
o0.5
o
I
I
I
I
I
I
I
5
4
3
2
Frequency
(p')
I~--- 68
-FIGURE IV-2
Low Temperature Absorption and Emission Spectra of Ru(bipyr) 3C12
Absorption and --- emission spectra of Ru(bipyr)3C12
in an ethanol:methanol (5:1) glass at 77*K. The luminescence is
,O-
A
SI
1I
1
I
,
126
1
F~
qI
1
I
I
\
4I
I
2.6
2.2
1.8
1.4
Frequency
(
-- )
I--- 70
-FIGURE IV-3
Absorption and Emission Spectra of 2,2'-Bipyridine in 50% H2SO4
Key
_______-5
Absorption, 205x10-5M, 1cm path length, room temperature.
-5
--- Fluorescence, 2.5x10⁻⁵M, 77*K. ... 0 Phosphorescence, 2.5x10⁻⁵M, 77K
Both emission spectra are corrected for detector-monochromator response, and are in relative units.
5
4
3
2
Frequency (I')
- --I---~L
-- 72
-It was found that the half-width of the ligand band at 3.450-1 is temperature dependent. Figure IV-4 shows this band measured at
o -1
both room temperature and 77 K. The half-width was 0O17p- at
-1 o
room temperature and 0.13p-1 at 77 K.
Infrared spectra-The infrared spectra of 2,2'-bipyridine and the chloride salt of its ruthenium(II) chelate are shown in Figures IV-5 and IV-6, respectively. Both spectra were recorded utilizing potassium bromide pellets. A comparison of the two curves indicates a one-to-one correspondence between most of the ligand and chelate bands. However, at least two new bands are evident in the chelate spectrum that are not in the ligand spectrum. They are located at
-1 -1
1450 cm and 1310 cm o
2 Temperature Dependent Spectral Properties
Spectral Data-Both the luminescence quantum yield and life-time of Ru(bipyr)3C12 are strongly temperature dependent. Figure
IV-7 shows the lifetime as a function of temperature in two different glass forming solvent mixtures - ethanol: methanol and 50% H2 SO4o
The temperature at which the large increase in lifetime occurs
corresponds visually to glass formation. A comparable increase does not occur in the quantum yield, which remains essentially the same before and after glass formation. This result is shown in Figure IV-8 for an EPA solvent,
- 73
-FIGURE IV-4
Temperature Dependence of the Half-width of the
-i
Protonated Ligand 3.45 p- Band
Key
- Absorption at room temperature Absorption at 77°Ko
3.6
3.4
3.2
3.0
Frequency
(/-')
V
-C 0 CL oU
- 75
-FIGURE IV-5
Infrared Spectrum of 2,2'-Bipyridine KBr Pellet
Frequency
(cm
-)
- 77
-FIGURE IV-6
Infrared Spectrum of Ru(bipyr)3C12
1800
1400
1000
Frequency (cm
l)
~~-ii~~i~OW
-011--y C-~I-~~ L IL.I( C L.~
~
_~
C--- 79
-FIGURE IV-7
Dependence of the Ru(bipyr) 3C12 Lifetime on Temperature
Key
eoe Ethanol:methanol (5:1) AAAAA 50% H2So
-S
I
I
I
I
150
200
250
Temperature (OK)
0a)
a)E
a) -J100
I I ~ ~ ----~ -- --- ---II~:- ~----~-~c~----..
---
- -13~ -~ ~- -- --;r;;= O- 81
-FIGURE IV-8
Dependence of the Ru(bipyr) 3C12 Quantum Yield
and Lifetime on Temperature
Keyl
ooooo Quantum yield.
AAAAA Lifetime.
Both in EPA solvent.
0
o
00
Ol
001
0
'O
00
V"0
6-0
~i- ---XP-~ _~_~ __~__ ___~___ I I II ' II -I 11i "v -' ... ... , ,Ill i ... ] ... -°- 83
-Mathematical Treatment-The temperature dependence of the luminescence quantum yield and lifetime, at temperature above glass
formation, is treated mathematically in a manner analogous to that outlined by other workers (2, 28). The reciprocal of the lifetime
can be defined as the sum of all rate constants for reactions depleating the concentration of the excited state responsible for emission. This can be formulated as,
1/T=k + E k' + E k exp (-AH m!T) IV-i
e n do m dm m
where ke is the rate constant for the emission process; k'dn is the rate constant for the nth temperature independent non-emissive process; kdm is the frequency factor for the mth temperature dependent non-emissive process; and AH is the activation energy for the mth temperature dependent process. The quantum yield can be defined in a similar mannero
If the above mathematical analysis is correct, the value of ke should be determinable at any temperature by dividing the luminescence quantum yield, o, by the lifetime. The values of t, 4 and ke are shown in Table IV-2 for an EPA solvent, The value of ke is constant
5 -1
at 2.9 x 10 sec , except for 80*K where the solvent glass formation has started.
If it is assumed that only one temperature dependent process is operative, and if we define I/r'-Eke+k'dn,' then the Arrhenius equation can be derived from Equation IV-i, as,
- 84 -Temperature Dependance T(K) 285 275 265 255 245 235 225 215 205 185 148 103 80 00270 0.316 0.333 0 360 0.388 0.407 0.418 0 452 0.467 S0515 0.543 00637 0.746 TABLE IV-2
of the Luminescence Quantum Yield and Lifetime*
r (9 sec) 0.926 1.07 1.14 1.24 1.36 1.42 1.46 1.53 1.57 1.60 1.87 2.11 3.75 ke (sec- x 10 -5) 2.9 3.0 2.9 2.9 2.9 2.9 2.9 3.0 3.0 3.2 2.9 3.0 2,0 -5 5 x10 M *Ru(bipyr) 3C12 in EPA, ~I_ __ __ _ _
- 85 --AH
log(l/T-l/T')=- -
+
IV-2An analogous procedure yields the equation
loA H + iV-3
e
where 0 is the overall quantum yield of luminescence; and 4'z
ke/(ke+Ek' dn)
Arrhenius Plots-An Arrhenius plot of the lifetimes using Equation
IV-2, yields both the energies of activation and the frequency factors found in Table IV-3, All of the data in this table, except that for EPA, were obtained at temperatures above ambient, where the rates
of the temperature independent processes were comparatively small. Figure IV-9 shows a sample plot for a DMF solvent.
For EPA, the data were obtained at temperatures below ambient, and the values of the temperature independent parameters (T' or 4')
were emperically established so that the data best fit a linear plot.
Figure IV-10 shows a plot of the corrected data for the EPA solvent. 3. Wavelength Dependence of the Quantum Yield
The quantum yield luminescence for the Ru(bipyr) 3CL2 complex was measured as a function of exciting wavelength at 77'K. Figure IV-11 shows the Quartz-Iodine lamp output and excitation
spectra for a concentrated solution of the chelate in an ethanol:
Methanol glass. Three separate curves are shown:
a) the capillary masked in a front surface excitation config-uration. This spectrum matches the lamp output quite well.


![Risiko- & [und] Schutzfaktoren der psychischen Gesundheit humanitärer Einsatzhelfer : eine systematische Literaturübersicht](data:image/gif;base64,R0lGODlhAQABAIAAAP///wAAACH5BAEAAAAALAAAAAABAAEAAAICRAEAOw==)