HAL Id: hal-00602304
https://hal.archives-ouvertes.fr/hal-00602304
Submitted on 22 Jun 2011
HAL is a multi-disciplinary open access
archive for the deposit and dissemination of sci-entific research documents, whether they are pub-lished or not. The documents may come from teaching and research institutions in France or abroad, or from public or private research centers.
L’archive ouverte pluridisciplinaire HAL, est destinée au dépôt et à la diffusion de documents scientifiques de niveau recherche, publiés ou non, émanant des établissements d’enseignement et de recherche français ou étrangers, des laboratoires publics ou privés.
Sophie Monnot, Nadine Gigarel, David C Samuels, Philippe Burlet, Laetitia
Hesters, Nelly Frydman, René Frydman, Violaine Kerbrat, Benoît Funalot,
Jéléna Martinovic, et al.
To cite this version:
Sophie Monnot, Nadine Gigarel, David C Samuels, Philippe Burlet, Laetitia Hesters, et al.. Segre-gation of mtDNA Throughout Human Embryofetal Development: m.3243A>G as a Model System. Human Mutation, Wiley, 2010, 32 (1), pp.116. �10.1002/humu.21417�. �hal-00602304�
For Peer Review
Segregation of mtDNA Throughout Human Embryofetal Development: m.3243A>G as a Model System
Journal: Human Mutation Manuscript ID: humu-2010-0326.R1 Wiley - Manuscript type: Research Article
Date Submitted by the
Author: 28-Oct-2010
Complete List of Authors: Monnot, Sophie; Paris Descartes University; INSERM, Unit U781; Necker Hospital, Medical Genetics
Gigarel, Nadine; Necker Hospital, Medical Genetics
Samuels, David; Vanderbilt University Medical Center, Molecular Physiology and Biophysics
Burlet, Philippe; Necker Hospital, Medical Genetics
Hesters, Laetitia; Antoine Beclere Hospital, Reproductive Medecine and Obstetrics
Frydman, Nelly; Antoine Beclere Hospital, Reproductive Medecine and Obstetrics
Frydman, René; Antoine Beclere Hospital, Reproductive Medecine and Obstetrics
Kerbrat, Violaine; Antoine Beclere Hospital, Reproductive Medecine and Obstetrics
Funalot, Benoit; Necker Hospital, Medical Genetics
MARTINOVIC, Jéléna; Assistance Publique - Hôpitaux de Paris, APHP, Genetics
Benachi, Alexandra; Necker Hospital, Obstetrics Feingold, Josué; Necker Hospital, Medical Genetics
Munnich, Arnold; Paris Descartes University; INSERM, Unit U781; Necker Hospital, Medical Genetics
Bonnefont, Jean-Paul; Paris Descartes University; INSERM, Unit U781; Necker Hospital, Medical Genetics
Steffann, Julie; Paris Descartes University; INSERM, Unit U781; Necker Hospital, Medical Genetics
Key Words: mitochondrial DNA, MELAS, m.3243A>G, embryo, mitochondria
For Peer Review
3 4 5 6 7 8 9 10 11 12 13 14 15 16 17 18 19 20 21 22 23 24 25 26 27 28 29 30 31 32 33 34 35 36 37 38 39 40 41 42 43 44 45 46 47 48 49 50 51 52 53 54 55 56 57For Peer Review
Segregation of mtDNA Throughout Human Embryofetal Development:
1
m.3243A>G as a Model System
2 3 4
Sophie Monnot,1 Nadine Gigarel,1 David C. Samuels,2 Philippe Burlet,1 Laetitia 5
Hesters,3 Nelly Frydman,3 René Frydman,3 Violaine Kerbrat,3 Benoit Funalot,1 Jelena 6
Martinovic,4 Alexandra Benachi,5 Josué Feingold,1 Arnold Munnich,1 Jean-Paul 7
Bonnefont,1*¶ Julie Steffann 1¶ 8
9
1Université Paris-Descartes, Unité INSERM U781, and Hopital Necker-Enfants 10
Malades (Assistance Publique-Hopitaux de Paris), Paris, 75015, France ; 2Center for 11
Human Genetics Research, Department of Molecular Physiology and Biophysics, 12
Vanderbilt University Medical Center, Nashville, TN 37232, USA. 3Service de 13
gynécologie et médecine de la reproduction, Hôpital Antoine Béclère (Assistance 14
Publique-Hopitaux de Paris), Clamart, 92140, France ; 4Service d’histo-embryologie 15
cytogénétique, Hopital Necker-Enfants Malades (Assistance Publique-Hopitaux de 16
Paris), Paris, 75015, France ; 5Maternité, Hôpital Necker-Enfants Malades 17
(Assistance Publique-Hopitaux de Paris), Paris, 75015, France 18
19
¶ Both authors equally contributed to the work 20 Correspondence: *[email protected] 21 22 23 3 4 5 6 7 8 9 10 11 12 13 14 15 16 17 18 19 20 21 22 23 24 25 26 27 28 29 30 31 32 33 34 35 36 37 38 39 40 41 42 43 44 45 46 47 48 49 50 51 52 53 54 55 56 57 58 59 60
For Peer Review
Abstract
1
2
Mitochondrial DNA (mtDNA) mutations cause a wide range of serious diseases with 3
high transmission risk and maternal inheritance. Tissue heterogeneity of the 4
heteroplasmy rate (“mutant load”) accounts for the wide phenotypic spectrum 5
observed in carriers. Owing to the absence of therapy, couples at risk to transmit 6
such disorders commonly ask for prenatal (PND) or preimplantation diagnosis (PGD). 7
The lack of data regarding heteroplasmy distribution throughout intra uterine 8
development however hampers the implementation of such procedures. We tracked 9
the segregation of the m.3243A>G mutation (MT-TL1 gene) responsible for the 10
MELAS syndrome in the developing embryo/fetus, using tissues and cells from 8 11
carrier females, their 38 embryos and 12 fetuses. Mutant mtDNA segregation was 12
found to be governed by random genetic drift, during oogenesis and somatic tissue 13
development. The size of the bottleneck operating for m.3243A>G during oogenesis 14
was shown to be individual-dependent. Comparison with data we achieved for the 15
m.8993T>G mutation (MT-ATP6 gene), responsible for the NARP/Leigh syndrome, 16
indicates that these mutations differentially influence mtDNA segregation during 17
oogenesis, while their impact is similar in developing somatic tissues. These data 18
have major consequences for PND and PGD procedures in mtDNA inherited 19 disorders. 20 21
Key words
22Mitochondria, mitochondrial DNA, MELAS, NARP, respiratory chain deficiency, 23
embryo, preimplantation genetic diagnosis 24 25 3 4 5 6 7 8 9 10 11 12 13 14 15 16 17 18 19 20 21 22 23 24 25 26 27 28 29 30 31 32 33 34 35 36 37 38 39 40 41 42 43 44 45 46 47 48 49 50 51 52 53 54 55 56 57 58 59 60
For Peer Review
Introduction
1
2
Mitochondrial DNA (mtDNA, Genbank NC_001807.4) disorders are common 3
diseases with maternal inheritance. Their high clinical variability is explained, at least 4
in part, by variation of the mutant load (heteroplasmy) among individuals, and also 5
across organs and tissues within an individual, so that mutant loads will surpass the 6
tissue specific threshold, leading to the manifestation of symptom (Chinnery et al., 7
1997; Jeppesen et al., 2006). The usual severity of these diseases, the recurrence 8
risk, usually high though being difficult to predict at the individual level, in offspring 9
from heteroplasmic carriers (Chinnery et al., 1998), and the absence of efficient 10
therapy, commonly result in a request from at-risk couples for prenatal (PND) or 11
preimplantation diagnosis (PGD). Such procedures are however hampered by the 12
lack of data regarding mtDNA segregation during embryofetal development. 13
In this respect, most available data come from animal studies. Dramatic shifts 14
of mtDNA populations (variant/wild-type mtDNA ratio) between the mother and her 15
offspring in cattle have suggested that a tight bottleneck might account for such a 16
rapid segregation (Laipis et al., 1988). One important function of this bottleneck could 17
be to ensure that new mutations will either be lost or fixed rapidly within individuals, 18
and thus exposed to selection at the population level (Bergstrom and Pritchard, 1998; 19
Roze et al., 2005). Studies in mice have identified the bottleneck during oogenesis 20
(Jenuth et al., 1996), through either a reduction of mtDNA content in primordial germ 21
cells (PGC, Cree et al., 2008), or selection of a small effective number of segregation 22
units for mtDNA (Cao et al., 2007; Cao et al., 2009; Wai et al., 2008). There are 23
however no available data so far regarding mutant mtDNA segregation in somatic 24
tissues during embryofetal development in animal models. 25 3 4 5 6 7 8 9 10 11 12 13 14 15 16 17 18 19 20 21 22 23 24 25 26 27 28 29 30 31 32 33 34 35 36 37 38 39 40 41 42 43 44 45 46 47 48 49 50 51 52 53 54 55 56 57 58 59 60
For Peer Review
In humans, a small number of studies of primary oocytes carrying mtDNA 1
deletions (Marchington et al., 1998) or point mutations (Blok et al., 1997; Brown et 2
al., 2001; Marchington et al., 2010) have suggested that a bottleneck operates during 3
oogenesis. Random genetic drift appeared as the principal mechanism determining 4
the level of mutant mtDNA within primary oocytes from a carrier of the most common 5
mtDNA mutation, m.3243A>G (Brown et al., 2001). This mutation affects the MT-TL1 6
gene [mitochondrially encoded tRNA leucine 1 (UUA/G), MIM 590050], and is 7
responsible for the MELAS (Mitochondrial myopathy, encephalopathy, lactic acidosis, 8
and stroke-like episodes, MIM 540000, Goto et al., 1992) and diabetes-deafness 9
syndromes (MIM 520000, van den Ouweland et al., 1992; Manouvrier et al., 1995). 10
It is so far not known whether m.3243A>G segregation is governed by random 11
drift in somatic tissues during human embryofetogenesis. The few available studies 12
on m.3243A>G carrier fetuses reported a uniform distribution of mutation load among 13
different tissues from two heteroplasmic 24 and 25 week-old human fetuses 14
(Matthews et al., 1994; Cardaioli et al., 2000). Our group found similar mutant loads 15
in chorionic villi and amniocytes from 3 heteroplasmic fetuses (Bouchet et al., 2006). 16
All these data suggest that MELAS mutant molecules do not segregate much 17
between 10 to 25 weeks of gestation. 18
However, we have so far lacked data on the transmission of m.3243A>G by a 19
carrier to early embryos, and subsequently no information on segregation of this 20
mutation throughout the entire period of human embryofetal development has 21
existed. Thanks to our PGD and PND programs, we collected various tissues and 22
cells at various stages of development in embryos and fetuses from m.3243A>G 23
carriers, and investigated local and temporal variation of the mutant load, using a 24 3 4 5 6 7 8 9 10 11 12 13 14 15 16 17 18 19 20 21 22 23 24 25 26 27 28 29 30 31 32 33 34 35 36 37 38 39 40 41 42 43 44 45 46 47 48 49 50 51 52 53 54 55 56 57 58 59 60
For Peer Review
quantification test designed to assess m.3243A>G mutant load at the single cell 1
level. 2
Aggregation of our data in early embryos and fetuses, with those from a 3
primary oocyte study in a m.3243A>G carrier (Brown et al., 2001) indicates that 4
mtDNA segregation is governed by random genetic drift, in germ- and somatic cell 5
lines, throughout the entire period of human intra-uterine development. The size of 6
the bottleneck operating during oogenesis for m.3243A>G is additionally suggested 7
to vary between individuals. Finally, comparison of the current data with those we 8
previously reported for another common mtDNA mutation, m.8993T>G (MT-ATP6, 9
ATP synthase subunit 6 gene, MIM 516060) responsible for the NARP syndrome 10
(Neuropathy, Ataxia, Retinitis Pigmentosa, MIM 551500; Steffann et al., 2006; 11
Steffann et al., 2007) indicates that these two mutations differentially influence 12
mtDNA segregation during oogenesis, while their putative impact on mtDNA 13
segregation appears quite similar in somatic cells during embryofetal development. 14
15
Patients, Materials and Methods
16
17
Patients
18
This study was approved by the National Ethics Comittee from l’Agence de 19
Biomedecine and all couples gave informed consent for DNA analyses in themselves 20
and their embryos/fetuses. 21
PND and/or PGD analyses were carried out in 8 individuals from 7 unrelated 22
families, heteroplasmic for the MELAS m.3243A>G mutation. The questionable 23
predictive value of a fetal mutant load for the postnatal outcome was emphasized to 24
all of the couples. In such situations, counseling necessarily refered to postnatal 25 3 4 5 6 7 8 9 10 11 12 13 14 15 16 17 18 19 20 21 22 23 24 25 26 27 28 29 30 31 32 33 34 35 36 37 38 39 40 41 42 43 44 45 46 47 48 49 50 51 52 53 54 55 56 57 58 59 60
For Peer Review
data, attempting to correlate clinical outcome and mutant load (Chinnery et al., 1997; 1
Uusimaa et al., 2007; Whittaker et al., 2009), and to our personal experience with 2
PGD/PND for another mtDNA disorder, ie NARP (Gigarel et al., 2005; Steffann et al., 3
2006; Steffann et al., 2007) and with PND for MELAS (Bouchet et al., 2006). 4
Accordingly, we postulated that mutant loads over 60% during prenatal life might be 5
predictive of a serious disorder, while a mutant load below 30% might hopefully be 6
associated with absence or low severity of the disease. The most complex situation 7
was a fetal heteroplasmy value in the intermediate range (30 to 60%), a common 8
finding for the MELAS m.3243A>G mutation in the post-natal period. There is indeed 9
no available data correlating intermediate mutant load in the prenatal period with the 10
postnatal outcome. 11
Seven of the 8 couples (couples 2 to 8) elected to resort to a conventional 12
PND approach at first. Couple 1 declined the option of pregnancy termination (TOP), 13
and thus directly went to PGD, that was also offered to couple 2, who had previously 14
experienced 2 TOP after PND. Both couples were informed that, at this early 15
embryonic stage (Day 3), a number of issues remained unsolved, precluding any 16
conclusive prediction on the pre/postnatal outcome of a carrier embryo. These 17
couples were offered a PND at 16 gestation weeks (GW) to confirm the PGD result in 18 case of pregnancy. 19 20 Materials 21 Postnatal period 22
Mutant loads from carrier females were assessed from blood, and when available, 23
urine and oral mucosa samples. Single lymphocytes were isolated from patients 1, 2, 24
3, 5, and 14 as already described (Gigarel et al., 2005). 25 3 4 5 6 7 8 9 10 11 12 13 14 15 16 17 18 19 20 21 22 23 24 25 26 27 28 29 30 31 32 33 34 35 36 37 38 39 40 41 42 43 44 45 46 47 48 49 50 51 52 53 54 55 56 57 58 59 60
For Peer Review
Early embryos
1
Patients 1 and 2 were subjected to one and three separate PGD cycles, respectively. 2
A standard in vitro fertilization protocol was performed and oocytes were collected 3
and fertilized by intracytoplasmic sperm injection (ICSI). 4
A total of 38 embryos were analyzed. Twenty-three of these embryos were of 5
appropriate quality, and were therefore submitted to a 2-blastomere biopsy at post-6
ICSI day 3 for mutant load assessment, as previously described (Gigarel et al., 7
2004). Briefly, under control by a binocular microscope, the blastomeres were rinsed 8
twice in a drop of PBS supplemented with 0.1%polyvinyl alcohol (Sigma Aldrich, 9
France), using a mouth-controlled, finely pulled glass pipette before being transferred 10
into a transparent microcentrifuge tube containing 3 µl of lysis buffer (Cui et al., 11
1989). A small volume of biopsy medium was used as a PCR negative control for 12
each embryo in order to detect any contamination by exogenous DNA. In the 15 13
remaining embryos, assessment of the mutant load was performed on the embryo in 14
toto. All blastomeres were separately analyzed, when possible (couple 1: embryos 1 15
to 3, and couple 2: embryo 13). Embryo 10 from couple 2 was cultured up to the 16
blastocyst stage (Day 5), enabling a trophectoderm biopsy as described elsewhere 17
(McArthur et al., 2005). The trophectoderm and inner cell mass were analyzed 18
separately. 19
20
Late embryos and fetuses
21
Prenatal diagnosis was performed in 12 fetuses from 7 carrier women. Fetus 2c 22
resulted from embryo 7 and 11 transfer after PGD (patient 2), while the remaining 23
ones were conceived naturally. Chorionic villi (CV, n=8), amniotic fluids 1 (AF1, n=6), 24
and 2 (AF2, n=1), were sampled at 10, 14, and 30 weeks of gestation (GW), 25 3 4 5 6 7 8 9 10 11 12 13 14 15 16 17 18 19 20 21 22 23 24 25 26 27 28 29 30 31 32 33 34 35 36 37 38 39 40 41 42 43 44 45 46 47 48 49 50 51 52 53 54 55 56 57 58 59 60
For Peer Review
respectively. Individual fetal cells were isolated from CV and AF samples from 6 1
fetuses, as already described (Steffann et al., 2007), and analyzed separately, to 2
investigate the intercellular variation of heteroplasmy. Cord blood was collected from 3
3 fetuses at birth (fetuses 2c, 3, and 4). Postmortem analyses of various tissues were 4
carried out in two 12 week-old fetuses (fetuses 2a and 2b) and one 19 week-old fetus 5
(5b) after TOP, and in a 20 week-old miscarriage product (fetus 7a). Parental 6
informed consent was obtained for these postmortem analyses. Fetal tissues were 7
carefully dissected, and small tissue biopsies were analyzed separately. Multiple 8
samples were taken from two term placentas (fetuses 2c and 3), and two 12GW 9
placentas (fetuses 2a and 2b). 10 11 Methods 12 DNA extraction 13
DNA was extracted from blood and tissues, using the Nucleon Bacc3 kit (Amersham 14
Biosciences, UK), and a classical phenol extraction method, respectively. 15
16
Quantitative analysis of the m.3243A>G mutant load
17
MELAS mutant load was quantified using a semi-quantitative fluorescent PCR-HaeIII 18
restriction test. 19
Since PCR products analysis using a restriction enzyme is thought to allow the 20
possibility of errors in mutant load assessments, secondary to heteroduplex 21
formation during the PCR process (Tanno et al., 1991), we first validated our method 22
of heteroplasmy assessment using mixing experiments and standard curve analysis. 23
Wild-type and mutant plasmids were mixed to generate 10 samples, each of them 24
comprising 106 mtDNA copies, with the m.3243G>A (mutant) target at concentrations 25 3 4 5 6 7 8 9 10 11 12 13 14 15 16 17 18 19 20 21 22 23 24 25 26 27 28 29 30 31 32 33 34 35 36 37 38 39 40 41 42 43 44 45 46 47 48 49 50 51 52 53 54 55 56 57 58 59 60
For Peer Review
ranging from 1 to 100%, which were also used to determine the lowest rate of 1
mutation detection. Each sample was amplified in triplicate, using both “single cell” 2
and “tissue” methods, and PCR products were submitted to HaeIII digestion. 3
We furthermore ascertained the reliability of our test over a wide range of 4
mtDNA copies, from 102 to 106, encompassing the mtDNA copy number usually 5
present in isolated cells such as lymphocytes, blastomeres and oocytes. 6
Single cells and embryos were transferred to 3µl alkaline buffer (Cui et al., 7
1989) and lysed by 10 min heating at 65°C. PCR amplification was carried out using 8
the forward primer (5’-TGAGTTCAGACCGGAGTAATC-3’) and the reverse 9
fluorescent primer (*) (5’-(6-Fam) CTTAACAACATACCCATGGC-3’). Separate 10
experimental conditions were devised for whole tissue sample and single cell/early 11
embryo analyses. 12
Tissue sample DNA (1ng) was amplified in a 30µl reaction volume containing 13
1.5U Expand Taq DNA Polymerase, 10X PCR buffer 2 (3µl, Roche Diagnostics, 14
Mannheim, Germany), 0.5µM of each primer (Proligo, Paris, France), and 2mM 15
dNTP mix (Roche Diagnostics, Germany). Initial denaturation was carried out at 97°C 16
for 7 min 20s followed by 20 cycles (97°C for 20s, 60°C for 30s, 68°C for 1min 15s) 17
and final extension of 7 min at 68°C. 18
For a single cell or embryo analysis, the PCR reaction contained 3 µl of lysis 19
buffer (lysed cell or negative control), each primer at 0.5µM, master mix 2X (12.5µl, 20
QIAGEN Multiplex PCR kit, QIAGEN S.A, Courtaboeuf, France), and double-distilled 21
water up to a 25-µl final volume. PCR programs were 15 min of denaturation at 95°C, 22
followed by 25, 26, 27, and 30 PCR cycles for whole embryos, trophoblastic cells, 23
blastomeres, and amniocytes, respectively, consisting of 30s at 94°C, 90s at 60°C 24
and 60s at 72°C, with a 30-min final extension at 60°C. 25 3 4 5 6 7 8 9 10 11 12 13 14 15 16 17 18 19 20 21 22 23 24 25 26 27 28 29 30 31 32 33 34 35 36 37 38 39 40 41 42 43 44 45 46 47 48 49 50 51 52 53 54 55 56 57 58 59 60
For Peer Review
The resulting 251-bp fluorescent PCR products (1µl) were digested for 3 hours 1
using 10 units of HaeIII and subsequently submitted to electrophoresis using an 2
automated genetic analyser ABI3130 (Applied Biosystems). Digestion generated 73-3
bp and 170-bp fluorescent fragments for the mutant and wild-type species, 4
respectively. Results were analysed with the Genescan and Genotyper software 5
(Applied Biosystems). The mutant load was calculated by dividing the mutant peak 6
area (73bp) by the sum of normal (171bp) and mutant (73bp) peak areas. Cross 7
hybridization of oligonucleotide primers to nuclear DNA was ruled out by PCR 8
amplification on mtDNA-less Rho0 cells (Parfait et al., 1998). 9
10
Ascertainment of the fetal origin of the CV/AF cells
11
The fetal origin of single cells collected from CV, AF1, and AF2, was ascertained by 12
simultaneous analysis of parental and embryofetal DNA using nuclear (CA)n 13
microsatellite markers (D6S436, D19S559, D19S559, D16S3395, D6S436, and 14
DXS1073 for fetus 2a, 5a, 5b, 6, 8, and 12b, respectively), enabling to check for 15
biparental contribution to the cell genotype, and the absence of fetal cell 16
contamination by maternal DNA (Gigarel et al., 2004). 17
Amplification of microsatellites markers in single cells required nested PCR. 18
The first “outer” PCR enabled simultaneous amplification of the MELAS mutation and 19
an appropriate microsatellite marker. Briefly, cells were amplified using “single-cell” 20
PCR conditions described above, as a duplex PCR reaction, using 0.5µM of each 21
primer. 3µl of the first amplification product were subsequently mixed with 22µl of 22
“inner” amplification mix, which contained inner fluorescent microsatellite primers at 23
0.5µM, master mix 2X (12.5µl, QIAGEN Multiplex PCR kit, QIAGEN S.A, 24 3 4 5 6 7 8 9 10 11 12 13 14 15 16 17 18 19 20 21 22 23 24 25 26 27 28 29 30 31 32 33 34 35 36 37 38 39 40 41 42 43 44 45 46 47 48 49 50 51 52 53 54 55 56 57 58 59 60
For Peer Review
Courtaboeuf, France), and double-distilled water up to a 25µl final volume. PCR 1
program was as described above (20 PCR cycles). 2
3
Statistical analyses
4
Variance analysis and calculation of inter or intra class correlation coefficients were 5
used to analyze quantitative traits. Qualitative traits were analyzed using à Chi2 test. 6
The 95% confidence intervals of the measurements from Patient 2 were made by 7
fitting a Kimura distribution (Wonnapinji et al., 2008) to the 35 mutation level 8
measurements from this patient, and then drawing 10,000 simulated sets of 35 9
measurements from this Kimura distribution to estimate the confidence intervals due 10
to sample size effects (Wonnapinji et al., 2010). 11
12
Results
13
14
Sensitivity, linearity, and reproducibility of mutant load quantification
15
Mixing various proportions of wild type and mutant plasmids enabled us to establish 16
that the measured level of heteroplasmy was a linear function of the expected ratio 17
(Figure 1). The correlation coefficient for the observed vs expected proportion of 18
mutant was 0.99 for both “single cell” and “tissue” conditions. Triplicate experiments 19
yielded to similar results (SD<1.7%), and mutant molecules could be detected in a 20
proportion as low as 2% of the total mtDNA amount, thus validating reproducibility 21
and sensitivity of the assay. These results were got with a 106 mtDNA copy number 22
In order to demonstrate an insensitivity to template input amounts for this particular 23
method, we ascertained the reliability of our test over a wide range of mtDNA copies, 24
from 102 to 106. Results are displayed in Supp. Figure S1. 25 3 4 5 6 7 8 9 10 11 12 13 14 15 16 17 18 19 20 21 22 23 24 25 26 27 28 29 30 31 32 33 34 35 36 37 38 39 40 41 42 43 44 45 46 47 48 49 50 51 52 53 54 55 56 57 58 59 60
For Peer Review
1Analysis in carrier women
2
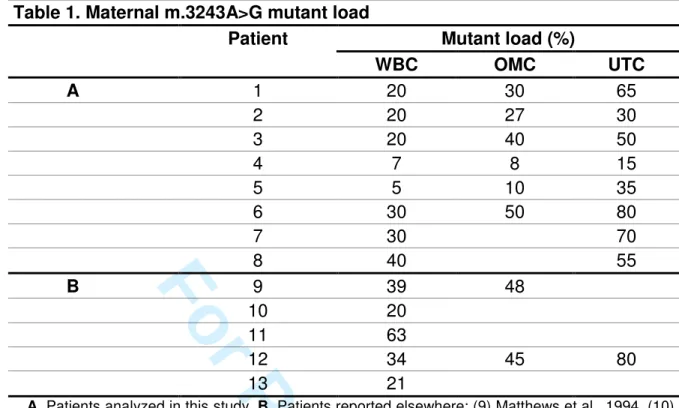
Mutant loads from the 8 carriers applying for MELAS PND/PGD (family 1 to 8, Table 3
1) ranged from 5 to 40%, 8 to 50%, and 15 to 80%, in leucocytes, oral mucosa cells, 4
and urinary tract cells, respectively. The lowest and highest values were consistently 5
found in white blood cells and urinary tract cells, respectively, as expected from 6
previous reports (Chinnery et al., 1997; Chinnery et al., 1999; Frederiksen et al., 7
2006; Whittaker et al., 2009). 8
Mutant load assessment in single lymphocytes from 5 carriers showed large 9
intercellular variations, ranging from 0 to 81%, 0 to 81%, 0 to 95%, 0 to 21%, and 0 to 10
100 in patients 1, 2, 3, 5, and 14, respectively. When pooling values from all cells 11
analyzed for a given individual, average mutant load was very close to that achieved 12
from the overall lymphocyte extract recovered from a 10ml blood sample. 13
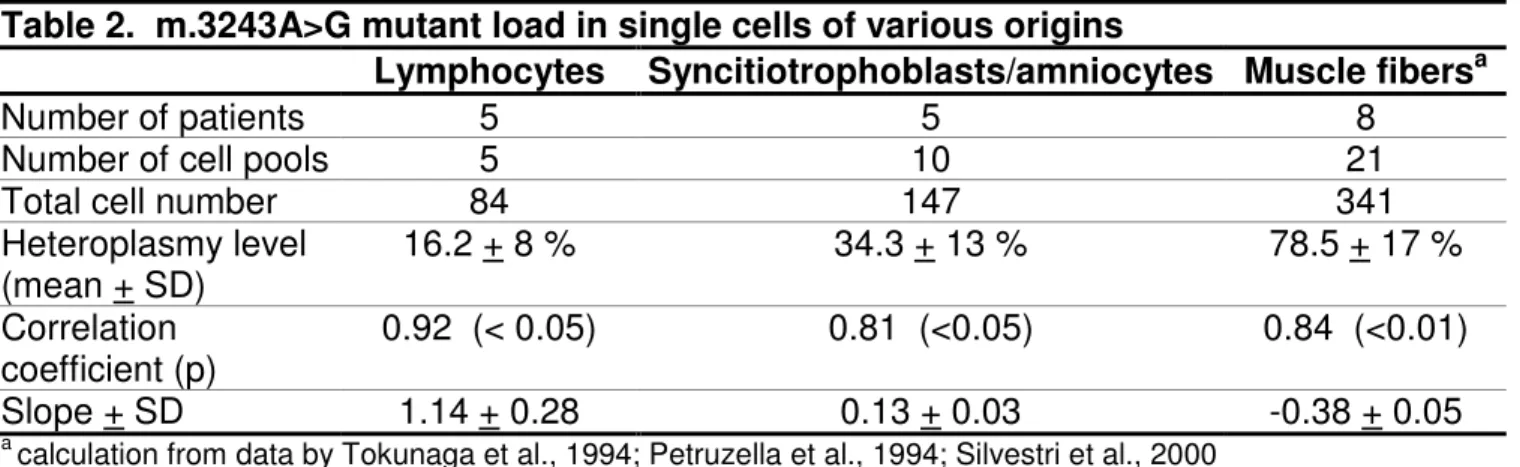
Comparison of the mean heteroplasmy rate vs one standard deviation of the 14
heteroplasmy distribution at the single-cell level for each of the five lymphocyte pools 15
(16.2±8.6%) showed a 0.92 correlation coefficient (p<0.05) with a positive slope 16
(1.14±0.3) (Table 2 and Supp. Figure S2). 17
18
Analysis in Day 3-Day 5 embryos
19
Thirty-eight embryos from 2 unrelated heteroplasmic women were analyzed. The 20
m.3243A>G mutant load was assessed in 31 whole embryos and 70 single 21
blastomeres (Table 3). Exogenous DNA contamination of the embryonic sample was 22
never detected in any experiment. 23
Within the whole cohort of analyzed embryos, six had no detectable mutation 24
(detection threshold: 2%). Taking into account Patient 2 only (35 embryos), the 25 3 4 5 6 7 8 9 10 11 12 13 14 15 16 17 18 19 20 21 22 23 24 25 26 27 28 29 30 31 32 33 34 35 36 37 38 39 40 41 42 43 44 45 46 47 48 49 50 51 52 53 54 55 56 57 58 59 60
For Peer Review
transmission rate was 83%. None of the embryos were homoplasmic mutant. 1
Heteroplasmy levels ranged from 5 to 77%, with an apparently homogeneous 2
dispersion of the mutant rates among embryos. The mutant load value was similar in 3
all blastomeres derived from a single embryo (n = 2 to 11) with a 6% maximal 4
interblastomere variability. The intraclass correlation coefficient (ICC) was equal to 5
0.994, consistent with the high level of agreement of intra-embryo measurements, 6
and contrasting with the inter-embryo variability. When possible, comparison of 7
heteroplasmy levels between the whole embryo (collected at Day 5) and two of 8
his/her blastomeres (collected at Day 3) showed a variation rate <7% in 13/16 9
embryos, and between 10 and 15% in the remaining ones. 10
When considering all embryos from patient 2, the distribution of the mutation 11
level values was consistent with the distribution predicted from neutral drift theory (p-12
value of 0.53 by KS test) comparing the data against the null hypothesis of the 13
Kimura distribution (Wonnapinji et al., 2008). When pooling mutant loads measured 14
in each embryo from a given woman, mean values were 30±15% and 32±23% for 15
patients 1 and 2, respectively. Each of these values was close to the mutant load 16
measured in oral mucosa cell DNA from the corresponding woman (30% and 27% for 17
patients 1 and 2, respectively). 18
Embryo 10 from family 2, harbouring a 13% mutant load at Day 3, was 19
cultured up to the blastocyst stage (Day 5) and separated in 2 parts, namely, the 20
inner cell mass and the trophectoderm. PCR failed to amplify the inner cell mass 21
DNA, while the heteroplasmy level of the trophectoderm was consistent with the level 22
measured in Day 3 blastomeres (15% vs 13%). 23
24
Analysis in fetuses over 10GW
25 3 4 5 6 7 8 9 10 11 12 13 14 15 16 17 18 19 20 21 22 23 24 25 26 27 28 29 30 31 32 33 34 35 36 37 38 39 40 41 42 43 44 45 46 47 48 49 50 51 52 53 54 55 56 57 58 59 60
For Peer Review
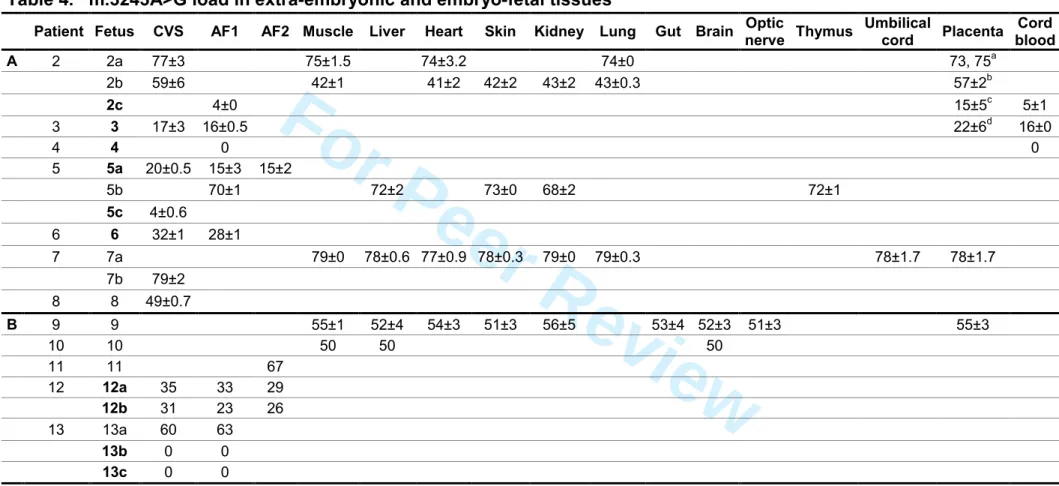
Mutant loads were assessed in extraembryonic or embryonic tissues collected 1
between 10GW to term, in 12 fetuses from 7 carriers (families 2 to 8, Table 4). 2
One fetus did not carry the mutation in his two tested tissues (amniocytes at 3
16 GW, and cord blood at birth, fetus 4). As observed in early embryos, no fetus was 4
homoplasmic for the mutant. The mutation load ranged from 4% to 79% in the 11 5
carriers. There was no substantial variation in mutant loads assessed at various 6
stages of pregnancies until birth (Table 4). When excluding data from extra-7
embryonic tissues (10GW trophoblast or at term placenta), m.3243A>G mutant loads 8
were identical in all tested tissues from a given fetus [mean±SD: 74.6±0.7% (3 9
tissues), 42±0.8% (5 tissues), 71±2% (5 tissues), and 78±0.9% (7 tissues) for fetuses 10
2a, 2b, 5b and 7a, respectively]. When placenta and other tissues were available at 11
the same term of gestation (3 fetuses), values were similar in two fetuses (74.6 vs 12
74% and 78 vs 78% for fetus 2a and 7a, respectively), while fetus’ 2b mutant load 13
was higher in placenta than in other tissues (57±2% vs 42±2%, respectively). Multiple 14
samples in various parts of placenta, aimed at testing the mutant load distribution, 15
did not show any substantial variation in 2, 6, 10, and 18 various loci of fetuses’ 2a, 16
2b, 2c, and 3 placentas, respectively (Table 4), irrespective of the gestation stage (12 17
GW or at birth). 18
Single trophoblastic cells (n=83) and amniocytes (n=64) were isolated from 6 19
fetuses to investigate the intercellular mutant load variation (Figure 2). Simultaneous 20
analyses of parents’ and fetal cell DNAs using a polymorphic marker proved the fetal 21
origin and the absence of contamination by maternal DNA of the analyzed cells (not 22
shown). Large intercellular variations were found both in trophoblastic cells (range: 7-23
21%, 6-38%, 23-55%, 23-70%, and 64-100%, for fetuses 5a, 6, 12b, 8, and 2a, 24
respectively), and amniocytes, either at 14 GW (range : 10-23%, 16-42%, and 52-25 3 4 5 6 7 8 9 10 11 12 13 14 15 16 17 18 19 20 21 22 23 24 25 26 27 28 29 30 31 32 33 34 35 36 37 38 39 40 41 42 43 44 45 46 47 48 49 50 51 52 53 54 55 56 57 58 59 60
For Peer Review
94%, for fetuses 12b, 6 and 5b, respectively), or at 30 GW (range : 9-17% and 5-28% 1
in fetuses 5a and 12b, respectively). When pooling values from all cells analyzed for 2
a given cell type in a given fetus, the average mutant loads were very close to those 3
achieved from overall chorionic villi sampling (CVS) and amniotic fluid sample (AFS ) 4
mutant loads (variation<10%, Figure 2). 5
Comparison of the mean heteroplasmy rate vs one standard deviation of the 6
heteroplasmy distribution at the single-cell level for each of the ten fetal cell pools 7
(34.3±23%) showed a 0.81 correlation coefficient (p<0.01) with a positive slope 8
(0.13±0.03) (Table 2 and Supp. Figure S2). 9
10
Predictive value of a prenatal mutant load for the postnatal outcome
11
Assessment of the predictive value of a prenatal mutant load for the disease severity 12
in the postnatal period is of crucial importance. A follow-up of our small cohort of 13
patients born after PGD (n=1) or PND (n=9) provided a preliminary indication, even 14
though for ethical reasons we could not check for the presence of the mutation in 15
these asymptomatic children. All these children, harbouring mutant loads between 0 16
and 35% in prenatal period, are indeed healthy at 1 month to 5 years of age (Table 17 4). 18 19
Discussion
20 21Analysis of tissues and cells from human embryos and fetuses is currently the only 22
approach to get some insight into processes that govern maternofetal transmission of 23
common mtDNA mutations in humans, owing to the numerous technological 24
difficulties met in attempts at creating animal models of mitochondrial disorders 25 3 4 5 6 7 8 9 10 11 12 13 14 15 16 17 18 19 20 21 22 23 24 25 26 27 28 29 30 31 32 33 34 35 36 37 38 39 40 41 42 43 44 45 46 47 48 49 50 51 52 53 54 55 56 57 58 59 60
For Peer Review
(Inoue et al., 2000; Fan et al., 2008). We used this approach to study the segregation 1
of m.3243A>G mtDNA molecules during human in utero development, thanks to our 2
PND/PGD activities, offered to carriers of this mutation. 3
These data rely on a robust, specific and sensitive assay we devised for the 4
quantification of the m.3243A>G MELAS mutation in tissues and single cells. 5
While last-cycle labeling PCR indeed is a well-established and agreed-upon 6
standard protocol for the quantification of mtDNA heteroplasmy, a major concern with 7
this approach is the need to add the labeled primer prior to the last PCR cycle. This 8
process indeed runs a significant risk of contamination of both the endogenous PCR 9
product by exogenous DNA, and of the laboratory dedicated to single cell analyses 10
by the endogenous PCR product. Such a risk, being a minor one when amplifying a 11
large amount of DNA, becomes a major hurdle to the use of this method, when 12
applied to single cell analysis. 13
We ascertained the reliability of our test over a wide range of mtDNA copies, from 14
102 to 106. This range encompassed the mean value of mtDNA copies in 15
lymphocytes [around 150 copies, Urata et al 2008; Maagaard et al. 2006] 16
blastomeres [11 000 – 449 000 copies, Lin et al 2004] and oocytes [200 000 – 17
800 000 copies, Craven et al. 2010]. Our results demonstrated an insensitivity to 18
template input amounts for this particular method, thus validating the results of the 19
experiments carried out on various cells and tissues. 20
21
Analysis in Day 3-Day 5 embryos
22
To our knowledge, data on the presence of the m.3243A>G mutation at the Day 3 23
stage of embryonic development have not been reported so far. This mutation was 24
found in 32 of 38 embryos (84%) from 2 unrelated carriers. This transmission rate is 25 3 4 5 6 7 8 9 10 11 12 13 14 15 16 17 18 19 20 21 22 23 24 25 26 27 28 29 30 31 32 33 34 35 36 37 38 39 40 41 42 43 44 45 46 47 48 49 50 51 52 53 54 55 56 57 58 59 60
For Peer Review
in agreement with a previous report on the presence of m.3243A>G in adult carrier’s 1
primary oocytes (Brown et al., 2001), whose 74 of 82 oocytes (90%) were 2
heteroplasmic. A woman carrying the pathogenic mutation may thus have mutation-3
free embryos, advocating PGD as an appropriate procedure for preventing 4
recurrence of affected offspring in carriers, at least in the mutant load range reported 5
in this study. 6
Mutant DNA molecules were constantly found to be equally distributed among 7
the various blastomeres of a carrier embryo until Day 5, in agreement with data on 8
mtDNA polymorphisms achieved in mouse (Dean et al., 2003) and human embryos 9
(Marchington et al., 2010), as well as on the m.8993T>G (NARP) mutation in human 10
(Steffann et al., 2006). Single-cell analysis thus reflects the whole embryo mutant 11
load, supporting relevance of the usual PGD procedure for assessment of the overall 12
embryo genotypic status. It is however worth noting some occasional variability (up to 13
15%) in mutant load between single cell measurements and the whole embryo. This 14
discrepancy could have arisen from either a technical artifact (such as partial loss of 15
mitochondrion during whole embryo recovery) or physiological distortion in 16
m.3243A>G segregation from Day 3 (blastomere sampling stage) to Day 5 (whole 17
embryo recovery stage). This last hypothesis is unlikely since mutant load values 18
were very close in Day 5 trophectoderm and Day 3 single-blastomeres in the only 19
embryo where both tissues were available (Table 3), additionally indicating that the 20
mtDNA molecule segregation is not skewed across embryonic and extraembryonic 21
cells (trophectoderm) at this developmental stage. Finally, inter blastomere stability of 22
the mutant load suggests that embryonic heteroplasmy determined from a single cell 23
analysis provides an accurate estimate of the whole embryo mutant load, as 24 3 4 5 6 7 8 9 10 11 12 13 14 15 16 17 18 19 20 21 22 23 24 25 26 27 28 29 30 31 32 33 34 35 36 37 38 39 40 41 42 43 44 45 46 47 48 49 50 51 52 53 54 55 56 57 58 59 60
For Peer Review
previously reported for other mtDNA variants (Steffann et al., 2006; Craven et al., 1
2010) 2
The m.3243A>G mutant load was found to be highly heterogeneous among 3
various embryos from a given individual, ranging from 18 to 50% and from 0 to 77% 4
in patients’ 1 and 2 embryos, respectively. These values on “early” embryos are in 5
agreement again with those on primary oocytes from a m.3243A>G carrier, the 6
mutant load of which ranged from 1 to 50% (Brown et al., 2001). Two conclusions 7
can be derived from these observations. 8
The first conclusion concerns the mode of transmission of m.3243A>G from 9
the mother to her progeny. The distribution of the mutation level values among 10
Patient 2’s embryos was consistent with the Kimura distribution calculated from the 11
neutral drift theory. Furthermore, an equal number of her embryos were found to 12
harbour a mutation level greater than the mean value (18 embryos) and less than the 13
mean (17 embryos). Finally, the mean level of heteroplasmy amongst all embryos 14
was very close to the heteroplasmy level seen in the mother (oral mucosal cells and 15
blood, patients 1 and 2). These data argue for random genetic drift as the 16
mechanism governing mtDNA segregation during oogenesis. This observation in 17
humans is in full agreement with the results of a study of heteroplasmy distribution in 18
the progeny of mice carrying apparently neutral BALB/c and NZB mtDNA sequence 19
variants (Jenuth et al., 1996). Assuming that blastomere analysis provides a direct 20
insight on mature oocyte mutant load, our data, gathered with those of Brown et al., 21
suggest that mtDNA segregation is governed by a random genetic drift mechanism 22
over the whole oogenesis period. 23
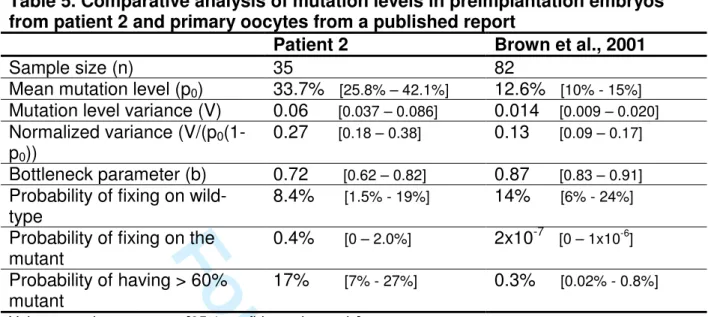
The second conclusion regards the size of the bottleneck operating for 24
m.3243A>G during oogenesis (table 5). The embryos from patient 2 had a larger 25 3 4 5 6 7 8 9 10 11 12 13 14 15 16 17 18 19 20 21 22 23 24 25 26 27 28 29 30 31 32 33 34 35 36 37 38 39 40 41 42 43 44 45 46 47 48 49 50 51 52 53 54 55 56 57 58 59 60
For Peer Review
normalized variance (Wonnapinji et al., 2010), and therefore a smaller bottleneck 1
parameter, than the oocytes from the individual in Brown’s study (Brown et al., 2001). 2
The confidence intervals did not quite overlap, indicating that there is a real 3
difference between the bottleneck sizes in these two individuals, though this 4
difference is not large. These data therefore suggest that some individual-dependent 5
parameter modulates the bottleneck size for a given mtDNA mutation. 6
7
Analysis in 10 – 37 GW fetuses
8
Very few data are available on m.3243A>G segregation during fetal development so 9
far. We looked for this mutation in 12 fetuses from 8 carriers, and aggregated these 10
data with those that we (patients 12 and 13, Table 4, Bouchet et al., 2006) and other 11
groups (patients 9 to 11, Table 4, Matthews et al., 1994; Cardaioli et al., 2000; Chou 12
et al., 2004) had previously published. Maternal m.3243A>G was passed on to 17 of 13
20 fetuses (85% transmission rate). Taking embryonic and fetal data together, 14
carriers passed on the mutation to 49 of their 58 offspring (84%, Tables 3 and 4). 15
This transmission risk fits with the MELAS transmission rate calculated from the 16
mutant load determined in buccal mucosa samples from carriers’ offspring in the 17
postnatal period (Uusimaa et al., 2007). It can not be ascertained whether the 3 18
fetuses shown to be mutation-free at 10GW in the current study were mutation-free 19
embryos initially or alternatively resulted from subsequent loss of mutant mtDNA 20
molecules they carried at early embryonic stage. All fetuses but one (fetus 2c) were 21
indeed conceived out of a PGD procedure, and mutant load values at the Day 3 22
stage were therefore not available. Our data however argue for mutant load stability 23
throughout the entire period of embryofetal development. In fetus 2c, loads in 14GW 24
amniocytes and in term cord blood were indeed 4 and 5%, respectively, in agreement 25 3 4 5 6 7 8 9 10 11 12 13 14 15 16 17 18 19 20 21 22 23 24 25 26 27 28 29 30 31 32 33 34 35 36 37 38 39 40 41 42 43 44 45 46 47 48 49 50 51 52 53 54 55 56 57 58 59 60
For Peer Review
with those assessed at early embryonic stage (embryos 7 and 11 from patient 2, 1
carrying 5 and 14%, respectively, only one of whom, -fetus 2c-, developed). We 2
similarly did not find any temporal variation of the MELAS mutant load in multiple 3
samples taken within 10 to 39 GW (Table 4 A and B). 4
Study of various tissues from six 12-25GW fetuses (2a, 2b, 5b, 7a, 9, 10) 5
showed a tight intertissue stability in each of them. Mutant load assessed in extra-6
embryonic (placenta) and embryonic tissues collected at the same gestation term 7
from 4 fetuses, was found to be similar in 3 of them (2a, 7a, and 9), being higher in 8
trophoblast (57 vs 42%) from the remaining one (fetus 2b). Discrepancy between 9
trophoblast and non trophoblastic fetal tissues did not seem to result from an 10
ascertainment bias secondary to loco-regional mutant load heterogeneity within 11
placenta, recently shown to exist (Marchington et al., 2006). The heteroplasmy level 12
was indeed highly similar in six separate regions of fetus 2b placenta (Table 4). Thus, 13
this placento-fetal discrepancy might be accounted for by selection of a few cells 14
which will form the first source for the placental membranes in the partitioning 15
blastocyst. This observation additionally emphasizes that analysis of single CVS 16
sample, carried out in a PND frame, may fail to assess the fetal mutant load reliably, 17
as recently reported (Marchington et al., 2010). 18
The observation of tight mutant load stability, both across tissues and with 19
time, in all tested fetuses, suggests that mtDNA segregation is mainly governed by 20
random genetic drift in somatic tissues throughout the entire period of human 21
embryofetal development. Furthermore, as already noted in embryos, none of the 20 22
fetuses analyzed so far (Table 4) was found to carry a heteroplasmy rate exceeding 23
80%, over a wide range of maternal mutant loads (from 5% in WBC to 80% in urinary 24
tract cells). Whether such a 80 % value has a biological significance (i.e., a 25 3 4 5 6 7 8 9 10 11 12 13 14 15 16 17 18 19 20 21 22 23 24 25 26 27 28 29 30 31 32 33 34 35 36 37 38 39 40 41 42 43 44 45 46 47 48 49 50 51 52 53 54 55 56 57 58 59 60
For Peer Review
hypothetical selection against highly mutated embryos/fetuses) remains speculative. 1
Since mutations such as m3243A>G exhibit a relatively normal pattern of distribution 2
around the maternal mean, it would be unlikely, given the relatively small sample size 3
and the mean maternal mutant load value in majority below 40 % (in blood) in our 4
series (table 1) to find embryos with greater than 80 % heteroplasmy, even in the 5
absence of selection. 6
We attempted to establish at the single cell level the basis of the mutant load 7
stability observed across fetal tissues. We thus analyzed 147 cells distributed into ten 8
pools of trophoblastic or amniotic cells (7-30 cells per pool) collected in six unrelated 9
fetuses within the 10-30 GW period (Figure 2). Except for one homoplasmic mutant 10
cell (fetus 2a), all cells were heteroplasmic with a mutant load ranging from 5 to 95%. 11
This observation is in line with the few studies available on MELAS single cells 12
collected during the postnatal life, that indeed failed to detect mutant loads over 92% 13
and 98% in lymphocytes (Saitoh et al., 1999) and muscle fibers (Silvestri et al., 14
2000), respectively. These data argue that, over a critical threshold of heteroplasmy, 15
the resulting impact on respiratory chain function promotes fetal cell death 16
(Sasarman et al., 2008). 17
When pooling values from all cells belonging to a given pool, mutant load 18
dispersion ranged from 10 to 47% (Figure 2). The frequency distribution of single cell 19
mutant load within each of the ten cell pools corresponded to a binomial distribution, 20
with a median value identical or very close to the mean value of heteroplasmy, in 21
keeping with the random genetic drift mechanism. We subsequently looked for an 22
optional relationship between a mutation rate at the tissue (chorionic villi or 23
amniocytes) level and the amplitude of mutant load dispersion at the single cell level 24
in this tissue (Supp. Figure S2). A previous study using adult carrier lymphocytes had 25 3 4 5 6 7 8 9 10 11 12 13 14 15 16 17 18 19 20 21 22 23 24 25 26 27 28 29 30 31 32 33 34 35 36 37 38 39 40 41 42 43 44 45 46 47 48 49 50 51 52 53 54 55 56 57 58 59 60
For Peer Review
indeed suggested that, the higher the proportion of mutated mtDNA molecules, the 1
wider the dispersion of heteroplasmy level (Saitoh et al., 1999). Though the number 2
of single cells analyzed was low in each pool, we however assumed that each of the 3
ten cell pools was fairly representative of the whole tissue sample, based on mean 4
mutant load variance consistently less than 10% between the cell pool and the whole 5
sample. It clearly appeared that, the higher the tissue mutant load, the larger the 6
heteroplasmy dispersion in trophoblastic and amniotic cells, even if the low number 7
of analyzed cells precluded any firm conclusion on the biological relevance of this 8
observation. We then attempted to evaluate whether such a hypothetical relationship 9
can be considered in various tissues from m.3243A>G carriers, collected in prenatal 10
and postnatal periods as well. We considered that Saitoh’s study was exposed to 11
some bias in heteroplasmy assessment, due to the complex experimental procedure 12
of this study (first PCR, electrophoresis gel extraction of the PCR products, second 13
PCR, PCR products enzymatic digestion, southern blotting, and bioimager analysis). 14
Using DNA from five adult carrier females, we therefore recapitulated Saitoh’s study 15
with our own method of mutant load assessment, in an effort to homogenize our 16
data. We thus found a statistically significant correlation between the mean mutant 17
load in each of the five lymphocyte pools and the heteroplasmy distribution at the 18
single cell level. Interestingly, comparison of our data in lymphocytes and fetal cells 19
showed a marked difference between curve slopes for a same range of 20
heteroplasmy, arguing for some tissue-dependence of mtDNA segregation at the cell 21
level (Supp Figure S2). These data contrast with the few available data of the 22
literature, regarding single muscle fibers in adult carriers. The latter indeed showed 23
that, the higher the mean mutant load of a cell pool, the lower the heteroplasmy 24
distribution at the cell level (Petruzzella et al., 1994; Tokunaga et al;, 1994; Silvestri 25 3 4 5 6 7 8 9 10 11 12 13 14 15 16 17 18 19 20 21 22 23 24 25 26 27 28 29 30 31 32 33 34 35 36 37 38 39 40 41 42 43 44 45 46 47 48 49 50 51 52 53 54 55 56 57 58 59 60
For Peer Review
et al., 2000). However, the range of mutant loads does not overlap between skeletal 1
muscle (60-100%) and the other tissues (5-60%). Thus, assuming that the apparent 2
relationship between mean mutant loads at a whole sample level and mutant load 3
dispersion at the single cell level makes biological sense in all these tissues, it would 4
remain to be seen whether the proposed tissue-dependance of such correlations is 5
valid throughout the 0-100% range of heteroplasmy. 6
7
Comparison of prenatal and postnatal data
8
It is difficult to reconcile the prenatal inter-tissue stability observed in this study, and 9
the tissue-dependance of m.3243A>G mutant loads in adult carriers, who harbour 10
heteroplasmy rates almost constantly higher in skeletal muscle, urinary epithelial 11
tract cells, and hair follicles, than in white blood cells (Chinnery et al., 1999; 12
Frederiksen et al., 2006; Whittaker et al., 2009). 13
This tissue dependance has been suggested to result from a replicative 14
disadvantage of cells harbouring a high mutant load, thus promoting “mutation 15
epuration” from fast regenerating tissues. Should such a biological process operate 16
prenatally, it could be missed out within the “short” course of a pregnancy, by 17
reference to the very slow decrease of mean mutation level in adult white blood cells 18
(Rajasimha et al., 2008), thus reflecting the apparent inter-tissue mutant load stability 19
throughout the prenatal period. Alternatively, cell proliferation rate would be identical 20
among all tissues throughout intra-uterine life, and would become tissue dependant 21
from a fairly late postnatal period. A similar value of mutant load (65 to 70%) has 22
indeed been reported in amniocytes at 21 GW, and in peripheral blood and hair 23
follicles sampled in a four-year old carrier (Chou et al., 2004). 24 25 3 4 5 6 7 8 9 10 11 12 13 14 15 16 17 18 19 20 21 22 23 24 25 26 27 28 29 30 31 32 33 34 35 36 37 38 39 40 41 42 43 44 45 46 47 48 49 50 51 52 53 54 55 56 57 58 59 60
For Peer Review
Comparison of mtDNA metabolism in m.3243A>G (MELAS) and m.8993T>G
1
(NARP) mutations throughout human embryofetal development
2
Comparing mtDNA segregation data throughout human embryofetal development for 3
two different mtDNA mutations, namely, m.3243A>G/ MELAS and m.8993T>G/ 4
NARP, highlights striking differences (Figure 3). 5
While all MELAS embryos herein reported, originating from 20 %-mutant load 6
carriers, are mutation-free or heteroplasmic up to 75% with an apparently random 7
distribution of heteroplasmy, the only two reports on m.8993T>G at Day 3-Day 5 8
embryonic stage indicated that the 3 NARP embryos from a 18-% mutant load carrier 9
were either wild-type or mutant homoplasmic (Steffann et al., 2006), the 5 remaining 10
ones carrying low levels of heteroplasmy (4-22%, Tajima et al., 2007). Though the 11
low number of embryos analyzed so far precludes drawing firm conclusion on a 12
putative difference of segregation between m.8993T>G and m.3243A>G molecules 13
during oogenesis, these apparently different patterns of segregation are however 14
substantiated by the few available analyses of primary oocytes from carriers of these 15
mutations (Blok et al., 1997; Brown et al., 2001). A wild-type (1/7) or mutant 16
homoplasmic state (6/7) was indeed the rule in the 7 NARP primary oocytes from a 17
50%-mutant load carrier, contrasting with the presence of heteroplasmy in 90% of 82 18
primary oocytes in a m.3243A>G carrier with a 8 %- mutant load in WBC. It can be 19
speculated from these data that bottleneck would be of different size between 20
m.3243A>G and m.8993T>G. 21
Whether a purifying selection operates in the human germline against 22
m.8993T>G and m.3243A>G is a matter of debate. Our data in early NARP embryos 23
(Steffann et al., 2006), those from the analysis of primary oocytes in a m8993T>G 24
carrier (Blok et al 1997), as well as our previous report on 2 fetuses with a mutant 25 3 4 5 6 7 8 9 10 11 12 13 14 15 16 17 18 19 20 21 22 23 24 25 26 27 28 29 30 31 32 33 34 35 36 37 38 39 40 41 42 43 44 45 46 47 48 49 50 51 52 53 54 55 56 57 58 59 60
For Peer Review
load over 85 % from 2 m8993T>G carriers with a 30% mutant load in WBC (Steffann 1
et al. 2007), clearly argue against such a negative selection for this mutation in 2
human. As mentioned above, no conclusion can be drawn at this point on the 3
occurrence of a purifying selection against m.3243A>G in the human germ line, 4
owing to the limited number of data we achieved, all drawn from low (20 %) mutant 5
load carriers. It has however to be emphasized that we never observed any fetus 6
with a mutant load over 80% among the 8 pregnancies from 6 m.3243A>G carriers 7
with a WBC mutant load equal or even higher than 30 % (patients 6-9, 11, 12, table 8
1), These data are difficult to reconcile with those from murine germline segregation 9
studies indicating that mutations in protein coding genes of mtDNA are strongly 10
selected against, whereas mutations affecting tRNA genes (such as m.3243A>G) are 11
largely refractory from such a process (Fan et al, 2008, Stewart et al, 2008). 12
Regarding the somatic tissue development, we previously showed the 13
existence of fetuses carrying m.8993T>G with various degrees of mutant loads, from 14
0% to 100 %, over the 10-GW stage of pregnancy until delivery (Steffann et al., 15
2007). m.8993T>G and m.3243A>G mutant loads remain at a steady-state level with 16
time or across various tissues, thus supporting a random segregation of mutant 17
mtDNA molecules throughout somatic embryo-fetogenesis irrespective of the 18
mutation type. 19
In conclusion, one can speculate that the bottleneck size, and possibly, the 20
mutant load threshold critical for embryo/fetus survival, varies among mtDNA 21
mutations, thus hampering genetic counselling and PND/PGD procedures in 22
mitochondriopathies resulting from “private” mtDNA mutations. To test this 23
speculation, we will need to collect data on mtDNA mutant loads for other rarer 24 mtDNA mutations. 25 3 4 5 6 7 8 9 10 11 12 13 14 15 16 17 18 19 20 21 22 23 24 25 26 27 28 29 30 31 32 33 34 35 36 37 38 39 40 41 42 43 44 45 46 47 48 49 50 51 52 53 54 55 56 57 58 59 60
For Peer Review
1 2Acknowledgments
3 4We gratefully acknowledge Dr C Elie and Dr JP Jais for their assistance with the 5
statistics. We also thanks the families for their cooperation. This research was 6
supported, in part, by grants from l’Association Française contre les Myopathies 7
(AFM), l’Agence de Biomédecine, l’INSERM, and the European network Mitocircle. 8
S.M was funded by l’AFM 9
10
Web resources
11
12
Online Mendelian Inheritance in Man (OMIM), http://www.ncbi.nlm.nih.gov/Omim 13 3 4 5 6 7 8 9 10 11 12 13 14 15 16 17 18 19 20 21 22 23 24 25 26 27 28 29 30 31 32 33 34 35 36 37 38 39 40 41 42 43 44 45 46 47 48 49 50 51 52 53 54 55 56 57 58 59 60
For Peer Review
References
1
2
Bergstrom CT, Pritchard J. 1998. Germline bottlenecks and the evolutionary 3
maintenance of mitochondrial genomes. Genetics 149(4):2135-46. 4
Blok RB, Gook DA, Thorburn DR, Dahl HH. 1997. Skewed segregation of the mtDNA 5
nt 8993 (T-->G) mutation in human oocytes. Am J Hum Genet 60(6):1495-501. 6
Bouchet C, Steffann J, Corcos J, Monnot S, Paquis V, Rotig A, Lebon S, Levy P, 7
Royer G, Giurgea I, Gigarel N, Benachi A, Dumez Y, Munnich A, Bonnefont 8
JP.. 2006. Prenatal diagnosis of myopathy, encephalopathy, lactic acidosis, 9
and stroke-like syndrome: contribution to understanding mitochondrial DNA 10
segregation during human embryofetal development. J Med Genet 11
43(10):788-92. 12
Brown DT, Samuels DC, Michael EM, Turnbull DM, Chinnery PF. 2001. Random 13
genetic drift determines the level of mutant mtDNA in human primary oocytes. 14
Am J Hum Genet 68(2):533-6. 15
Cao L, Shitara H, Horii T, Nagao Y, Imai H, Abe K, Hara T, Hayashi J, Yonekawa H. 16
2007. The mitochondrial bottleneck occurs without reduction of mtDNA 17
content in female mouse germ cells. Nat Genet 39(3):386-90. 18
Cao L, Shitara H, Sugimoto M, Hayashi J, Abe K, Yonekawa H. 2009. New evidence 19
confirms that the mitochondrial bottleneck is generated without reduction of 20
mitochondrial DNA content in early primordial germ cells of mice. PLoS Genet 21
5(12):e1000756. 22
Cardaioli E, Fabrizi GM, Grieco GS, Dotti MT, Federico A. 2000. Heteroplasmy of the 23
A3243G transition of mitochondrial tRNA(Leu(UUR)) in a MELAS case and in 24
a 25-week-old miscarried fetus. J Neurol 247(11):885-7. 25
Chinnery PF, Howell N, Lightowlers RN, Turnbull DM. 1997. Molecular pathology of 26 3 4 5 6 7 8 9 10 11 12 13 14 15 16 17 18 19 20 21 22 23 24 25 26 27 28 29 30 31 32 33 34 35 36 37 38 39 40 41 42 43 44 45 46 47 48 49 50 51 52 53 54 55 56 57 58 59 60
For Peer Review
MELAS and MERRF. The relationship between mutation load and clinical 1
phenotypes. Brain 120 ( Pt 10):1713-21. 2
Chinnery PF, Howell N, Lightowlers RN, Turnbull DM. 1998. Genetic counseling and 3
prenatal diagnosis for mtDNA disease. Am J Hum Genet 63(6):1908-11. 4
Chinnery PF, Zwijnenburg PJ, Walker M, Howell N, Taylor RW, Lightowlers RN, 5
Bindoff L, Turnbull DM. 1999. Nonrandom tissue distribution of mutant mtDNA. 6
Am J Med Genet 85(5):498-501. 7
Chou YJ, Ou CY, Hsu TY, Liou CW, Lee CF, Tso DJ, Wei YH. 2004. Prenatal 8
diagnosis of a fetus harboring an intermediate load of the A3243G mtDNA 9
mutation in a maternal carrier diagnosed with MELAS syndrome. Prenat Diagn 10
24(5):367-70. 11
Craven L, Tuppen HA, Greggains GD, Harbottle SJ, Murphy JL, Cree LM, Murdoch 12
AP, Chinnery PF, Taylor RW, Lightowlers RN, Herbert M, Turnbull DM. 2010. 13
Pronuclear transfer in human embryos to prevent transmission of 14
mitochondrial DNA disease. Nature 465(7294):82-5. 15
Cree LM, Samuels DC, de Sousa Lopes SC, Rajasimha HK, Wonnapinij P, Mann JR, 16
Dahl HH, Chinnery PF. 2008. A reduction of mitochondrial DNA molecules 17
during embryogenesis explains the rapid segregation of genotypes. Nat Genet 18
40(2):249-54. 19
Cui XF, Li HH, Goradia TM, Lange K, Kazazian HH, Jr., Galas D, Arnheim N. 1989. 20
Single-sperm typing: determination of genetic distance between the G 21
gamma-globin and parathyroid hormone loci by using the polymerase chain 22
reaction and allele-specific oligomers. Proc Natl Acad Sci U S A 86(23):9389-23
93. 24
Dean NL, Battersby BJ, Ao A, Gosden RG, Tan SL, Shoubridge EA, Molnar MJ. 25 3 4 5 6 7 8 9 10 11 12 13 14 15 16 17 18 19 20 21 22 23 24 25 26 27 28 29 30 31 32 33 34 35 36 37 38 39 40 41 42 43 44 45 46 47 48 49 50 51 52 53 54 55 56 57 58 59 60
For Peer Review
2003. Prospect of preimplantation genetic diagnosis for heritable mitochondrial 1
DNA diseases. Mol Hum Reprod 9(10):631-8. 2
Fan W, Waymire KG, Narula N, Li P, Rocher C, Coskun PE, Vannan MA, Narula J, 3
Macgregor GR, Wallace DC. 2008. A mouse model of mitochondrial disease 4
reveals germline selection against severe mtDNA mutations. Science 5
319(5865):958-62. 6
Ferlin T, Landrieu P, Rambaud C, Fernandez H, Dumoulin R, Rustin P, Mousson B. 7
1997. Segregation of the G8993 mutant mitochondrial DNA through 8
generations and embryonic tissues in a family at risk of Leigh syndrome. J 9
Pediatr 131(3):447-9. 10
Frederiksen AL, Andersen PH, Kyvik KO, Jeppesen TD, Vissing J, Schwartz M. 11
2006. Tissue specific distribution of the 3243A->G mtDNA mutation. J Med 12
Genet 43(8):671-7. 13
Gigarel N, Frydman N, Burlet P, Kerbrat V, Steffann J, Frydman R, Munnich A, Ray 14
PF. 2004. Single cell co-amplification of polymorphic markers for the indirect 15
preimplantation genetic diagnosis of hemophilia A, X-linked 16
adrenoleukodystrophy, X-linked hydrocephalus and incontinentia pigmenti loci 17
on Xq28. Hum Genet 114(3):298-305. 18
Gigarel N, Ray PF, Burlet P, Frydman N, Royer G, Lebon S, Bonnefont JP, Frydman 19
R, Munnich A, Steffann J. 2005. Single cell quantification of the 8993T>G 20
NARP mitochondrial DNA mutation by fluorescent PCR. Mol Genet Metab 21
84(3):289-92. 22
Goto Y, Horai S, Matsuoka T, Koga Y, Nihei K, Kobayashi M, Nonaka I. 1992. 23
Mitochondrial myopathy, encephalopathy, lactic acidosis, and stroke-like 24
episodes (MELAS): a correlative study of the clinical features and 25 3 4 5 6 7 8 9 10 11 12 13 14 15 16 17 18 19 20 21 22 23 24 25 26 27 28 29 30 31 32 33 34 35 36 37 38 39 40 41 42 43 44 45 46 47 48 49 50 51 52 53 54 55 56 57 58 59 60
For Peer Review
mitochondrial DNA mutation. Neurology 42(3 Pt 1):545-50. 1Harding AE, Holt IJ, Sweeney MG, Brockington M, Davis MB. 1992. Prenatal 2
diagnosis of mitochondrial DNA8993 T----G disease. Am J Hum Genet 3
50(3):629-33. 4
Inoue K, Nakada K, Ogura A, Isobe K, Goto Y, Nonaka I, Hayashi JI. 2000. 5
Generation of mice with mitochondrial dysfunction by introducing mouse 6
mtDNA carrying a deletion into zygotes. Nat Genet 26(2):176-81. 7
Jenuth JP, Peterson AC, Fu K, Shoubridge EA. 1996. Random genetic drift in the 8
female germline explains the rapid segregation of mammalian mitochondrial 9
DNA. Nat Genet 14(2):146-51. 10
Jeppesen TD, Schwartz M, Frederiksen AL, Wibrand F, Olsen DB, Vissing J. 2006. 11
Muscle phenotype and mutation load in 51 persons with the 3243A>G 12
mitochondrial DNA mutation. Arch Neurol 63(12):1701-6. 13
Laipis PJ, Van de Walle MJ, Hauswirth WW. 1988. Unequal partitioning of bovine 14
mitochondrial genotypes among siblings. Proc Natl Acad Sci U S A 15
85(21):8107-10. 16
Leshinsky-Silver E, Perach M, Basilevsky E, Hershkovitz E, Yanoov-Sharav M, 17
Lerman-Sagie T, Lev D. 2003. Prenatal exclusion of Leigh syndrome due to 18
T8993C mutation in the mitochondrial DNA. Prenat Diagn 23(1):31-3. 19
Lin DP, Huang CC, Wu HM, Cheng TC, Chen CI, Lee MS. 2004. Comparison of 20
mitochondrial DNA contents in human embryos with good or poor morphology 21
at the 8-cell stage. Fertil Steril. 81(1):73-9. 22
Maagaard A, Holberg-Petersen M, Kvittingen EA, Sandvik L, Bruun JN. 2006. 23
Depletion of mitochondrial DNA copies/cell in peripheral blood mononuclear 24
cells in HIV-1-infected treatment-naïve patients. HIV Med. 7(1):53-8. 25 3 4 5 6 7 8 9 10 11 12 13 14 15 16 17 18 19 20 21 22 23 24 25 26 27 28 29 30 31 32 33 34 35 36 37 38 39 40 41 42 43 44 45 46 47 48 49 50 51 52 53 54 55 56 57 58 59 60
For Peer Review
Manouvrier S, Rotig A, Hannebique G, Gheerbrandt JD, Royer-Legrain G, Munnich 1
A, Parent M, Grunfeld JP, Largilliere C, Lombes A, Bonnefont JP. 1995. Point 2
mutation of the mitochondrial tRNA(Leu) gene (A 3243 G) in maternally 3
inherited hypertrophic cardiomyopathy, diabetes mellitus, renal failure, and 4
sensorineural deafness. J Med Genet 32(8):654-6. 5
Marchington DR, Macaulay V, Hartshorne GM, Barlow D, Poulton J. 1998. Evidence 6
from human oocytes for a genetic bottleneck in an mtDNA disease. Am J Hum 7
Genet 63(3):769-75. 8
Marchington DR, Scott-Brown M, Barlow DH, Poulton J. 2006. Mosaicism for 9
mitochondrial DNA polymorphic variants in placenta has implications for the 10
feasibility of prenatal diagnosis in mtDNA diseases. Eur J Hum Genet 11
14(7):816-23. 12
Marchington D, Malik S, Banerjee A, Turner K, Samuels D, Macaulay V, Oakeshott 13
P, Fratter C, Kennedy S, Poulton J. 2010 Information for genetic management 14
of mtDNA disease: sampling pathogenic mtDNA mutants in the human 15
germline and in placenta. J Med Genet 47(4):257-61. 16
Matthews PM, Hopkin J, Brown RM, Stephenson JB, Hilton-Jones D, Brown GK. 17
1994. Comparison of the relative levels of the 3243 (A-->G) mtDNA mutation 18
in heteroplasmic adult and fetal tissues. J Med Genet 31(1):41-4. 19
McArthur SJ, Leigh D, Marshall JT, de Boer KA, Jansen RP. 2005. Pregnancies and 20
live births after trophectoderm biopsy and preimplantation genetic testing of 21
human blastocysts. Fertil Steril 84(6):1628-36. 22
Parfait B, Rustin P, Munnich A, Rotig A. 1998. Co-amplification of nuclear 23
pseudogenes and assessment of heteroplasmy of mitochondrial DNA 24
mutations. Biochem Biophys Res Commun 247(1):57-9. 25 3 4 5 6 7 8 9 10 11 12 13 14 15 16 17 18 19 20 21 22 23 24 25 26 27 28 29 30 31 32 33 34 35 36 37 38 39 40 41 42 43 44 45 46 47 48 49 50 51 52 53 54 55 56 57 58 59 60