Dealing with Complexities in Digital Supply Chain
byJamica Baltazar Brillante
Master of Science, Industrial Engineering, De La Salle University, Philippines, 2012 and
Yoon-Joo Lee
Bachelor of Business Admin., Business Admin., Kyung Hee University, South Korea, 2011
SUBMITTED TO THE PROGRAM IN SUPPLY CHAIN MANAGEMENT IN PARTIAL FULFILLMENT OF THE REQUIREMENTS FOR THE DEGREE OF
MASTER OF APPLIED SCIENCE IN SUPPLY CHAIN MANAGEMENT AT THE
MASSACHUSETTS INSTITUTE OF TECHNOLOGY
May 2020
© 2020 Jamica Baltazar Brillante and Yoon-Joo Lee. All rights reserved.
The authors hereby grant to MIT permission to reproduce and to distribute publicly paper and electronic copies of this capstone document in whole or in part in any medium now known or hereafter created.
Signature of Author: _____________________________________________________________ Department of Supply Chain Management
May 8, 2020 Signature of Author: _____________________________________________________________
Department of Supply Chain Management May 8, 2020 Certified by: ____________________________________________________________________
Maria Jesus Saenz Gil De Gomez Executive Director, Supply Chain Management Blended Program Capstone Advisor Certified by: ____________________________________________________________________ Özden Tozanli Yilmaz Postdoctoral Associate Capstone Co-Advisor
Accepted by: ____________________________________________________________________ Prof. Yossi Sheffi Director, Center for Transportation and Logistics Elisha Gray II Professor of Engineering Systems Professor, Civil and Environmental Engineering
Dealing with Complexities in Digital Supply Chain
byJamica Brillante and Yoon-Joo Lee
Submitted to the Program in Supply Chain Management on May 8, 2020 in Partial Fulfillment of the
Requirements for the Degree of Master of Applied Science in Supply Chain Management
ABSTRACT
The digital supply chain is rapidly evolving, putting greater pressure on suppliers to adopt to the dynamic demands of the buyers. This paper explores how supply chain complexities and buyer-supplier relationships as a complex adaptive system interact with an integrated and enacted external environment and drive the key supply chain performance of the supplier. Econometric modeling through fixed effects panel data analysis and seemingly unrelated regression analysis were conducted to analyze the impact between supply chain complexities, buyer-supplier relationship attributes, and supply chain performance through time. Consequently, moderation analysis and sensitivity analysis were conducted to determine the effects of the interpreted and enacted environment perspective. Results show supply chain complexities and buyer-supplier relationships have different impact on service level and sales that changes in degree and significance through time. Moreover, uncertainties and external attributes as the model representation of the interpreted and enacted environment have notable influences on the emergent system properties of the system.
Capstone Advisor: Maria Jesus Saenz Gil De Gomez
Title: Executive Director, Supply Chain Management Blended Program Capstone Co-Advisor: Ozden Tozanli Yilmaz
ACKNOWLEDGEMENTS
We wish to thank our advisors Dr. Maria Jesus Saenz Gil De Gomez and Dr. Ozden Tozanli Yilmaz for helping us immerse in research and for guiding us thoroughly to complete this project. Their utmost dedication to challenge our capabilities and way of thinking by the sharing of their invaluable academic expertise had opened our eyes to a wide field of research opportunities.
We would also like to thank MIT, specifically the Center for Transportation and Logistics, for opening an avenue for us to learn deeply through the real-life application of Digital Transformation in Supply Chain Management. Our gratitude goes to all our professors who have enormously cultivated our education to prepare us in our respective careers and future endeavors.
Most especially, we would like to thank our families, sponsors, SCM department, SCM colleagues, and friends who have been our source of support and inspiration amid this uniquely challenging time brought about by the pandemic.
Table of Contents
List of Figures ... 5
List of Tables ... 5
1 Introduction ... 6
2 Literature Review ... 8
2.1 Complexities in Digital Supply Chain ... 9
2.2 Digital Supply chain as a Complex Adaptive System ... 12
2.2.1 Complex Adaptive System ... 12
2.2.2 Supply Chain Network as a Complex Adaptive System ... 12
2.2.3 Computing Supply Chain Network as a Complex Adaptive System ... 13
2.3 Hypotheses ... 15
2.4 Analyzing Computing Supply Chain as a Complex Adaptive System ... 17
2.4.1 Cross-Sectional Analysis ... 18
2.4.2 Longitudinal Analysis... 18
3 Research Methodology ... 21
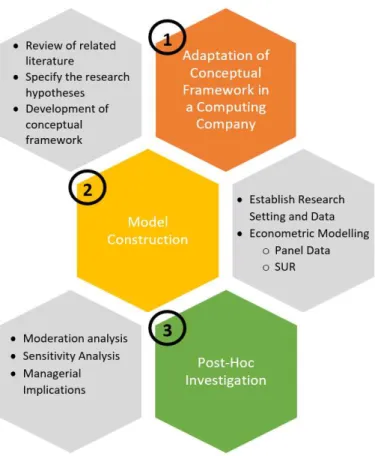
3.1 Adaptation of the Conceptual Framework in a Computing Company ... 22
3.2 Model Construction ... 24
3.2.1 Index Variables ... 25
3.2.2 Independent Variables ... 25
3.2.3 Dependent Variables ... 26
3.2.4 Data Preparation and Initial Diagnostics ... 26
3.2.5 Econometric Model ... 27
3.3 Post-Hoc Investigation ... 29
4 Results and Analysis ... 30
4.1 Econometric Modelling ... 30
4.1.1 Fixed effects Panel Data Analysis ... 31
4.1.2 Seemingly Unrelated Regression ... 34
4.2 Moderation analysis ... 37
4.3 Sensitivity analysis for external environment and emergent system properties ... 39
5 Discussion and Managerial Implications ... 44
5.1 Understanding complex adaptive system in digital industry ... 44
5.2 Managerial Implications ... 47 6 Conclusion ... 49 6.1 Final Remarks ... 49 6.2 Future research ... 51 References ... 52 List of Figures Figure 1: Conceptual model of the revised complex adaptive system (Nair & Reed-Tsochas, 2019) ... 7
Figure 2: Overview of the Methodology ... 21
Figure 3: Complex and Adaptive Computing Supply Chain Dynamics ... 23
Figure 4: Variables embedded in the Complex Adaptive Computing Supply Chain System ... 27
Figure 5: Conceptual Scheme for Seemingly Unrelated Regression ... 28
List of Tables Table 1: Complexities in the Computing Business ... 10
Table 2: Computing Industry mirrored in CAS ... 14
Table 3: Hypotheses for Emergent System Properties Based on CAS Perspective ... 17
Table 4: Independent and Dependent Variables ... 24
Table 5: Pearson Correlation Matrix for all Independent Variables ... 31
Table 6: Results of Fixed-Effects Panel Data Models (DV = Order Delay) ... 32
Table 7: Results of Fixed-Effects Model (DV = Sales) ... 33
Table 8: Results of Seemingly Unrelated Regression Analysis ... 36
Table 9: Moderation Analysis for Order Delays ... 37
Table 10: Moderation Analysis for Sales Amount ... 38
1 Introduction
The global demand for the digital computing market utilizing remote data storage and cloud processing system has grown tremendously in the recent years. Companies are now looking into reducing costs from managing rapidly accumulating data, operating efficient processes, and improving global
network communication (Marketline, 2018). Driven by rapid development of technology, cloud computing service providers, in particular, continue to offer new innovative features like machine learning and edge computing, among others. In turn, new features drive further increase in industry demand which is estimated to reach USD 322.9 billion over the next five years (FitchSolutions, 2019). These trends
emphasize the increasing role of digital supply chains in coping with unprecedented market changes. Kannan and Thomas (2018) discussed how the explosive demand growth of digital computing services led to heavy capital expenditures mostly of data-center components such as storage, memory,
servers, and peripherals. This surge in demand has been favorable to data-center suppliers as they gain more relevance in the market. However, suppliers are now facing great difficulties due to the advent of “hyperscalers”, who are the rapidly-growing and highly-innovative cloud service providers such as Google, Microsoft, Amazon and Oracle, among others. Data center suppliers are challenged with volatile product
volumes, short product turnaround cycles, and complex requirements for high-level customization. These subsequent interactions impact the digital supply chain by making business decisions for the suppliers very challenging without a thorough understanding of the complexity and dynamics of the system.
One of the major contributors to this complex supply chain system is the “buyer-supplier
relationship,” which causes subsequent collateral complexities. As an example, surges in order volume of the buyer driven by rapidly increasing product demand in the market and advent of new digital technology. This relationship, along with complexities within supply chain network, plays a unique role in
The complex and adaptive dynamics of the buyer-supplier relationship in a supply chain can be better understood in the framework of a complex adaptive system (CAS) (Choi et al., 2001; Pathek et al.
2007; Nair et al., 2019). The conceptual model in Figure 1 encapsulates the peculiar characteristics of the buyer-supplier relationship, which is “emergent system properties” of the direct outcome of the behaviors of each agent (such as contractual relationship between buyers and suppliers), and the indirect consequences of impact by the relevant market environment. The coevolution of these two factors lead
to collateral changes in the agents and the environment. Such a dynamic and market adaptive aspect of the buyer-supplier relationship constantly reshapes the whole system.
Figure 1: Conceptual model of the revised complex adaptive system (Nair & Reed-Tsochas, 2019)
As mentioned above, the digital industry is rapidly evolving, putting greater pressure on suppliers to adopt to the dynamic demands of the buyers. Although many studies have been conducted on the
application of computing technology in supply chain management, few have focused on understanding the supply chain of the digital computing service industry itself. The key to understand complexities in this supply chain is the link between the suppliers and the buyers.
With this motivation, this paper explored how buyer-supplier relationships as a complex adaptive system interact with supply chain complexities and the external environment, and drive the key supply
chain performance of the suppliers. This method brings new insights to companies seeking to digitally transform their management analytical ability by making effective use of their digital data assets.
For this purpose, literatures related to digital supply chain and complex adaptive system theory
were reviewed. In addition, implication of complex adaptive system framework on digital supply chain was also explored. Then, 10 hypotheses were set up to analyze attributes of digital supply chain within CAS framework. The hypotheses were tested using four (4) analytics methods, namely panel data analysis,
seemingly unrelated regression, moderation analysis, and sensitivity analysis. These analyses depicted the interaction between 5 features of buyer-supplier relationships and 5 features of supply chain complexities for 7,677 buyer-supplier relationships in 3-year time frame, within the context of computing industry.
Complementary features of the 3,300 buyers’ characteristics, including revenue, company size, and years in the industry, were also utilized to measure how these features impact the system as moderators. Based on the findings (Section 4), the paper concludes by discussing managerial implications (Section 5) and future research (Section 6).
2 Literature Review
The rapid development of computing and other digital technologies such as big data applications,
Internet of Things, and artificial intelligence has ingrained the use of data centers into the everyday lives of the people and at the forefront of the IT industry (Islam, Ruci, Hossain, Andersson, & Kor, 2019; Barroso, Hölzle, & Ranganathan, 2018). Hyperscalers such as Amazon, Google, Microsoft, Facebook, and Alibaba
run extremely large data centers containing numerous servers and involving large capital expenditures (Castro-Leon & Harmon, 2016). Data centers are unique infrastructures responsible for housing and running real-time data operations virtually and performing extensive data computations (Faiz & Noor-E-Alam, 2019). They conduct an important role in the computing industry, interacting both in upstream and
Hyperscalers are the main customers or buyers of data centers. Consequently, a number of data centers with larger infrastructure and more powerful computing systems, often called “Hyperscale Data
Centers” or “Warehouse Scale Computers,” are being built to cater to the increasing data usage, storage, and processing requirements (US Chamber of Commerce Technology Engagement Center [C_TEC], 2017; Rezaei-Mayahi, Rezazad, & Sarbazi-Azad, 2019; Barroso et al., 2018). However, these data centers have dynamic complexities arising making it difficult to be anticipated or controlled by its owners (Lynn, 2018).
As the reliability requirement of the buyers increase, the costs and complexities of the data center infrastructure also increase (C_TEC, 2017). While these complexities already exist in small-scale systems, they are further amplified in the larger data center infrastructures typical of hyperscalers (Lynn, 2018; Rezaei-Mayahi, Rezazad, & Sarbazi-Azad, 2019). Focusing on this expanse of the digital supply chain will
help in understanding how to manage complexities to better meet the growing needs of customers. The following sections will elaborate on the complexities of digital supply chains and how digital supply chain can be characterized as a complex adaptive system in a computing industry context.
2.1 Complexities in Digital Supply Chain
Digital supply chain deals with the management of supply chain processes using a wide array of
innovative technologies like cloud computing and Internet of Things (Büyüközkan and Göçer, 2018). One common example of a digital supply chain is the data center supply chain. Data centers follow an exponentially increasing trend in internet usage, running applications, or requirements for data storage (C_TEC, 2017). Scaling up data centers, particularly large computing platforms, comes with a high price as
it is dependent on a lot of complexities such as processing capabilities, storage volume, location, service levels to name a few. A study by Yang and Lin (2019) focused on understanding the meaning and quantifying supply chain complexities and came up with three types of complexities namely network
complexity, process complexity, and product complexity. Table 2 summarizes the factors to consider in understanding the complexities in a computing business context.
Table 1: Complexities in the Computing Business
Type Factors to Consider Sources
Essential Characteristics of
Computing Service On-demand self service Broad network access Resource Pooling Rapid elasticity Measured service
o Mell & Grance (2011)
Supply Chain Complexity Network Complexities Location of facilities
Distribution channel (includes route, origins and destinations)
Ownership of the data centers Number of suppliers
Process Complexities
Demand information links Process requirement Product Complexities
Product size (e.g. storage capacity) Product type (e.g. processing speed) Maintenance of the data centers
(including back-up systems) Scale of the applications offered
(e.g. software requirement) Number of end-users
o Barroso et al., 2018 o Hardy, 2018 o C_TEC, 2017 o Lynn, 2018
o Yang and Lin, 2019
Service Level of the Data
Centers Reliability of the Data Center Performance (or Downtime) Customer Response Time Lead Time
o Faiz & Noor-E-Alam, 2019 o Barroso et al., 2018
Buyer-Supplier Challenges Lower product costs Reduced time-to market Joint-improved product quality Advanced technology (innovation) Improved service/delivery
Highly scalable services
o Rinehart, Eckert, Handfield, Page, & Atkin, 2004
o Marston, Li, Bandyopadhyay, Zhang, & Ghalsasi, 2011
In a report by Mell & Grance (2011), the National Institute of Standards and Technology (NIST) established five essential characteristics of a computing model: 1) On-demand self-service 2) Broad
network access 3) Resource Pooling 4) Rapid elasticity and 5) Measured Service. These characteristics highlight the important capabilities or functions to consider as suppliers anticipate and meet the changing demand of consumers. Buyers, the hyperscalers, are looking into these as measures of their product or service which would also be helpful for suppliers to understand. In terms of the complexities that revolve
around the computing industry, Yang & Lin (2019) concluded that there is not one common definition of the complexities and that several studies gave their own interpretation depending on the applications in their studies. Further, Yang & Lin (2019) divided supply chain complexities into three distinct types: 1) network complexity reflects the supply and demand network nodes, 2) process complexity considers the
business process of the departments and the information exchanges in between, 3) product complexity includes the number of parts, variety of products and other manufacturing complexities.
With the dynamic complexities involved in the computing supply chains, the relationships of
buyers and suppliers either affect the supply chain’s interactions or cause extraordinary impact on its service level. Supply chain has foreseen advantages in enhancing relationships between companies, and improving economic and external environment performance (Schniederjans & Hales, 2016), which also includes additional benefits in supplier relationships and performance (Benlian & Hess, 2011; Marston et
al., 2011). Additionally, one of the main motivations for the evolving relationship between buyers and suppliers is the capital and operational cost requirement. As such, several industry solutions have been introduced that involve either owning or leasing data centers. Data centers can either be owned, as is the
case with many large corporations or government institutions, or be leased from data center service providers who manage the facilities (C_TEC, 2017).
2.2 Digital Supply chain as a Complex Adaptive System
2.2.1 Complex Adaptive System
The theoretical paradigm of CAS refers to a network of agents which are adaptive to changes in the environment surrounding them and the system they are within (Pathek et al., 2007). This has been a
useful lens to help understand complexities in many fields, ranging from ecosystems, the biosphere, all the way to economies and organization management (Levin, 1998).
Anderson (1999) listed four key aspects of CAS. First, each agent (or entity) in the network makes decisions based on its own cognitive structure or schema. The schema of multiple agents may or may not
be similar. Second, the behaviors of each agent are often influenced by other agents, resulting to subsequent changes in the overall system. For this reason, CAS is often described as a “self-organizing” system. Third, changes in the environment result in collateral changes in the agents and the environment,
resulting in “co-evolution”. Fourth, as the existing agents within the system continuously transform or eventually exit, followed by new agents, CAS evolves over time. The networks of the agents will also evolve over time, changing the overall patterns or structures of the system.
2.2.2 Supply Chain Network as a Complex Adaptive System
Choi et al. (2001) noted that supply chain network is an exemplary CAS, stressing that a better understanding of the dynamics of the whole system results in more effective supply chain policies. They further explained that CAS consists of evolving interactions among “agents” such as buyers or suppliers, the “environment” surrounding the agents and co-evolution resulting from this interaction between the
agents and the environment. Pathak (2007) supported this argument by referring to a supply chain network as an independent network choosing to survive as a collective system that evolves and
self-Nair and Reed-Tsochas (2019) further developed detailed framework by diving up the environment into the “interpreted and enacted environment,” which directly interact with the agents,
and the “external environment” which does not affect the agents (see Figure 1). However, the boundary between “interpreted and enacted environment” and “external environment” is not static but dynamic as agents may interact with factors in external environment as time goes by. Nair and Reed-Tsochas (2019) also categorized macro and micro attributes of each factor. Agents are micro, and emergent system
properties, which is the outcome of the interactions between agents and environment, are macro. However, environment may have both attributes of micro and macro, or “meso”. Under this framework, they argue CAS concept should be understood as states of micro-meso-macro.
2.2.3 Computing Supply Chain Network as a Complex Adaptive System
The computing industry is well-mirrored in the revised CAS paradigm of Nair and Reed-Tsochas (2019), agents are buyers (computing service providers – “hyperscalers”) and suppliers (server/storage/memory manufacturers, data center solution providers). The network of the agents is the buyer-supplier relationship. In order to provide computing service to the end users, Buyers need data
centers in order to store and compute data from customers. To provide stable and high-speed computing experience to the customers, their data centers need to be properly managed which includes regular replacement of parts and purchase of new equipments. Suppliers, on the other hand, need to respond to orders from the buyers with high-quality products in required lead time. Some suppliers which order and
receive products from original equipment manufacturers (OEMs) need to adequately manage the supply chain with OEMs in order to fulfill requirements from the buyers.
However, due to surging demand in computing service in many industries (the environment), only
a few highly-innovative service providers could meet the rapidly growing demand, which eventually led them to become the hyperscalers. Moreover, due to their innovative efforts, the computing service
platforms are now capable of providing more advanced functions, which, in turn, led to skyrocketing demand on high-performing and customized hardware in their data centers. Such demand from the
buyers naturally affects the suppliers, leading them to many difficulties, including high demand for customization, inaccurate demand forecast, and many others. These factors are the interpreted and enacted environment faced by the agents of the network. The overall summarization is listed in Table 3.
Table 2: Computing Industry mirrored in CAS
Dimension Data-center Industry Perspective Reference
Agent
Buyer: Cloud service providers running their own data centers
Supplier: Server/storage/memory manufacturers, data center solution providers
o Kannan and Thomas (2018)
o FitchSolutions (2019) Interpreted &
Enacted Environment
Capacity of computing expands from simple storage to more advanced functions
Surging demand of computing service from the end-user market in terms of scale and scope
Emergent System Properties
Due to constantly added high-tech and innovative functions running on computing, buyers require suppliers for more high-tech and innovative products in rapid pace
Only major few cloud service providers meet surging demand from the end-users, which turned them into “Hyperscalers” (Amazon, Microsoft, Google, etc.)
Due to the advent of Hyperscalers as buyers, suppliers face the following difficulties:
Increasing number of delivery destinations, surge in order volume, on-demand delivery, rapid innovation
2.3 Hypotheses
In the perspective of computing supply chain network as a CAS, analyzing the dynamics caused by complexities in the supply chain system should also be explored under the CAS framework. As mentioned earlier, Nair and Reed-Tsochas (2019) categorized agents as micro attributes, emergent system properties
as macro attributes, and external environment factors as both micro and macro-specification. Adopting the approach of Nair and Reed-Tsochas (2019), this paper will divide up the analysis scopes accordingly. For micro states, which involve interaction between agents, the analysis will be conducted by measuring how supply chain performances are impacted by complexity factors of the agents, which are suppliers and
buyers. Due to the data restraint, the analysis will be conducted in the eyes of suppliers.
In terms of suppliers, the main performance index of their supply chain operations would be service level, which include punctual delivery, and sales amount, as a result of customer satisfaction on their supply chain operations. These performances are the results of suppliers’ operations under
complexities within the supplier’s supply chain, which can be classified into 2 parts: complexities deriving from suppliers’ supply chain structure and the ones caused by buyer-supplier relationship. Attributes of buyer-supplier relationship are unique in terms of how the attributes themselves are complex and
adaptive. These unique features increase the level of complexities in the micro-level of CAS, which may impact the macro-level system. Hence, to understand how the dynamics of the supply chain attributes within agents affecting the performance, this paper would like to hypothesize and test the followings:
higher supply chain complexity leads to lower service level and lower sales (H1a); and higher values of buyer-supplier relationship attributes lead to high service level and higher sales (H1b).
However, considering the complex and adaptive feature of CAS, the possibility of performance index mutual influencing each other cannot be overlooked. Therefore, this paper would also like to
subsequently influence service level in the following time period (H2a); and Over time, service level and sales will be more strongly associated with their immediately preceding levels than their initial levels (H2b).
After analyzing the micro-level of the CAS, the paper will shift lens to the transitional attributes
between micro- and macro-level system, which are the external attributes of the buyer-supplier relationship. These features include size, revenue and year in the industry of the buyer company. These factors may or may not be influenced by the buyer-supplier relationship, as the level of influence may
differ in accordance with the level of supplier’s influence on the buyer. Nevertheless, considering the possibility, they should not be overlooked in the analysis. Therefore, this paper would also like to hypothesize the followings: external attributes of the buyer-supplier relationship moderate the impact of
agents on the service level (H3a); and external attributes of the buyer-supplier relationship moderate the impact agents on the sales amount (H3b).
For the final phase of the analysis, the paper will conduct analysis on the impact of the external environmental factors, the macro-level attributes. Buyers’ market strategy is out of suppliers’ control, yet
the level of impact on suppliers’ businesses is quite high. For instance, if buyers decide to upgrade the ordering parts, increase the order volumes, expand data centers and make more frequent orders, suppliers will be severely impacted. Hence, this paper would also like to hypothesize the followings: high innovation level of customer causes higher supply chain complexity and leads to lower service level (H4a);
High demand in end-users causes higher buyer-supplier relationship complexity and leads to lower service level (H4b); rapid data center expansion of buyers causes higher buyer-supplier relationship complexity and leads to lower service level (H4c) and high service level requested by buyers causes higher supply
chain complexity and leads to lower service level (H4d). Summary of the all hypotheses are available in Table 1.
Table 3: Hypotheses for Emergent System Properties Based on CAS Perspective
CAS Perspective Hypotheses
Agents Micro
H1a Higher supply chain complexity leads to lower service level and lower sales. H1b Higher values of buyer-supplier relationship attributes lead to high service level and higher sales. H2a Service level influence the sales in the same time period, which will subsequently influence service level in the following time period. H2b Over time, service level and sales will be more strongly associated with their immediately preceding levels than their initial levels.
Interpreted and Enacted Environment
Micro/ Macro
H3a External attributes of the buyers moderate the impact of supply chain complexity and buyer-supplier relationship on the service level.
H3b External attributes of the buyers moderate the impact of supply chain complexity and buyer-supplier relationship on the sales amount.
Macro
H4a Rapid data center expansion of buyers causes higher supply chain complexity and leads to lower service level and lower sales. H4b High demand in end-users causes higher buyer-supplier relationship complexity
and leads to lower service level and lower sales.
H4c High service level requested by buyers causes higher buyer-supplier relationship complexity and leads to lower service level and lower sales. H4d High innovation level of customer causes higher supply chain complexity and leads to lower service level and lower sales.
2.4 Analyzing Computing Supply Chain as a Complex Adaptive System
Analysis of complex adaptive systems in the context of supply chain systems varies in the specific
research objective and scope. Jordon et al. (2010) in studying the implications of CAS theory in health care organizations explained that learning, relationships, and other factors in the dynamics of CAS changes over time. They further pointed out that the patterns in these variations describe what happens to the
organization. Generally, understanding complex adaptive systems falls into two categories: cross-sectional (no time-series component) and longitudinal analysis (involves time series components).
2.4.1 Cross-Sectional Analysis
The cross-sectional approach to complex adaptive systems would be appropriate for studies involving varying agents or factors or concerns at one point in time. One example of this approach is the multinomial regression model analysis applied by Eckerd & Girth (2017) on studying the effect of product
complexity and mission criticality of buyer-supplier pairs. Another cross-sectional study was done by Anderson et al (2003) using correlation analysis to test complexities in the management practices and agent outcomes relationships. A thorough evaluation on complexities impacting a manufacturing system was introduced by Bozarth et al. (2009) where the discrete and non-discrete complexities were
enumerated in each three areas of the supply chain namely upstream, downstream, and internal manufacturing. They evaluated the impact of supply chain complexity on plant performance using a multiple regression modelling not including the evaluation of strategies that can effectively manage the
supply chain. Although these cross-sectional analyses help explain the respective complex adaptive systems, it does not cater for changes through time.
2.4.2 Longitudinal Analysis
Time series is one important element factored in the model as the digital supply chain system
involves understanding the rapid subsequent period of interactions of similar agents. One common method for analyzing the complex adaptive system in a time-based scenario is through agent-based simulation. Yu, Cao, & Schniederjans (2017) used agent-based simulation as they evaluate a four-tier supply chain. They said that a system involving several agents performing various functions within the
context of internal complexities and external environments. Simulation would be appropriate for discrete event dependent processes but a more comprehensive method can be used through econometric modelling – panel data analysis which deals with combining some of the benefits of cross-sectional and
longitudinal approaches (Hsiao, 2007). Further, Hsiao (2007) showed the advantages of two main forms of panel data analysis namely “random effects” and “fixed effects.” The random effects analysis is
beneficial when the parameters should remain constant despite the increase in sample size, when more efficient estimators need to be used in several variations, and when the effects of time-invariant variables need to be added to the analysis. On the other hand, the fixed effects analysis is beneficial when the correlations between the individual and time-specific effects need to be considered in the analysis.
Hausman test is a statistical analysis test conducted to determine whether the econometric model is more appropriate for fixed effects or a random effects panel data analysis.
There are other methods used to study complex adaptive systems through time. Revilla and Rodriguez-Prado (2018) showed how a multi-value treatment effect can be used to determine the causal
impact of creativity to a firm’s innovative capacity. The study from Dhanorkar, Kim, and Linderman (2019) of an online platform business expounded this further by conducting a dyad analysis mainly on a current verses traditional supply network comparison and, within it, they analyzed the dynamics between buyers
and suppliers particularly on the occurrence of “industry homophily”. They used a random effect logit econometric model to capture the time-series effect of their variables.
Autry and Golicic (2010) examined a similar, yet different approach by explaining the buyer
supplier relationship as “spiral” dynamics which depicts how each feature of buyer and supplier eventually correlates in different time frames. They quantified the correlation between relationship strength (among buyer and supplier) and performance of supplier in the construction industry over different time frame using seemingly unrelated regression (SUR) analysis.
As the performance of the supply chain in this study considers similar agents undergoing varying complexities and exogenous variations that behaves differently over time, a longitudinal econometric modelling study is used. Similar to the approach of Dhanorkar et al (2019), this capstone applied the longitudinal panel data analysis on a computing company. This time-based analysis of CAS helped
determine the effect of attributable supply chain complexities as influenced by the buyer-supplier relationships and recommend strategies to improve its performance. However, panel data analysis has
limits in terms of exhibiting relationship of same dependent and independent variables only in different time frame. Such nature of the study may result in negligence of mutual relationship among variables.
Hence, the SUR analysis was utilized to supplement the shortcomings of panel data analysis. SUR analysis helps explore mutually adaptive attributes of variables as it allows modelling “cyclical” linkage
between variables through multiple time periods simultaneously while providing statistical control for correlated error terms, alleviating endogeneity concerns. (Greene, 2003)
Each transaction with its various supply chain complexities develops through time and interplays with the characteristics of the buyer-supplier relationships. According to Hsiao (2007), panel data blends
the dynamics of cross-sectional data and its behavior over time and offers advantages, yielding better accuracy of model parameters, capturing complexity, and simplifying statistical inferences. This is the same approach adopted by Dhanorkar et al. (2019), when they assessed the dynamics of online surplus
networks as a complex adaptive system. A panel data analysis fits the computing supply chain system in this paper as it involves assessing the impact of several attributes running in different periods of time.
Taking all these models into consideration, this paper focuses on using panel data analysis and
SUR analysis for the evaluation of the impact and interactions between supply chain complexities, buyer-supplier relationships, and supply chain performance. These two methods form the base model for the analysis of computing supply chain as a complex adaptive system.
3 Research Methodology
This capstone explores the research questions of how buyer-supplier relationships interact with supply chain complexities and the external environment, and drive the key supply chain performance of the suppliers. The project also examines how quantifying supply chain complexities and buyer-supplier
relationships can improve supply chain performance and help companies set up flexible yet effective strategies to better cope with the complexities. Figure 2 outlines the steps, measures, and tools that were used to achieve the project’s objectives.
3.1 Adaptation of the Conceptual Framework in a Computing Company
The conceptual framework of complex adaptive system by Choi et al (2001) involves three (3) entities namely agents, interpreted and enacted environment, and emergent system properties. Related literature in each of these entities were reviewed in terms of its relevance to a computing supply chain
network. This review can be seen in Section 2 and also include the supply chain complexities and buyer-supplier relationship in the scope of a computing supply chain. Specifically, the research focuses on hyperscalers’ impact on their suppliers brought about by data center expansion, surge in demand, on-demand delivery and rapid innovation in technology.
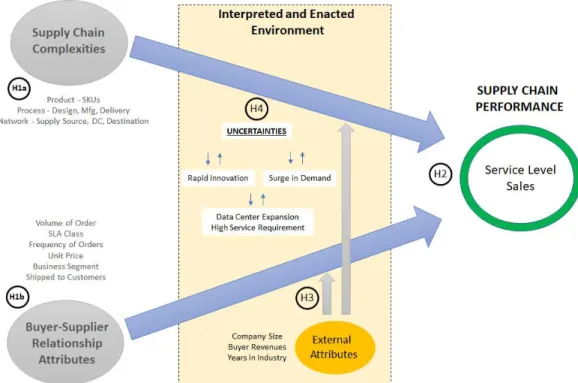
Building upon the idea of understanding the supply chain system as a complex adaptive system (Choi et al., 2001), more detailed conceptual framework is developed in this paper to explore the hypotheses in Table 1. Using the 3 entities, the area of interest that was tested is the emergent system outcomes and the hypotheses revolves around the two other remaining entities namely agents, and
interpreted and enacted environment.
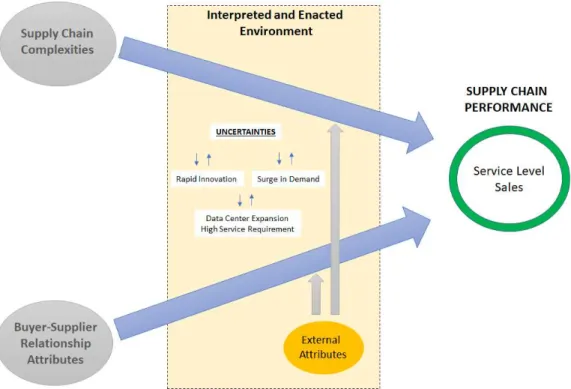
The complex adaptive system conceptual framework was applied in a computing company’s supply chain system as shown in Figure 3. The company termed as the “Supplier” is assessed together
with its customers termed as the “Buyer”. The supplier faces supply chain complexities in terms of product, process, and network. However, new factors derived from the relationship between buyer and supplier intertwined with the existing complexities, resulting in unpredictable outcomes. Only with
adequate adaptation to the volatile change in the system can the businesses manage supply chain stability and even improve their performance.
Figure 3: Complex and Adaptive Computing Supply Chain Dynamics
The conceptual model developed for the computing supply chain in Figure 3 is the overall guide
for the construction of the base model. Supply chain complexities and the buyer-supplier relationship attributes represent the agents and are treated as independent variables in the model. These agents are assessed by their impact on supply chain performance, making service level and sales as dependent variables. The model also considers the effects of the interpreted and enacted environment by capturing
variables representing system uncertainties and external buyer-supplier relationship attributes. The impact of the agents through time is analyzed using fixed-effects panel data analysis and SUR analysis. Consequently, the effects of the interpreted and enacted environment perspective are assessed using
3.2 Model Construction
In this study, a leading computing company, which a supplier for hyperscalers and other powerful computing businesses worldwide, was evaluated. Its operations have inherent supply chain complexities, buyer-supplier relationships, and emergent system properties that can appropriately represent the
complex adaptive system of the computing company operations.
The data provided by the company comprise of 54 features for 3 years describing 7,677 buyer-supplier relationships and 989 products. In addition, complementary features of the 3,300 buyers’ characteristics were gathered from external databases historical revenue, company size, and years in the
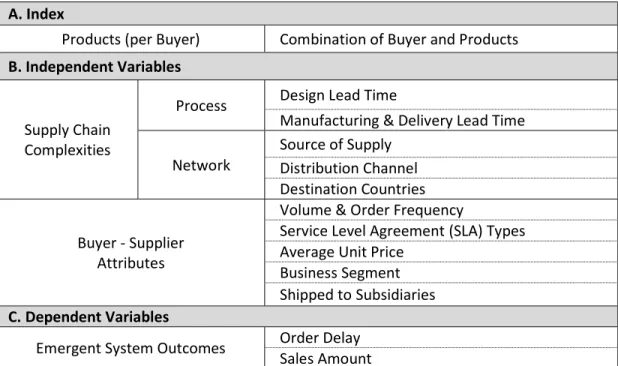
industry. These features were compared with the supply chain complexities and complex adaptive system attributes to draw out the key variables to be analyzed as shown in Table 4.
Table 4: Independent and Dependent Variables A. Index
Products (per Buyer) Combination of Buyer and Products B. Independent Variables
Supply Chain Complexities
Process Design Lead Time
Manufacturing & Delivery Lead Time
Network Source of Supply Distribution Channel Destination Countries Buyer - Supplier Attributes
Volume & Order Frequency
Service Level Agreement (SLA) Types Average Unit Price
Business Segment Shipped to Subsidiaries C. Dependent Variables
3.2.1 Index Variables
The data was organized in accordance with each product per buyer. The core policy of supply chain stemmed from the characteristics of a certain product to be transported. Yet, same product could fulfill different needs for each buyer. For instance, buyer A would require high-performance machinery in
less order frequency to provide highly stable service to the end-users when needed, while buyer B needs more storage machinery in high order frequency as the demand for their new storage service is on a steep increase. Both machines may use same parts, whereas each part is valued differently. This leads to different impacts on supply chain. Aligning the data only by each product would lead to loss of such details.
Therefore, optimal index variable to better represent the overall data is the combination of product information with the buyer identification.
3.2.2 Independent Variables
Supply chain complexity comes from the dynamics of how the buyers interact with the supplier and drive its performance. This complexity is classified into two main components: process (lead-time),
and network (supply chain attributes involved in delivering the products to buyers). Based on the company’s data, process complexity is represented by the involvement of three major processes: design, manufacturing, and delivery. On the other hand, network complexity is defined by the company’s number
of supply source, number of distribution channel, and number of destination areas as the products reach the buyers.
Another aspect driving the dynamics of a computing company supply chain is the different characteristics of a buyer-supplier relationship. As shown in Table 4 above, these include the volume, unit
price, order frequency, the various service level agreement between each buyer and the supplier, and the number of ship-to customers.
3.2.3 Dependent Variables
The emergent system outcomes are the attributes of company’s performance that are challenging to be estimated. Specifically, these outcomes drive the improvement of the service level and are represented by the trends in the company’s order delay period and sales. Order delay period refers to the
number of days the delivery is delayed in terms of the committed delivery date. Sales pertains to the transaction amount involved in the delivery of products to the buyer.
3.2.4 Data Preparation and Initial Diagnostics
The analysis was conducted using R programming language to initiate the evaluation of the model.
The data was first cleaned and prepared before running the panel data analysis. The following steps are performed to structure the raw dataset:
1. Clean up the dataset to remove any duplicates and line items with many missing information. 2. Setup the independent and dependent variables to be considered with an appropriate panel ID
3. Fill-in additional data (buyers’ profile) to be analyzed from external sources 4. Format variables to run in analysis.
5. Standardize and normalize panel data
Figure 4: Variables embedded in the Complex Adaptive Computing Supply Chain System
3.2.5 Econometric Model
In the review of related literature, several analytical models are enumerated in the study of the complex adaptive system. Each transaction with its various supply chain complexities develops through time, interplaying with the characteristics of the buyer-supplier relationships. Subject to a particular
environment outside the company’s control, measuring the dynamics influence on the emergent system outcomes requires sophisticated analytical methods. The model in this paper involves several variables running in different periods of time wherein the dynamics is appropriately assessed using two
econometric models. Specifically, a fixed-effects panel data analysis is first conducted to analyze the longitudinal data, followed by the SUR analysis.
A fixed-effects panel regression includes the application of group specific constants that allow the analysis of causality requiring weak assumptions (Brüderl & Ludwig, 2014). Using this method, the data
are arranged in panels based on the unit of analysis (buyer-product). Each of the panel data attributes are grouped specific constant nested repeatedly over the three-year time period of the study. For this
capstone, fixed-effects panel data analysis was conducted to explore the relationship of order delays and sales amount between supply chain complexities and buyer-supplier relationship attributes. The
regression run was conducted using R programming software, once the panel data has been set-up and the initial data preparation and diagnostics has been conducted as described in the following section 3.2.4. Following the panel data analysis, seemingly unrelated regression (SUR) analysis was conducted to explore any existence of correlations among dependent variables in different time frames.
Based on the results of the fixed effects panel regression, the SUR analysis was conducted. Through SUR analysis, mutually adaptive attributes of independent variables will be explored under the modelling of “cyclical” linkage between them through multiple time periods simultaneously. The
combination of 2 analyses will show clear pictures on the complex and adaptive attributes of variables within the agent system of CAS. First, the independent variables that turned up to be significant (p < 0.05) in panel data analysis were selected. Then, equations were created to quantify the correlations between dependent variables in different time frame from year 1 to year 3. Selected independent variables were
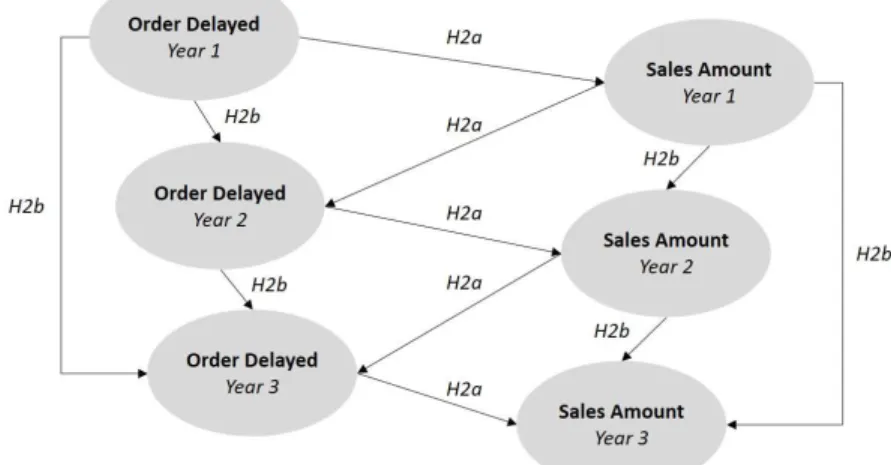
included as control variables. Resulting equations were created and applied in SUR analysis. The conceptual framework is shown in Figure 5.
3.3 Post-Hoc Investigation
The post-hoc investigation is the additional exploratory analysis conducted to assess the impact of interpreted and enacted environment of the complex adaptive system. The data from the computing company spans a three-year period and is subject to several external factors such as the uncertainties
outside its control. These factors are part of the behavior of the complex adaptive supply chain system that changes through time. As such, additional analysis will be conducted to test how the supply chain performance will react to interpreted and enacted environment factors of the complex adaptive supply chain system. This is extremely important to understand at the onset especially in fast-evolving digital
supply chains such as in computing industry.
The post-hoc investigation includes three main operations namely moderation analysis, sensitivity analysis and discussion of managerial implications. Moderation analyses are conducted to determine how
external buyer attributes intervene in the impact of supply chain complexities and buyer-supplier relationships to the supply chain performance. Each of the external attributes and its interaction effects with significant independent variables will be analyzed using the panel data regression as the base model. Next, a sensitivity analysis is conducted to determine the impact of the uncertainties to the supply chain
performance. The impact of the uncertainties, namely data center expansion, surge of demand, high service level, and rapid innovation in technology, are translated in the model as varying the number of delivery destinations, volume, order frequency, and source of supply variables. Afterwards, significant findings from the different analyses namely panel data regression, seemingly unrelated regression,
moderation analysis, and sensitivity analysis are evaluated in real world operations to establish the managerial implications of this research paper.
4 Results and Analysis
In the previous section, the methodology, research setting, and initial company data was described for this research. In this chapter, the complex adaptive system framework is analyzed using econometric model analysis to address the hypotheses H1 and H2. Then a post-hoc investigation was
conducted to address hypotheses H3 and H4.
4.1 Econometric Modelling
For the Complex Adaptive System (CAS) conceptual model for computing supply chain, the econometric model was used to assess the impact of the agent entity to the emergent system outcome. The following hypotheses were tested: (H1a) high supply chain complexities lead to lower service level and lower sales; (H1b) high values of buyer-supplier relationship attributes lead to higher service level and
higher sales; (H2a) Service level influence the sales in the same time period, which will subsequently influence service level in the following time period; and (H2b) service level and sales will be more strongly associated with their immediately preceding levels than their initial levels over time. The specific
econometric models used test these hypotheses are panel data regression analysis and seemingly unrelated regression (SUR) analysis.
In this econometric model, the supply chain performance was assessed based on order delays and sales amount. In the panel data run conducted, each panel was indexed to the buyer and product variables
to define the buyer-supplier relationship. Results of the panel data run were then funneled into a SUR model to investigate the interactions between dependent variables.
4.1.1 Fixed effects Panel Data Analysis
Fixed effects panel data analysis, unlike ordinary least squares regression, captures the time-series effect of a longitudinal data, considering different correlations in respective time frame. Similar to other regression models, a correlation analysis was conducted. The Pearson correlation matrix in Table 5
was conducted to check possible instances of multi-collinearity for the independent variables. All correlations greater than 0.5 threshold were considered to have strong correlation. As shown in Table 5, manufacturing time had strong correlation with delivery time and order frequency also had strong correlation with volume.
Table 5: Pearson Correlation Matrix for all Independent Variables
Independent Variables No. 1 2 3 4 5 6 7 8 9 10 11
Design Time 1 1.00 Manufacturing Time 2 0.01 1.00 Delivery Time 3 -0.01 -0.64 1.00 Source of Supply 4 -0.30 0.03 0.00 1.00 Distribution Channels (DC) 5 -0.04 -0.08 0.07 -0.04 1.00 Destination 6 0.04 0.03 -0.04 -0.06 -0.12 1.00 Business Segment 7 0.01 -0.03 0.03 -0.01 -0.01 -0.01 1.00 Unit Price 8 -0.01 -0.09 0.00 0.01 0.07 -0.01 -0.02 1.00 Order Frequency 9 -0.12 0.02 -0.40 -0.09 -0.04 0.01 -0.02 0.04 1.00
Service Level Agreement (SLA) 10 0.05 -0.03 0.01 0.02 -0.17 -0.02 -0.03 -0.05 -0.14 1.00
Shipped to Customers (STC) 11 0.11 0.00 -0.03 -0.02 0.10 -0.13 0.00 -0.02 -0.26 -0.02 1.00
Volume 12 -0.02 0.11 -0.25 0.00 0.00 0.02 -0.02 0.06 -0.52 0.06 -0.04
The highly correlated variables were combined as one independent variable to avoid multicollinearity. Manufacturing time was combined with delivery time while order frequency was
combined with volume.
A fixed-effects panel data analysis was conducted to explore the relationship of order delays and sales amount between supply chain complexities and buyer-supplier relationship attributes. The unit of analysis was the buyer-product interaction. In every transaction, supplier transacts with the buyers on the
specific product across time. Each variable defining the buyer-supplier relationship attributes were assessed together with the different supply chain complexities in a three-year period. Impact on supply
chain performance dependent variables (DV) were outlined in Table 5 for the order delay and in Table 6 for the sales amount. Further, a multicollinearity test was conducted after the highly correlated
independent variables were combined. The resulting variance inflation factor (VIF) signals that the independent variables have low correlation.
Table 6: Results of Fixed-Effects Panel Data Models (DV = Order Delay)
Category Variable Coefficients VIF
Supply Chain Complexities
Product SKU (per Buyer) Index
Process Design Time 0.11 ** 1.18
Manufacturing & Delivery Time 0.84 ** 1.41 Network Supply Source 0.08 ** 1.18 Distribution Channel -0.03 ** 1.06 Destination 0.01 1.04 Buyer-Supplier Relationship Attributes SLA -0.21 ** 1.09
Volume & Order Frequency 0.08 ** 1.04
Unit Price -0.02 1.03 Business segment -0.02 ** 1.006 Shipped to Customers -0.06 ** 1.34 Adj R2 0.37 Model Significance P < 0.001 *p < 0.05; **p < 0.01
As shown in Table 6, design, manufacturing-delivery time, supply source, distribution channel, destination, SLA, volume-order frequency, business segment, and shipped to customers significantly
impact the days of order delays. With the exception of distribution channels, all significant variables under supply chain complexities have positive coefficients. This means that on the average, as supply chain complexities are reduced, the order delays also decrease. However, this finding is the opposite for the number of distribution channels. Distribution channel has a negative coefficient which indicates that the
average days of order delays are reduced when more distribution channels are used.
The effect of independent variables belonging to the buyer-supplier attributes also present interesting results. What stood out as significant are the number of SLA classes, volume-order frequency,
number of business segments, and number of shipped to customers. Business segment and subsidiaries have negative coefficients, indicating that higher values from these variables reduce order delays.
Oppositely, as the SLA and volume-order frequency decreases order delays are reduced.
Table 7: Results of Fixed-Effects Model (DV = Sales)
Category Variable Coefficients VIF
Supply Chain Complexities
Product SKU (per Buyer) Index
Process Design Time 0.11 ** 1.18
Manufacturing & Delivery Time 0.71 ** 1.41 Network Supply Source -0.01 1.18 Distribution Channel 0.01 * 1.06 Destination -0.01 1.04 Buyer-Supplier Relationship Attributes SLA 0.03 ** 1.09
Volume & Order Frequency -0.01 * 1.04
Unit Price 0.01 1.03 Business segment -0.01 * 1.01 Shipped to Customers 0.18 ** 1.34 Adj R2 0.579 Model Significance P < 0.001 *p < 0.05; **p < 0.01
Results in Table 7 show that the impact of the supply chain complexities and buyer-supplier relationships on sales is different from the order delays but they also have some similarities. With the exception of the volume-order frequency and business segment, all significant variables under supply
chain complexities and buyer-supplier attributes have positive coefficients. It is surprising to note that unit price did not present as a significant variable that affects sales. Another interesting result is how the impact of number of distribution channels on sales differs on order delays. On the average, reducing volume-order frequency and business segment would increase sales amount.
Taking this all together several findings stood out. Increasing design time, manufacturing-delivery time, and SLA leads to higher sales but also more order delays. Increasing distribution channel and shipped to customers leads to improvement of both sales amount and order delays. Increasing business segments
would reduce sales but it leads to lower order delays. Lastly, a higher volume-order frequency does not improve both sales and order delays.
4.1.2 Seemingly Unrelated Regression
SUR analysis was conducted to explore any existence of mutual correlations among independent
in different time frame, which would eventually address hypotheses (H2a and H2b). First, two dependent variables were selected as target variables to be tested and measured under SUR analysis. Rational for this decision was that, due to structural limit of panel data analysis, correlation between performance index, which are independent variables were not measured. In real business environment, it is common
that certain performance outcome impact other outcome due to interdependency within the organization. Second, in order to prevent bias in the analysis, 8 dependent variables with high significance in panel data analysis for order delay and 7 variables for sales amount were applied as control variables of SUR analysis.
Considering the time lag among independent variables in terms of outcome presence, “spiral” concept was applied for analytical framework. To elaborate, high service performance in a time period will lead to higher sales amount in the same time period, and vice versa (H2a). Moreover, higher sales amount in previous year motivates the company to further improve on their service level in the following
year, which would also lead to higher sales (H2b). In the next step, equations were created to quantify the correlations between selected independent and dependent variables in different time frame from year 1 to year 3. 6 equations were created and applied in accordance with the conceptual framework.
As shown in Table 8, the hypothesis H2a is supported by SUR analysis. In Eq (2), order delayed period in year 1 has negative correlation with sales amount in year1. This can be interpreted that lower order delayed period, meaning higher service level, leads to higher sale amount. Similar correlations are shown in Eq (4) and Eq (6), as order delayed period in year 2 and 3 show negative correlations with sales
and manufacturing and delivery time in year 1 has relatively high variance inflation factor (VIF), which is a sign of multicollinearity. However, it is negligible as multicollinearity between two variables is logical as
they are closely related in terms of lead-time.
For hypothesis H2b, it is only supported by the results of order delay variables. In Eq (3), order delayed in year 1 is highly correlated with order delayed in year2, which can be interpreted that order delays in a time period has collateral impact on that of following time period. However, as shown in Eq
(5), immediate outcome has higher correlation than the initial or the outcome in the past. In Eq (5), order delayed in year 2 (0.06) has higher impact on order delayed in year 3 than that of year 1 (0.004). The sign of correlation would usually be positive as higher order delayed in year 1 may cause order backlogs,
causing higher burden in the next year. However, sales amounts in year 1 did not show significance with year 2 or 3. This would be due to the fact that sales amount is outcome derived from interactions with various factors which prevent them from being directly affected by each other.
Table 8: Results of Seemingly Unrelated Regression Analysis
Standardized estimate (VIF)
Eq. (1) DV: Eq. (2) DV: Eq. (3) DV: Eq. (4) DV: Eq. (5) DV: Eq. (6) DV:
OD1 SA1 OD2 SA2 OD3 SA3
Independent Variables OD1 - -0.15** (12.7) 0.04** (2.7) - 0.004** (1.2) - SA1 - - -0.12** (2.9) 0.01 (1.5) - -0.002 (1.5) OD2 - - - -0.74** (3.8) 0.06** (1.7) - SA2 - - - - -0.01** (1.8) 0.05** (1.7) OD3 - - - -0.47** (2) SA3 - - - -
Control Variables Year1 Year1 Year2 Year2 Year3 Year3
Design Time 0.19** (1.3) 0.15** (1.3) 0.11** (1.2) 0.18** (1.5) 0.13** (1.3) 0.17** (1.4) Manufacturing & Delivery Time 1.23** (1.5) 0.8** (12.3) 0.44** (1.8) 1.09** (4.7) 0.17** (1.6) 0.96** (2)
Supply Source -0.001 (1.2) 0.01** (1.2) 0.003 (1.2)
Distribution Channel -0.06** (1) 0.03** (1.1) -0.03** (1.1) -0.03** (1.1) -0.001 (1.1) -0.02** (1.1)
SLA -0.01 (1) -0.02 (1) -0.06** (1.1) -0.03** (1.2) 0.003* (1.2) 0.004 (1.2)
Volume per Order
(Volume & Order Frequency) 0.002 (1.1) 0.01 (1.1) -0.01* (1) 0.03** (1) -0.003* (1) -0.00001 (1)
Business segment 0.01** (1) 0.003 (1) -0.01** (1) -0.02** (1) 0.002 (1) 0.01** (1) Shipped to Customers 0.004 (1.3) 0.24** (1.3) -0.005 (1.3) 0.16** (1.3) 0.03** (1.3) 0.11** (1.3) Individual equation R2 0.92 0.74 0.74 0.82 0.52 0.76 System weighted R2 0.84 *p < 0.05; **p < 0.01
4.2 Moderation analysis
External information on the buyers namely company size, company revenue, and years in the industry were used as moderators to describe how external factors affect the supply chain system. Specifically, moderation analysis for the panel data regression were conducted to determine how external
buyer attributes affects the relationship of supply chain complexities and buyer-supplier relationships on supply chain performance. Each of these moderators are grouped into a low, medium, and high setting based on its standard deviation. Since external data involves the attributes of the buyer, the unit of analysis used is the buyer. Further, only the independent variables that were significant in the panel data
regression were included. A collinearity test was also conducted where no VIFs greater than a 10 threshold were noted both for the base model and test models. Specifically, moderation analysis was conducted to test two hypotheses H3a and H3b.
Table 9: Moderation Analysis for Order Delays
Variables Base Company Size Company Revenues Years in the Industry
L M H L M H L M H
Design Time 0.12** 0.11 0.07 0.03 0.42* 0.26** -0.08 -0.90** 1.98** 4.87** Manufacturing and Delivery
Time 1.39** 0.86** 0.91** 0.96** 1.68** 1.53** 0.61** 0.68 1.58** 2.48** Supply Source 0.08* 0.06 0.11* 0.15* 0.40* 0.22** 0.02 0.10 -0.01 -0.12 Distribution Center 0.09** 0.66** 0.26** -0.14 -0.26 0.23* 0.31 0.05 0.07 0.07 SLA -0.15** -0.10 -0.12** -0.15* -0.42** -0.23** 0.003 -0.18 -0.123 -0.06 Volume per Order
(Volume & Order Frequency) -0.13** -0.05 -0.21 0.12 -0.04 -0.044 -0.024 -0.11 -0.003 -0.22 Business segment -0.17** -0.17** -0.19** -0.22** 0.004 -0.15** -0.33** -0.04 -0.043 -0.05 Shipped to Customers 0.15* 1.07** 1.38** 1.68** -0.15 0.38** 0.97** 1.66** -0.39* -2.45**
Adj R2 0.46** 0.57** 0.54** 0.54** 0.56** 0.54** 0.54** 0.55** 0.54** 0.57**
Table 9 shows the moderation analysis for the relationship of supply chain complexities and buyer-supplier attributes with order delay. Results show that company size moderates the relationship of
order delays with supply chain complexities and buyer-supplier relationship attributes. This is evident in the changes of significance level in manufacturing and delivery time, distribution channel, and shipped to customers across different settings. It is also interesting to note that with company size as a moderating variable, the coefficients of shipped to customers are amplified as compared to its base model. Low to
high settings of company revenues leads to changing magnitudes and significance from the base value of all variables in table. As such, company revenues moderate between the relationship of order delays with supply chain complexities and buyer-supplier attributes. Higher revenues tend to diminish the impact of design time, manufacturing-delivery time, and SLA on order delay. Meanwhile, it amplifies the impact of
business segment and shipped to customers. For years in the industry, it has moderating effects evident on design time and shipped to customers impact to order delays. Similarly, the years in the industry can be seen to have moderating effects on the relationship of order delays with supply chain complexities and
buyer-supplier relationship attributes.
Table 10: Moderation Analysis for Sales Amount
Variables Base Company Size Revenues Years in the Industry
L M H L M H L M H
Design Time 0.07** 0.20 0.10** 0.004 0.17** 0.08** 0.02 -0.26** 0.37** 0.98** Manufacturing and Delivery
Time 0.83** 0.88** 0.80** 0.72** 0.90** 0.83** 0.87** 1.18** 0.90** 0.71** Distribution Center 0.02* 0.01 -0.01 -0.03 -0.15* -0.04* 0.04 -0.003 -0.02 -0.02
SLA 0.001 0.005 0.001 -0.003 0.001 0.001 -0.009 0.03 0.02 0.02 Volume per Order
(Volume & Order Frequency) -0.09** -0.10** -0.23** 0.03 -0.10** -0.13** -0.07** -0.11** -0.18** -0.17**
Business segment 0.0002 0.03* 0.02* 0.01 0.03* 0.02* 0.009 0.02 0.03* 0.03* Shipped to Customers 0.04* 0.08* 0.07* 0.06 0.02 0.04 0.14* -0.32** 0.30** 0.83**
Adj R2 0.78** 0.79** 0.79** 0.79** 0.79** 0.79** 0.79** 0.79** 0.78** 0.79**
Table 10 shows the moderation analysis between the relationship of sales amount with supply chain complexities and buyer-supplier attributes. Results show coefficient and significance level changes
in design time, manufacturing-delivery time, volume-order frequency, business segment and shipped to customers. As such, company size can be seen to moderate the impact of the independent variables with sales amount. Almost similar changes in significance and coefficients can be seen with company revenues which signals that it also has some moderating effects. In different settings of years of industry, varying
coefficients can be seen more obviously on the design time, manufacturing-delivery time, volume-order frequency, and shipped to customers. Thus, years in the industry also have moderating effects.
In general, external attributes of the buyers namely company size, revenue, and years in the
industry moderate the impact of supply chain complexity and buyer-supplier relationship on the service level. Similarly, external attributes of the buyers moderate the impact of supply chain complexity and buyer-supplier relationship on the sales amount. Both findings support hypotheses H3a and H3b.
4.3 Sensitivity analysis for external environment and emergent system properties
For this study, sensitivity analysis was conducted to measure the external environment impact on the supply chain as a complex adaptive system. The dependent variables of the data already are the result
of the external environment impact, and it is impossible to reverse them and applying different level of external impact on them. However, by applying different values in independent variables and reviewing the difference in coefficient values of panel data analysis, the study can reveal the hidden dynamics within
the data.
Among possible options for sensitivity analysis, one-factor-at-a-time (OFAT) method was chosen for its simplicity, data efficiency, yet intuitive features. OFAT analysis is conducted by applying changes in only one independent variable at a time while having other variables unchanged (Czitrom, 1999). This
dynamics. The changes are made under 4 different scenarios: 1) rapid data center expansion of buyers (more delivery destinations) (H4a); 2) rapid surge in end-user demand (higher order volume) (H4b); 3)
higher service level requested by buyers (e.g. – on-demand delivery) (higher order frequency) (H4c); and 4) rapid technological innovation of buyers (e.g. – demand for more sophisticated products, requiring more diverse source of supply) (increase in source of supply) (H4d). The increases in variable values were made on each year to explore the different data trend in different time frame, taking full advantage of
panel data analysis. The amount of increase was controlled at the scale of 10% to minimize the collateral effects on regression while still having considerable level of changes in coefficients. Exception was made for the transaction amount analysis as the result coefficients were not very reactive. The increase for variables in this analysis was allowed up to 50%.
The results of coefficients for order delayed as shown in Table 11 exhibit the difference in changes occurred among time frames. Scenario 1 assumes buyers expand their data center presence in other locations. This assumption would lead to more destination and, for this analysis, amount of increase will
be 10%. The number was selected randomly, however, 10% increase is reasonable in terms of not being extreme while high enough to observe changes in correlations. The results show that the coefficients of destination variable with order delayed as dependent variable become significant when 10% increase is applied in year 2 and 3. These changes can be interpreted that changes in number of destinations is
relatively more sensitive in year 2 and 3 in terms of order delayed period. However, sales amount does not show any sign of sensitivity regarding changes in number of destinations. Therefore, the results only partially support hypothesis H4a.