HAL Id: hal-00002232
https://hal.archives-ouvertes.fr/hal-00002232v2
Preprint submitted on 21 Jul 2004
HAL is a multi-disciplinary open access
archive for the deposit and dissemination of
sci-entific research documents, whether they are
pub-lished or not. The documents may come from
teaching and research institutions in France or
abroad, or from public or private research centers.
L’archive ouverte pluridisciplinaire HAL, est
destinée au dépôt et à la diffusion de documents
scientifiques de niveau recherche, publiés ou non,
émanant des établissements d’enseignement et de
recherche français ou étrangers, des laboratoires
publics ou privés.
Improved Test of Lorentz Invariance in Electrodynamics
Peter Wolf, Michael Tobar, Sébastien Bize, André Clairon, André Luiten,
Giorgio Santarelli
To cite this version:
Peter Wolf, Michael Tobar, Sébastien Bize, André Clairon, André Luiten, et al.. Improved Test of
Lorentz Invariance in Electrodynamics. 2004. �hal-00002232v2�
ccsd-00002232, version 2 - 21 Jul 2004
Peter Wolf,∗ S´ebastien Bize, Andr´e Clairon, and Giorgio Santarelli
BNM-SYRTE, Observatoire de Paris, 61 Av. de l’Observatoire, 75014 Paris, France
Michael E. Tobar and Andr´e N. Luiten
University of Western Australia, School of Physics, Nedlands 6907 WA, Australia (Dated: July 21, 2004)
We report new results of a test of Lorentz invariance based on the comparison of a cryogenic sap-phire microwave resonator and a hydrogen maser. The experimental results are shown together with an extensive analysis of systematic effects. Previously, this experiment has set the most stringent constraint on Kennedy-Thorndike type violations of Lorentz invariance. In this work we present new data and interpret our results in the general Lorentz violating extension of the standard model of particle physics (SME). Within the photon sector of the SME, our experiment is sensitive to seven SME parameters. We marginally improve present limits on four of these, and by a factor 7 to 10 on the other three.
PACS numbers: 03.30.+p, 06.30.Ft, 12.60.-i, 11.30.Cp, 84.40.-x
Lorentz Invariance (LI) is the fundamental postulate of Special Relativity and therefore at the heart of all ac-cepted theories of physics. The central importance of this postulate in modern physics has motivated tremen-dous work to experimentally test LI with ever increasing precision. Additionally, many unification theories (e.g. string theory or loop gravity) are expected to violate LI at some level [1, 2, 3], which further motivates experi-mental searches for such violations.
Numerous test theories that allow the modeling and interpretation of experiments that test LI have been de-veloped [4, 5, 6, 7, 8, 9]. The kinematical frameworks (RMS) of [4, 5] postulate a simple parametrisation of the Lorentz transformations with experiments setting limits on the deviation of those parameters from their special relativistic values. Owing to their simplicity they have been widely used to model and interpret many experi-ments that test LI, including our previous publications [10, 11]. More recently, a general Lorentz violating ex-tension of the standard model of particle physics (SME) has been developed [8] whose Lagrangian includes all parametrised Lorentz violating terms that can be formed from known fields. Over the last years considerable ex-perimental effort has gone into SME tests [12, 13, 14], and the present paper reports our first results in the SME.
In the photon sector of the SME [9], Lorentz violat-ing terms are parametrised by 19 independent compo-nents of a tensor (kF)κλµν (greek indices run from 0 to
3), which are in general grouped into three traceless and symmetric 3 × 3 matrices (˜κe+, ˜κo−, and ˜κe−), one
an-tisymmetric one (˜κo+) and one additional scalar, which
all vanish when LI is satisfied. The 10 independent com-ponents of ˜κe+and ˜κo−are constrained by astronomical
measurements to < 2 × 10⁻³². Seven components of ˜κe−
and ˜κo+ have been constrained in an optical cavity
ex-periment [14] at the 10−15 and 10−11 level respectively,
while the remaining two prameters are unconstrained for
the time being. Our experiment is sensitive to the same seven components of ˜κe− and ˜κo+ as [14]. It marginally
improves present limits on four of these, with significant (factor 7 to 10) improvement on the other three.
As already described in [10, 11], our experiment con-sists of a cryogenic sapphire oscillator (CSO) operating in a whispering gallery mode with a resonance frequency of 11.932 GHz which is compared to a commercial (Da-tum Inc.) active hydrogen maser. A detailed description can be found in [17, 18, 19] with specific details in the context of LI tests in [11].
A standing wave is set up around the circumference of the cylindrical sapphire resonator with the dominant electric and magnetic fields in the radial and vertical di-rections, corresponding to a propagation (Poynting) vec-tor around the circumference. In the photon secvec-tor of the SME the resonant frequency of an electro-magnetic cav-ity is subject to a Lorentz violating perturbation which can be expressed, to first order, as an integral over the non-perturbed e-m fields (equ. (34) of [9]). The change of orientation of the fields due to the rotation and orbital motion of the Earth then provides a time varying modu-lation of that perturbed frequency, which is searched for in the experiment. As shown in [15] the frequency of the H-maser is not affected to first order (because it operates on mF = 0 states) and [16] shows that the perturbation
of the frequency due to the modification of the sapphire crystal structure (and hence the cavity size) is negligible with respect to the direct perturbation of the e-m fields. With the above assumptions the perturbed frequency difference ν between the CSO and the H-maser can be expressed in the form (see [11] for a detailed derivation)
ν − ν0
ν0 =
X
i
Cicos(ωiT⊕+ ϕi) + Sisin(ωiT⊕+ ϕi) (1)
where ν0 is the unperturbed frequency difference, the
coef-2
ficients Ci and Si are functions of the Lorentz
violat-ing tensors ˜κe− and ˜κo+ (see Tab.I), T⊕ = 0 on
De-cember 17, 2001, 18:05:16 UTC, ϕω⊕ = ϕ2ω⊕ = 0 and
ϕ(ω⊕±Ω⊕)= ϕ(2ω⊕±Ω⊕)= ±4.682 rad.
Our previously published results [10, 11] are based on data sets taken between Nov. 2001 and Sep. 2003. All of the data in [10] (except the last data set) were taken before implementation of permanent temperature control of the local environment. As a result the uncertainties in [10] were dominated by the systematic effects from temperature variations. In [11] we have used only data that were permanently temperature controlled yielding an improvement on [10] by about a factor 2 for the RMS parameters of [4, 5]. However, those data were insuffi-cient to decorrelate all 7 SME parameters.
In order to do so we have extended the data to 20 data sets in total, spanning Sept. 2002 to Jan. 2004, of differing lengths (5 to 20 days, 222 days in total). The sampling time for all data sets was 100 s. Fig. 1. shows the complete data and the power spectral density (PSD) of the longest data set after removal of an offset and a rate (natural frequency drift, typically ≈ 1.6×10⁻¹⁸s−1)
for each data set.
For the statistical analysis we first average the data to 2500 s sampling time and then simultaneously fit the 20 rates and offsets and the 12 parameters Ci and Si
of (1) to the complete data using two statistical meth-ods, weighted least squares (WLS), which allows one to account for non-white noise processes (cf. [10]), and in-dividual periods (IP) as used in [14]. The two methods give similar results for the parameters (within the un-certainties) but differ in the estimated uncertainties (the IP uncertainties are a factor ≈ 1.2 larger). Because IP discards a significant amount of data (about 10% in our case) we consider WLS the more realistic method and retain those results as the statistical uncertainties shown in Tab. I. We note that we now have sufficient data to decorrelate all 12 parameters (Ci, Si) i.e. the WLS
correlation coefficients between any two parameters or between any parameter and the fitted offsets and rates are all less than 0.20.
To investigate the distributions of our results we fit the coefficients Ciand Si to each one of the 20 data sets
individually with the results at the sidereal and semi-sidereal frequencies ω⊕ and 2ω⊕ shown in Fig. 2. If a
genuine effect at those frequencies was present we would expect correlated phases of the individual points in Fig. 2., but this does not seem to be supported by the data. A distribution of the phases may result from an effect at a neighbouring frequency, in particular the diurnal and semi-diurnal frequencies ω⊕− Ω⊕ and 2(ω⊕− Ω⊕)
at which we would expect systematic effects to play an important role. Fig. 3. shows the amplitudes Aω =
pC2
ω+ Sω2 resulting from least squares fits for a range
of frequencies, ω, around the frequencies of interest. We note that the fitted amplitudes at ω⊕− Ω⊕ and 2(ω⊕−
Ω⊕) are substantially smaller than those at ω⊕and 2ω⊕
and therefore unlikely to contribute to the distribution of the points in Fig. 2.
Systematic effects at the frequencies ωi could mask a
putative Lorentz violating signal in our experiment and need to be investigated in order to be able to confirm such a signal or to exclude it within realistic limits. We have extensively studied all systematic effects arising from en-vironmental factors that might affect our experiment. The resulting estimated contributions at the two cen-tral frequencies ω⊕, 2ω⊕ and at the diurnal frequency
ω⊕− Ω⊕ are summarised in Tab.II. The contributions
at ω⊕+ Ω⊕ and 2ω⊕± Ω⊕ are not shown as they are
identical to those at ω⊕ and 2ω⊕ respectively.
We have compared the Hydrogen-maser (HM) used as our frequency reference to our highly stable and ac-curate Cs fountain clocks (FO2 and FOM). For exam-ple, the amplitudes at ω⊕ and 2ω⊕ of the HM-FOM
relative frequency difference over June-July 2003 were Aω⊕ = (4.8±4.7)×10
−16and A
2ω⊕ = (4.3±4.7)×10
−16.
This indicates that any environmental effects on the HM at those frequencies should be below 5 parts in 1016 in
amplitude. This is in good agreement with studies on similar HMs carried out in [20] that limited environmen-tal effects to < 3 to 4 parts in 1016.
To estimate the tilt sensitivity we have intention-ally tilted the oscillator by ≈ 5 mrad off its average position which led to relative frequency variations of ≈ 3 × 10⁻¹³ from which we deduce a tilt sensitivity of ≈ 6 × 10⁻¹⁷µrad−1. This is in good agreement with
sim-ilar measurements in [19] that obtained sensitivities of ≈ 4×10⁻¹⁷µrad−1. Measured tilt variations in the lab at
diurnal and semi-diurnal periods show amplitudes of 4.6 µrad and 1.6 µrad respectively which leads to frequency variations that do not exceed 3 × 10⁻¹⁶ and 1 × 10⁻¹⁶
respectively.
From the measurements of tilt sensitivity one can de-duce the sensitivity to gravity variations (cf. [19]), which in our case lead to a sensitivity of ≈ 3 × 10⁻¹⁰g−1. Tidal
gravity variations can reach ≈ 10−7g from which we
ob-tain a maximum effect of 3 × 10⁻¹⁷, one order of
magni-tude below the effect from tilt variations.
Variations of the ambient magnetic field in our lab. are dominated by the passage of the Paris Metro, showing a strong periodicity (”quiet” periods from 1 am to 5 am). The corresponding diurnal and semi-diurnal amplitudes are 1.7 × 10⁻⁴ G and 3.4 × 10⁻⁴ G respectively for the
vertical field component and about 10 times less for the horizontal one. To determine the magnetic sensitivity of the CSO we have applied a sinusoidal vertical field of 0.1 G amplitude with a 200 s period. Comparing the CSO frequency to the FO2 Cs-fountain we see a clear sinusoidal signal (S/N > 2) at the same period with an amplitude of 7.2 × 10⁻¹⁶, which leads to a sensitivity of
≈ 7 × 10⁻¹⁵G−1. Assuming a linear dependence (there
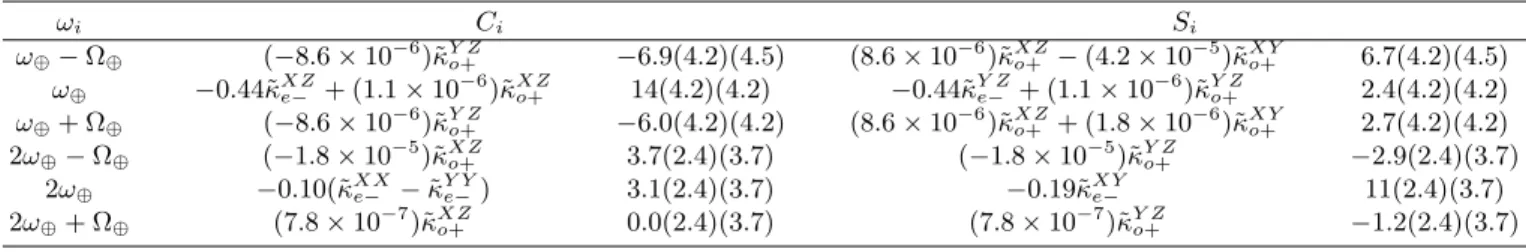
TABLE I: Coefficients Ci and Siin (1) for the six frequencies ωiof interest and their relation to the components of the SME parameters ˜κe− and ˜κo+, with ω⊕ and Ω⊕ the angular frequencies of the Earth’s sidereal rotation and orbital motion. The measured values (in 10−16
) are shown together with the statistical (first bracket) and systematic (second bracket) uncertainties.
ωi Ci Si ω⊕− Ω⊕ (−8.6 × 10⁻⁶ )˜κY Z o+ −6.9(4.2)(4.5) (8.6 × 10 −6 )˜κX Z o+ − (4.2 × 10 −5 )˜κX Y o+ 6.7(4.2)(4.5) ω⊕ −0.44˜κX Ze− + (1.1 × 10 −6)˜κX Z o+ 14(4.2)(4.2) −0.44˜κ Y Z e− + (1.1 × 10 −6)˜κY Z o+ 2.4(4.2)(4.2) ω⊕+ Ω⊕ (−8.6 × 10⁻⁶ )˜κY Z o+ −6.0(4.2)(4.2) (8.6 × 10 −6 )˜κX Z o+ + (1.8 × 10 −6 )˜κX Y o+ 2.7(4.2)(4.2) 2ω⊕− Ω⊕ (−1.8 × 10⁻⁵)˜κ X Z o+ 3.7(2.4)(3.7) (−1.8 × 10 −5)˜κY Z o+ −2.9(2.4)(3.7) 2ω⊕ −0.10(˜κ X X e− − ˜κ Y Y e−) 3.1(2.4)(3.7) −0.19˜κ X Y e− 11(2.4)(3.7) 2ω⊕+ Ω⊕ (7.8 × 10⁻⁷)˜κ X Z o+ 0.0(2.4)(3.7) (7.8 × 10 −7 )˜κY Z o+ −1.2(2.4)(3.7)
TABLE II: Contributions from systematic effects to the am-plitudes Ai(parts in 1016) at three frequencies ωi.
Effect ω⊕− Ω⊕ ω⊕ 2ω⊕ H-maser <5 <5 <5 Tilt 3 3 1 Gravity 0.3 0.3 0.3 B-field <0.1 <0.1 <0.1 Temperature <1 <1 <1 Atm. Pressure 2.3 0.3 0.4 Total 6.4 5.9 5.2
effects) we obtain effects of only a few parts in 10−18.
Late 2002 we implemented an active temperature sta-bilization inside an isolated volume (≈ 15m3) that
in-cludes the CSO and all the associated electronics. The temperature is measured continously in two fixed loca-tions (behind the electronics rack and on top of the de-war). For the best data sets the measured temperature variations do not exceed 0.02/0.01 K in amplitude for the diurnal and semi-diurnal components. A least squares fit to all our temperature data (taken simultaneously with our frequency measurements) yields amplitudes of Aω⊕ = 0.020 K and A2ω⊕ = 0.018 K with similar
val-ues at the other frequencies ωi of interest, including the
diurnal one (Aω⊕−Ω⊕ = 0.022 K). Inducing a strong
si-nusoidal temperature variation (≈ 0.5 K amplitude at 12 h period) leads to no clearly visible effect on the CSO frequency. Taking the noise level around the 12 h pe-riod as the maximum effect we obtain a sensitivity of <4 × 10⁻¹⁵per K. Using this estimate we obtain effects
of < 1 × 10⁻¹⁶at all frequencies ω i.
Finally we have investigated the sensitivity of the CSO to atmospheric pressure variations. To do so we con-trol the pressure inside the dewar using a variable valve mounted on the He-gas exhaust. During normal oper-ation the valve is open and the CSO operates at ambi-ent atmospheric pressure. For the sensitivity determi-nation we have induced a sinusoidal pressure variation (≈ 14 mbar amplitude at 12 h period), which resulted in a clearly visible effect on the CSO frequency corre-sponding to a sensitivity of ≈ 6.5 × 10⁻¹⁶ mbar−1. We
have checked that the sensitivity is not significantly
af-TABLE III: Results for the components of the SME Lorentz violation parameters ˜κe− (in 10−15) and ˜κo+(in 10−11).
˜ κX Y e− κ˜ X Z e− ˜κ Y Z e− (˜κ X X e− − ˜κ Y Y e−) from [14] 1.7(2.6) -6.3(12.4) 3.6(9.0) 8.9(4.9) this work -5.7(2.3) -3.2(1.3) -0.5(1.3) -3.2(4.6) ˜ κX Yo+ κ˜X Zo+ ˜κY Zo+ from [14] 14(14) -1.2(2.6) 0.1(2.7) this work -1.8(1.5) -1.4(2.3) 2.7(2.2)
fected when changing the amplitude of the induced pres-sure variation by a factor 3. A least squares fit to atmo-spheric pressure data (taken simultaneously with our fre-quency measurements) yields amplitudes of Aω⊕= 0.045
mbar and A2ω⊕ = 0.054 mbar with similar values at the
other frequencies ωi of interest, except the diurnal one
for which Aω⊕−Ω⊕ = 0.36 mbar. The resulting effects on
the CSO frequency are given in Tab.II.
Our final results for the 7 components of ˜κe− and ˜κo+
are obtained from a least squares fit to the 12 measured coefficients of Tab.I. They are summarised and compared to the results of [14] in Tab.III.
We note that our results for ˜κXY
e− and ˜κXZe− are
signif-icant at about 2σ, while those of [14] are signifsignif-icant at about the same level for (˜κXX
e− − ˜κY Ye−). The two
exper-iments give compatible results for ˜κXZ
e− (within the 1σ
uncertainties) but not for the other two parameters, so the measured values of those are unlikely to come from a common source. Another indication for a non-genuine effect comes from Figs. 2. and 3., as we would expect any genuine effect to show an approximately coherent phase for the individual data sets in Fig. 2. and to display more prominent peaks in Fig. 3.
In conclusion, we have not seen any Lorentz violating effects in the general framework of the SME, and set lim-its on 7 parameters of the SME photon sector (cf. Tab. III) which are up to an order of magnitude more strin-gent than those obtained from previous experiments [14]. Two of the parameters are significant (at ≈ 2σ). We be-lieve that this is most likely a statistical coincidence or a neglected systematic effect. To verify this, our exper-iment is continuing and new, more precise experexper-iments
4
are under way [21].
Helpful discussions with Alan V. Kosteleck´y, and par-tial funding by the Australian Research Council are greatfully acknowledged.
Figure captions
Fig. 1: Relative frequency difference between the CSO and the H-maser after removal of a linear fit per data set. Complete data (inset) and PSD of the longest data set. Fig. 2: Fitted sine and cosine amplitudes at ω⊕and 2ω⊕
for each data set (blue squares) and the complete data (red diamonds, with statistical errors). For clarity the error bars of the individual data sets have been omitted. Fig. 3: Fitted Amplitudes Aω for a range of frequencies
around the six frequencies ωi of interest (indicated by
arrows).
∗ On leave from Bureau International des Poids et Mesures, Pavillon de Breteuil, 92312 S`evres Cedex, France. [1] Kosteleck´y V.A., Samuel S., Phys.Rev.D39, 683, (1989).
[2] Damour T., gr-qc/9711060 (1997).
[3] Gambini R., Pullin J., Phys. Rev. D59, 124021, (1999). [4] Robertson H.P., Rev. Mod. Phys. 21, 378 (1949). [5] Mansouri R., Sexl R.U., Gen. Rel. Grav. 8, 497, (1977). [6] Lightman A.P., Lee D.L., Phys. Rev. D8, 2, 364, (1973). [7] Ni W.-T., Phys. Rev. Lett. 38, 301, (1977).
[8] Colladay D., Kosteleck´y V.A., Phys.Rev.D55, 6760, (1997); Colladay D., Kosteleck´y V.A., Phys.Rev.D58, 116002, (1998); Kosteleck´y V.A., Phys.Rev.D69, 105009, (2004).
[9] Kosteleck´y V.A.,Mewes M.,Phys.Rev.D66,056005,(2002). [10] Wolf P. et al., Phys. Rev. Lett. 90, 6, 060402, (2003). [11] Wolf P., et al., Gen. Rel. and Grav., accepted, (2004).
Preprint at gr-qc/0401017.
[12] Kosteleck´y V.A. ed., CPT and Lorentz Symmetry II, World Scientific, Singapore, (2002).
[13] Lipa J.A. et al. Phys. Rev. Lett. 90, 6, 060403, (2003). [14] M¨uller H. et al., Phys. Rev. Lett. 91, 2, 020401, (2003). [15] Kosteleck´y V.A., Lane C.D., Phys.Rev.D60, 116010,
(1999).
[16] M¨uller H. et al., Phys.Rev.D67, 056006, (2003). [17] Chang S., Mann A.G., Luiten A.N., Electron. Lett. 36,
5, 480, (2000).
[18] Mann A.G., Chang S., Luiten A.N., IEEE Trans. In-strum. Meas. 50, 2, 519, (2001).
[19] Chang S., Ph.D. thesis, Univ. of West. Aus., (2000). [20] Parker T.E., IEEE Trans. UFFC, 46, 745, (1999). [21] Tobar M.E. et al., Phys. Lett. A300, 33, (2002).
5
-6.E-14
-3.E-14
0.E+00
3.E-14
0
100
200
300
400
500
∆ν
/
ν
0
t /days
6
-6.4
-3.2
0
3.2
6.4
-6.4
-3.2
0
3.2
6.4
-6.4
-3.2
0
3.2
6.4
-6.4
-3.2
0
3.2
6.4
S
ω
⊕
/10
-15
C
ω
⊕
/10
-15
S
2
ω
⊕
/10
-15
C
2
ω
⊕
/10
-15
7