HAL Id: hal-01136538
https://hal.archives-ouvertes.fr/hal-01136538
Submitted on 18 May 2020
HAL is a multi-disciplinary open access
archive for the deposit and dissemination of
sci-entific research documents, whether they are
pub-lished or not. The documents may come from
teaching and research institutions in France or
abroad, or from public or private research centers.
L’archive ouverte pluridisciplinaire HAL, est
destinée au dépôt et à la diffusion de documents
scientifiques de niveau recherche, publiés ou non,
émanant des établissements d’enseignement et de
recherche français ou étrangers, des laboratoires
publics ou privés.
Thermal effects accompanying the deformation of
natural rubber
Jose Ricardo Samaca Martinez, Jean-Benoit Le Cam, Xavier Balandraud,
Evelyne Toussaint, Julien Caillard
To cite this version:
Jose Ricardo Samaca Martinez, Jean-Benoit Le Cam, Xavier Balandraud, Evelyne Toussaint, Julien
Caillard. Thermal effects accompanying the deformation of natural rubber. European Conference on
Constitutive Models for Rubber VIII, Jun 2013, San Sebastian, Spain. �hal-01136538�
Thermal effects accompanying the deformation of natural rubber
J.R. Samaca Martinez
Clermont Université, Université Blaise Pascal, Institut Français de Mécanique Avancée, Institut Pascal, Clermont-Ferrand, France
CNRS, UMR 6602, Université Blaise Pascal, Institut Pascal, Aubière, France
Manufacture Française de Pneumatiques Michelin, CERL Ladoux, Clermont-Ferrand, France
J.-B. Le Cam
Université De Rennes 1, Larmaur ERL CNRS 6274, Campus de Beaulieu, Rennes, France
X. Balandraud & E. Toussaint
Clermont Université, Université Blaise Pascal, Institut Français de Mécanique Avancée, Institut Pascal, Clermont-Ferrand, France
CNRS, UMR 6602, Université Blaise Pascal, Institut Pascal, Aubière, France
J. Caillard
Manufacture Française de Pneumatiques Michelin, CERL Ladoux, Clermont-Ferrand, France
ABSTRACT: This paper deals with the thermal effects associated with deformation processes in unfilled natural rubber. Temperature variations are measured by infrared thermography during cyclic uniaxial mechanical tests at ambient temperature. Results show that natural rubber mainly exhibits entro-pic behaviour: the material produces (resp. absorbs) heat during loading (resp. unloading). The thermal responses obtained provide complementary information regarding the mechanical analysis of changes in the microstructure, especially strain-induced crystallization. The crystallization of the polymer chains under tension leads to a temperature increase of the order of several degrees Celsius. If crystallization occurs, a hysteresis loop is observed in terms of the strain-stress relationship. Moreover, stress relaxation tests show that the thermal signatures of crystallization and of crystallite melting are different. Indeed, if the strain is maintained fixed during loading, the temperature continues to increase for a few seconds before returning to the ambient temperature. This reveals that crystallization continues during relaxa-tion. On the contrary, if the strain is maintained fixed during unloading, the specimen seems to return instantaneously to the ambient temperature. Throughout this paper, the effect of heat exchanges with the outside of the specimen (non-adiabaticity) on the temperature variations is taken into account for the analysis.
(Toki, Fujimaki, & Okuyama 2000, Toki, Sics, Ran, Liu, Hsiao, Murakami, Senoo, & Kohjiya 2002, Trabelsi, Albouy, & Rault 2002, Huneau 2011) and energetic and entropic effects on the thermomechanical response. From an experi-mental point of view several techniques have been used to study such phenomena, X-ray dif-fraction, X-ray microtomography, dilatometry, among others. Nevertheless, no temperature vari-ation or heat production can be detected with the abovementioned techniques.
Full-field measurement techniques and espe-cially, Infrared (IR) thermography are appropri-ate techniques to detect the heat sources produced by the material itself during the deformation 1 INTRODUCTION
It is well-known that Natural Rubber (NR) has excellent mechanical properties (i.e. high elas-ticity, high damping, high elongation at failure, etc) which are widely used in many fields, such as mechanical, automotive and aerospace engineer-ing. However, this type of material is subjected to numerous physical mechanisms during the defor-mation process which are still not clearly under-stood and feed the scientific debate: Mullins effect (Mullins 1948, Chagnon, Verron, Gornet, Marckmann, & Charrier 2004), cavitation (Stringfellow & Abeyaratne 1989, Le Cam & Toussaint 2008), strain induced crystallization
ECCMRVIII.indb 505
ECCMRVIII.indb 505 5/7/2013 4:58:48 PM5/7/2013 4:58:48 PM
process from measured temperature variations. This technique has been widely applied to metals, polymers and composite materials (see for instance (Chrysochoos & Louche 2000, Chrysochoos & Louche 2001)), but rarely to elastomeric materi-als (Pottier, Moutrille, Le Cam, Balandraud, & Gre´diac 2009, Toussaint, Balandraud, Le Cam, & Grédiac 2012). In this work we are mainly inter-ested in the analysis of the temperature variations obtained by IR thermography during the deforma-tion processes of unfilled natural rubber, in order to characterize the thermal response of such crys-tallizable rubber under homogeneous cyclic uniax-ial tensile test, at ambient temperature.
In Section 2 we present the experimental setup, i.e. the material, the specimen geometry, the load-ing conditions and the measurement device.
In Section 3 we give the results obtained for cyclic and relaxation tests by associating mechani-cal and thermal responses.
Finally, a conclusion recalls the main results of the paper and presents the perspectives.
2 EXPERIMENTS
2.1 Material and specimen geometry
The material considered here is an unfilled natural rubber NR (supplied by Michelin Co). Its material formulation is given in Table 1. This material was chosen in order to analyze the thermal response of the macromolecular network without interac-tion between the rubber matrix and the fillers. Though, this kind of materials is subject to Strain-Induced Crystallization (SIC in the following) and it is relevant to identify the thermal response of such phenomenon.
In NR, the crystallization of the polymer chains is observed in uniaxial tension starting from a stretch ratio, defined as the ratio between cur-rent length and the initial length, of about λ = 4. During unloading, crystallite melting should be complete at a lower stretch ratio, typically equal
to about λ = 3 (Toki, Fujimaki, & Okuyama 2000, Trabelsi, Albouy, & Rault 2003, Le Cam & Toussaint 2008). In the following, these stretch ratios at which crystallization begins and at which crystallite melting is complete are denoted λc and
λm, respectively.
The sample geometry is presented in Figure 1. It is a typical dumbbell form sample, with a 5 mm width, 10 mm height and 1.4 mm thickness. Its width was chosen to ensure that the strain and stress fields are as homogeneous as possible, thus corresponding to a uniaxial tension test state. 2.2 Loading conditions
Mechanical loadings were applied using a 50N INSTRON 5543 testing machine. Two types of tests were carried out under imposed displacement at a constant loading rate ± 300 mm/min:
1. the first test corresponds to four sets of three cycles, for four increasing maximum stretch ratios: λ1= 2, λ2= 5, λ3= 6 and λ4= 7.5 (see
Fig. 2(a)). λ1 was chosen inferior to λc, λ2
was close to λc and λ3 and λ4 are superior to
λc (λ4 is close to the failure stretch ratio). The
signal shape was chosen triangular, to ensure a constant strain rate during loading and unloading.
2. the second test consists of applying only one mechanical cycle, including pauses of 30 s at the stretch ratios used for the first type of test, i.e. λi
for i = 1 … 4, during both loading and unload-ing (see Fig. 2(b)).
2.3 Temperature field measurements
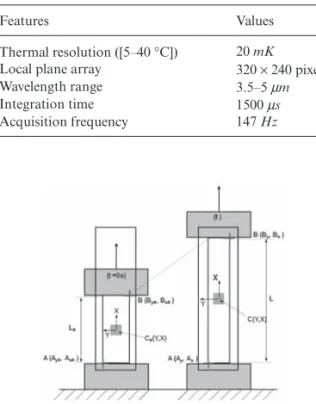
Temperature measurements were performed using a Cedip Jade III-MWIR infrared camera. The principal features of this camera are presented in Table 2.
The calibration of the camera detectors was performed using a black body and using a Non-Uniformity Correction (NUC) procedure. In order to ensure that the internal temperature of the camera Table 1. Chemical composition in
parts per hundred rubber (phr). Ingredient Quantity Natural rubber NR 100
Carbon black 0
Antioxidant 6PPD 1.9
Stearic acid 2
Zinc oxide ZnO 2.5 Accelerator CBS 1.6 Sulfur solution 2H 1.6
Figure 1. Specimen geometry.
ECCMRVIII.indb 506
ECCMRVIII.indb 506 5/7/2013 4:58:48 PM5/7/2013 4:58:48 PM
was stabilized before performing the calibration and the measurement, it was switched on four hours before the beginning of the experiments. The stabilization of the internal temperature of the camera is necessary to avoid any measurement drift during the tests.
The temperature fields obtained were filtered using an averaging filter. In the present case, the specimen response is considered as thermally homogeneous, due to the very low thermal con-ductivity of rubber. So, the thermal quantity considered here, is the mean temperature varia-tion of a small zone (5px × 5px square located at the middle of the gauge length) during the test (see Fig. 3). This quantity is obtained by subtract-ing the initial temperature from the current one, Figure 2. The two mechanical loading conditions.
Table 2. IR camera features.
Features Values
Thermal resolution ([5–40 °C]) 20 mK Local plane array 320 × 240 pixels Wavelength range 3.5–5 μm Integration time 1500 μs Acquisition frequency 147 Hz
Figure 3. Motion compensation illustration.
Figure 4. Mechanical response at ±300 mm/min. after applying a suitable movement compensation technique, for further information see (Samaca Martinez, Le Cam, Balandraud, Toussaint, & Caillard 2013). As illustrated in Figure 3, the movement of this zone is taken into account in order to associate a temperature with the mate-rial zone at any time of the test. The displacement of the moving grip is directly measured from the thermal images.
3 RESULTS AND DISCUSSION 3.1 Cyclic test
3.1.1 Mechanical response
Results obtained at ±300 mm/min is presented in Figure 4. This figure presents the nominal stress, defined as the force per initial surface ratio, versus the stretch ratio. Firstly, it can be observed that the mechanical cycles have no effect on the mechani-cal response, in the sense that no stress softening is observed between cycles.
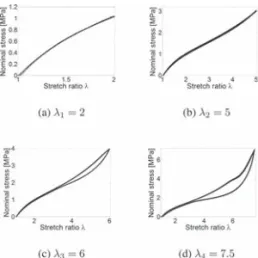
In order to detail more precisely each mechanical cycle, Figures 5 (a),(b),(c) and (d) give the curves for λ1 = 2, λ2 = 5, λ3= 6 and λ4= 7.5, respectively.
Each case exhibits a specific response:
i. for cycles at λ1= 2 and λ2= 5: In these cases, for
both maximum stretch ration tested, no hyster-esis loop can be observed.
ii. for cycles at λ3= 6: A hysteresis loop is formed.
The stress difference tends to disappear for a stretch ratio equal to 3. These results are in good agreement with those reported in the lit-erature for unfilled natural rubber. The hyster-esis loop is explained by the difference in the kinetics of crystallization and crystallite melt-ing (Toki, Fujimaki, & Okuyama 2000, Trabelsi, Albouy, & Rault 2003, Le Cam & Toussaint
ECCMRVIII.indb 507
ECCMRVIII.indb 507 5/7/2013 4:58:49 PM5/7/2013 4:58:49 PM
2008). If the stretch ratio applied exceeds the stretch ratio at which crystallization occurs (around 4 for natural rubber), a hysteresis loop begins to form.
iii. for cycles at λ4= 7.5: A plateau is observed from
λ = 6 on, followed by a high stress increase. As explained in (Toki, Fujimaki, & Okuyama 2000) and (Trabelsi, Albouy, & Rault 2003), once SIC occurs, relaxation is induced in the amorphous phase. As a consequence, a pla-teau forms. For higher stretch ratio levels, crystallites act as fillers and strongly reinforce the material stiffness, which explains the high increase in the nominal stress. As for the previ-ous cycles at λ3= 6, the hysteresis loop closes
at around λ = 3, which is close to the stretch ratio at which crystallite melting is assumed to be complete.
3.1.2 Thermal response
The thermal response of the specimen was meas-ured during the mechanical test. The aim of such a measurement is twofold. The first objective is to characterize the thermal response of rubber during a classic mechanical test. The second objective is to highlight the effects of the number of cycles on the thermal response.
In order to understand this thermal response, the contribution of the heat exchanges with the outside of the specimen (level of non- adiabaticity of the evolution) must be taken into account. Results are detailed and commented in the follow-ing paragraph for each loadfollow-ing step:
i. for cycles at λ1= 2: Figure 6(a) gives the
tempera-ture variation for the three cycles at ±300 mm/min. It can be noted that in this figure, the time scale has been initialized at the beginning of each cycle. During the loading phase, the temperature
variation first decreases before increasing. This is a well-known phenomenon in rubbery materi-als (Joule 1857), which is explained by the com-petition between the effects of internal energy variation and entropy variation with respect to the strain level. This leads to the occurrence of the so-called thermoelastic inversion, in this case close to λ = 1.1. Obviously, this phenom-enon is also observed during unloading. It can be also noted that the temperature variation at the end of the first cycle is inferior to that at the beginning of the cycle so a shift in the curve position is observed between the cycles. This observation can easily be explained by considering the heat exchanges with the outside of the specimen (mainly the ambient air), more precisely the effects of the non-adiabaticity conditions on the thermal response. The inter-ested reader is referred to (Samaca Martinez, Le Cam, Balandraud, Toussaint, & Caillard 2013) for further information.
ii. for cycles at λ2 = 5: Figure 6(a) presents the
temperature variations obtained for the second set of three cycles. As in the previous case, the time scale has been initialized at the beginning of each cycle. Two comments can be made from this figure. First, the maximum temperature var-iation is greater than previously (about 1.8°C, to be compared to 0.15°C, see Figure 6(a)). Second, the stabilized regime is not reached after three cycles (different temperatures at the beginning and at the end of the third cycle). This is explained by the fact that the material did not have enough time to reach the stabilized regime. Consequently, stabilization occurs with a greater number of cycles.
iii. for cycles at λ3= 6: Figure 6(c) presents the
tem-perature variation obtained for the third set of three cycles. This curve exhibits some major
dif-Figure 6. Temperature variations obtained for the four sets of three cycles.
Figure 5. Three mechanical cycles at four increasing stretch ratios.
ECCMRVIII.indb 508
ECCMRVIII.indb 508 5/7/2013 4:58:49 PM5/7/2013 4:58:49 PM
ferences compared to those obtained for smaller maximum stretch ratios (λ1 and λ2). This figure
shows a great increase in temperature variation of around 3°C during loading at time t = 8s. Two reasons can explain that this phenomenon is due to crystallization. First, crystallization is a strong exothermic phenomenon. Second, the stretch ratio at time t = 7s is close to the stretch ratio usually considered for the beginning of crystallization.
iv. for cycles at λ4= 7.5: Figure 6(d) presents the
temperature variation obtained for the fourth set of three cycles. The great increase in tem-perature is once more observed starting from a stretch ratio close to the value usually con-sidered for the beginning of crystallization. It can also be observed that the temperature rate slightly decreases at the end of each loading phase. Two factors may explain this phenom-enon: either heat exchanges with the outside of the specimen, or a decrease in the crystallization rate, as shown in (Flory 1947). Only an analysis based on heat source calculation can provide the explanation. It appears that the stabilized regime is nearly obtained from the second cycle (the second and third unloading curves are superimposed). It should finally be noted that the temperature variation for this maximum stretch ratio applied reaches 9°C.
3.2 Loading-unloading test with pauses 3.2.1 Mechanical response
Figure 7 shows that during the loading pauses, the stress relaxes if the stretch ratio applied is higher than λc. Upon unloading, the stress does not
sig-nificantly evolve, whatever the fixed strain. The fact that stress relaxation is observed only if the stretch ratio is superior to that at which crystalliza-tion begins is in good agreement with the results obtained by (Marchal 2006) and (Le Cam & Toussaint 2008). Moreover, the fact that no sig-nificant evolution in stress is observed during
unloading seems to highlight a difference in the kinetics of crystallization and crystallite melting. Finally, the residual stretch ratio obtained at the end of the mechanical cycle is nearly equal to 1.5. This value is much higher than that obtained dur-ing the cyclic test (1.1, see Fig. 4). Two hypotheses can be proposed to explain such a result. First, the static relaxations imply additional crystallization, leading to more crystals which are not completely melted at the end of the procedure. Second, there are internal stresses due to entanglements in the material network (topological stresses) whose effect is altered by the successive relaxation steps. 3.2.2 Thermal response
The thermal measurements performed during the test provide complementary information about the processes of crystallization and crystallite melting.
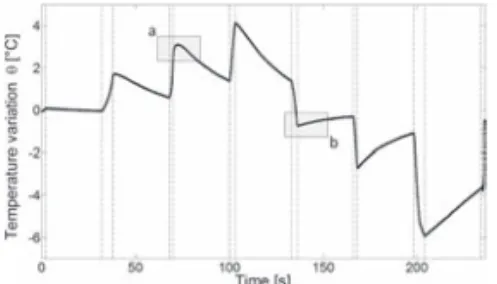
Figure 8 presents the temperature variation θ versus time. The value of θ varies between −6°C and 4°C. Let us now examine this temperature evo-lution in two steps:
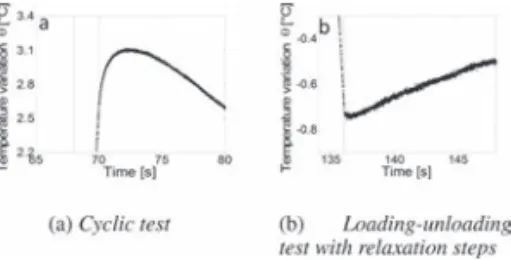
(i) During the loading phase: the temperature vari-ation θ(t) is always positive during the successive loading phases, and tends to return to zero when the stretch ratio is kept constant. It is worth noting that, if the applied stretch ratio is higher than λc, the temperature continues to increase
for a few seconds before decreasing. This can be seen in Figure 9(a). It is to be noted that the phenomenon is not observed for stretch ratios inferior to λc. As thermoelastic coupling cannot
explain this phenomenon and as viscosity is not observed in the material under study, the fact that the crystallinity continues is the only expla-nation for this increase in temperature (crystal-lization is a strong exothermic phenomenon). It can be noted that similar phenomena have also been observed in metallic materials subjected to first-order phase transformation (accompanied by latent heat production) (Balandraud, Ernst, & Soos 2000).
ii. During the unloading phase: the temperature variation θ(t) is always negative during the successive unloading phases, and tends to return
Figure 7. Nominal stress versus stretch ratio during the relaxation test.
Figure 8. Temperature variation measured during the relaxation test.
ECCMRVIII.indb 509
ECCMRVIII.indb 509 5/7/2013 4:58:50 PM5/7/2013 4:58:50 PM
to the ambient temperature when the stretch ratio remains constant (see Figure 8). Contrary to loading, no “out-of-phase” phenomenon is observed for pauses at stretch ratios superior to λc, as shown in Figure 9(b). This observation
confirms the kinetic difference between crystal-lization and crystallite melting.
4 CONCLUSION
This paper investigates the thermal response associated with deformation processes in unfilled natural rubber. For this purpose, cyclic and stress relaxation tests were performed. Temperature vari-ations measured by infrared camera were analyzed during loading, unloading and stress relaxation for the stretch ratio range in which crystallization occurs. Results show that the entropic behaviour of natural rubber leads to heat production (absorption) during loading (unloading). The thermal response is found to provide additional information on deformation processes, more particularly with respect to strain-induced crystallization. Indeed, a significant tem-perature increase is observed when strain-induced crystallization occurs, and the temperature evolu-tion shows that the kinetics of crystallizaevolu-tion and of crystallite melting are different. Nevertheless, due to the heat exchange between the specimen and its environment, temperature variation is not the most relevant quantity to link the thermal response to the change in the microstructure. More particularly, temperature variation does not enable us to charac-terize separately thermomechanical couplings and mechanical dissipation. This is the reason why the calculation of heat sources from the temperature measurement is certainly a new route to revisit the analysis presented in the present paper.
REFERENCES
Balandraud, X., E. Ernst, & E. Soos (2000). Relaxation and creep phenomena in shape memory alloys. part ii: Stress relaxation and strain creep during phase transformation. Zeitschrift fur Angewandte
Mathema-tik und Physik 51, 419–448.
Chagnon, G., E. Verron, L. Gornet, G. Marckmann, & P. Charrier (2004). On the relevance of the Mullins effect as applied to stress-softening in elastomers. Journal of
the Mechanics and Physics of Solids 52, 1627–1650.
Chrysochoos, A. & H. Louche (2000). An infrared image processing to analyse the calorific effects accompany-ing strain localisation. Int J Eng Sci 38, 1759–1788. Chrysochoos, A. & H. Louche (2001). Thermal and
dissi-pative effects accompanying luders band propagation.
Mat Sci Eng A-struct 307, 15–22.
Flory, P.J. (1947). Thermodynamics of crystallization in high polymers. i. crystallization induced by stretching.
The Journal of Chemical Physics 15, 397–408.
Huneau, B. (2011). Strain-induced crystallization of natural rubber: a review of x-ray diffraction investiga-tions. Rubber Chemistry and Technology 84, 425–452. Joule, J.P. (1857). On some thermodynamic properties of
solids. Phil Mag 4th 14, 227.
Le Cam, J.-B. & E. Toussaint (2008). Volume vari-ation in stretched natural rubber: competition between cavitation and stress-induced crystallization. Macromolecules 41, 7579–7583.
Marchal, J. (2006). Cristallisation des caoutchoucs chargés et non chargés sous contrainte: Effet sur les chaînes amorphes. Ph. D. thesis, PhD Thesis, Université Paris XI Orsay, France.
Mullins, L. (1948). Effect of stretching on the properties of rubber. Rubber Chemistry and Technology 21, 281–300. Pottier, T., M.-P. Moutrille, J.-B. Le Cam, X. Balandraud, & M. Grédiac (2009). Study on the use of motion compensation technique to determine heat sources. application to large deformations on cracked rubber specimens. Experimental Mechanics 49, 561–574. Samaca Martinez, J.R., J.-B. Le Cam, X. Balandraud,
E. Toussaint, & J. Caillard (2013). Mechanisms of deformation in crystallizable natural rubber. part 1: thermal characterization. Polymer, Doi: 10.1016/j.
polymer.2013.03.011.
Stringfellow, R. & R. Abeyaratne (1989). Cavitation in an elastomer: Comparison of theory with experiment.
Materials Science and Engineering: A 112, 127–131.
Toki, S., T. Fujimaki, & M. Okuyama (2000). Strain-induced crystallization of natural rubber as detected real-time by wide-angle x-ray diffraction technique.
Polymer 41, 5423–5429.
Toki, S., I. Sics, S. Ran, L. Liu, B. Hsiao, S. Murakami, K. Senoo, & S. Kohjiya (2002). Macromolecules 35, 6578–6584.
Toussaint, E., X. Balandraud, J.-B. Le Cam, & M. Grédiac (2012). Combining displacement, strain, temperature and heat source fields to investigate the thermomechanical response of an elastomeric speci-men subjected to large deformations. Polymer Testing 31, 916–925.
Trabelsi, S., P.-A. Albouy, & J. Rault (2002). Stress-induced crystallization around a crack tip in natural rubber.
Macromolecules 35, 10054–10061.
Trabelsi, S., P.-A. Albouy, & J. Rault (2003). Effective local deformation in stretched filled rubber. Macromolecules 36, 9093–9099.
Figure 9. Magnification of the boxed zones in Figure 8.
ECCMRVIII.indb 510
ECCMRVIII.indb 510 5/7/2013 4:58:50 PM5/7/2013 4:58:50 PM