HAL Id: inserm-00627686
https://www.hal.inserm.fr/inserm-00627686
Submitted on 29 Sep 2011
HAL is a multi-disciplinary open access
archive for the deposit and dissemination of
sci-entific research documents, whether they are
pub-lished or not. The documents may come from
teaching and research institutions in France or
abroad, or from public or private research centers.
L’archive ouverte pluridisciplinaire HAL, est
destinée au dépôt et à la diffusion de documents
scientifiques de niveau recherche, publiés ou non,
émanant des établissements d’enseignement et de
recherche français ou étrangers, des laboratoires
publics ou privés.
progression.
Diana Connolly, Zhixia Yang, Maria Castaldi, Nichelle Simmons, Maja Oktay,
Salvatore Coniglio, Melissa Fazzari, Pascal Verdier-Pinard, Cristina Montagna
To cite this version:
Diana Connolly, Zhixia Yang, Maria Castaldi, Nichelle Simmons, Maja Oktay, et al.. Septin 9 isoform
expression, localization and epigenetic changes during human and mouse breast cancer progression..
Breast Cancer Research, BioMed Central, 2011, 13 (4), pp.R76. �10.1186/bcr2924�. �inserm-00627686�
epigenetic changes during human and mouse
breast cancer progression
Connolly et al.
Connolly et al. Breast Cancer Research 2011, 13:R76 http://breast-cancer-research.com/content/13/4/R76 (10 August 2011)
R E S E A R C H A R T I C L E
Open Access
Septin 9 isoform expression, localization and
epigenetic changes during human and mouse
breast cancer progression
Diana Connolly
1†, Zhixia Yang
1†, Maria Castaldi
2, Nichelle Simmons
3, Maja H Oktay
4, Salvatore Coniglio
5,
Melissa J Fazzari
6, Pascal Verdier-Pinard
7,8,9and Cristina Montagna
1,4*Abstract
Introduction: Altered expression of Septin 9 (SEPT9), a septin coding for multiple isoform variants, has been observed in several carcinomas, including colorectal, head and neck, ovarian and breast, compared to normal tissues. The mechanisms regulating its expression during tumor initiation and progression in vivo and the oncogenic function of its different isoforms remain elusive.
Methods: Using an integrative approach, we investigated SEPT9 at the genetic, epigenetic, mRNA and protein levels in breast cancer. We analyzed a panel of breast cancer cell lines, human primary tumors and corresponding tumor-free areas, normal breast tissues from reduction mammoplasty patients, as well as primary mammary gland adenocarcinomas derived from the polyoma virus middle T antigen, or PyMT, mouse model. MCF7 clones
expressing individual GFP-tagged SEPT9 isoforms were used to determine their respective intracellular distributions and effects on cell migration.
Results: An overall increase in gene amplification and altered expression of SEPT9 were observed during breast tumorigenesis. We identified an intragenic alternative promoter at which methylation regulates SEPT9_v3 expression. Transfection of specific GFP-SEPT9 isoforms in MCF7 cells indicates that these isoforms exhibit differential localization and affect migration rates. Additionally, the loss of an uncharacterized SEPT9 nucleolar localization is observed during tumorigenesis.
Conclusions: In this study, we found conserved in vivo changes of SEPT9 gene amplification and overexpression during human and mouse breast tumorigenesis. We show that DNA methylation is a prominent mechanism responsible for regulating differential SEPT9 isoform expression and that breast tumor samples exhibit distinctive SEPT9 intracellular localization. Together, these findings support the significance of SEPT9 as a promising tool in breast cancer detection and further emphasize the importance of analyzing and targeting SEPT9 isoform-specific expression and function.
Keywords: Septin 9, breast cancer, oncogene, epigenetics, cytoskeleton
Introduction
Identification of biomarkers for early detection and new therapeutic targets of breast cancer helps to continu-ously reduce the morbidity of this frequent pathology in women. This entails resolving the physiological, cellular
and molecular processes underlying the complexity of breast tumor development and associated tumor hetero-geneity. One of the main sources of biomarkers and tar-geted chemotherapy is the cytoskeleton. Cytoskeleton-associated proteins are frequently misregulated during cancer initiation and progression and thus contribute to cancer cell proliferation, migration and invasion [1]. Septin guanosine triphosphatases that assemble into fila-ments represent such proteins. We previously identified Septin 9 (SEPT9), a cytoskeletal component [2], as a
* Correspondence: [email protected] † Contributed equally
1
Department of Genetics, Albert Einstein College of Medicine, Yeshiva University, 1301 Morris Park Avenue, Bronx, NY 10461, USA
Full list of author information is available at the end of the article
© 2011 Connolly et al.; licensee BioMed Central Ltd. This is an open access article distributed under the terms of the Creative Commons Attribution License (http://creativecommons.org/licenses/by/2.0), which permits unrestricted use, distribution, and reproduction in any medium, provided the original work is properly cited.
potential oncogene in breast tumorigenesis [3]. Analysis of a limited set of mouse mammary gland (MG) adeno-carcinomas proposed SEPT9 as a novel oncogene because of its high level of genomic amplification in the form of double-minute chromosomes and jumping translocations. Such cytogenetic alterations act as a means of amplification for strong oncogenes, resulting in their overexpression and gain of function [4]. The role ofSEPT9 as an oncogene is also supported by the findings that this locus is a hot spot for viral insertions that cause mouse T-cell lymphoma [5,6], and in human acute myeloid leukemia this gene is found to be a fusion partner of mixed lineage leukemia [7,8]. Since our origi-nal report, other research groups have shown that amplification and/or overexpression ofSEPT9 occurs in ovarian carcinoma [9-11], head and neck cancer [12,13] and prostate cancer [14,15]. Additionally, SEPT9 down-regulation results in the arrest of cell division in human mammary epithelial cells and human cancer cell lines [16,17].
The importance of SEPT9 as an early detection mar-ker has recently been highlighted by the development of the diagnostic blood-based test for methylated SEPT9 DNA in colon cancer patients [18]. Nevertheless, the molecular mechanisms underlying the role of SEPT9 in tumor development are still largely unknown because of the expression of multiple isoforms [19], along with the fact that their modes of regulation have yet to be estab-lished. The oncogenic function of SEPT9in vivo is still unclear, although SEPT9_v1 in particular has recently been shown to promote tumor growth by inducing angiogenesis via the stabilization of hypoxia-inducible factor-1 alpha (HIF-1a) in a heterotransplant model [14]. Other studies using breast nontumorigenic and cancer cell lines have indicated that different SEPT9 iso-forms may have distinct cellular functions [20,21].
We performed a comprehensive and integrative analy-sis of SEPT9 gene amplification, expression at the mRNA and protein levels, and epigenetic profiling using a panel of human breast cell lines, tissues from breast cancer patients with premalignant lesions and primary adenocarcinomas, and normal breast tissue derived from reduction mammoplasty patients. We also used a mouse model for mammary tumorigenesis to examine progres-sive changes in Sept9 gene amplification and expression. Our data show that altered expression of SEPT9 iso-forms is associated with stages of breast tumorigenesis and that changes in the isoform expression pattern do not occur solely by alternative splicing. DNA methyla-tion of a putative alternative promoter region within SEPT9 demonstrates a regulatory mechanism that is responsible for the differing expression of at least one isoform in normal and cancer cells. In MCF7 clones expressing individual GFP-SEPT9 isoforms, we observed
differential cytoplasmic versus nuclear SEPT9 localiza-tion corresponding to varying migralocaliza-tion rates. Further-more, in addition to its cytoplasmic localization, SEPT9 was also present in the nucleoli of human and mouse normal mammary epithelial cells, a localization that was lost in mammary carcinoma cells.
Collectively, our results demonstrate thatSEPT9 is a marker for breast cancer that is worth investigating in large cohorts of patients and other cancer types. Such analysis will help to establish the significant genetic, epi-genetic and proteomic signatures of SEPT9 in breast cancer and provide the basis for its use in early detec-tion tests.
Materials and methods Patient clinical data
Fluorescencein situ hybridization (FISH) and immuno-fluorescence analysis using tissue microarrays (TMAs) have been described previously [22]. Flash-frozen nor-mal breast tissue, breast tumors and matching adjacent tumor-free areas used for real-time qRT-PCR and DNA methylation analysis were either collected at Jacobi Medical Hospital, kindly provided by Dr. Adrian L. Har-ris (Weatherall Institute of Molecular Medicine, Univer-sity of Oxford, Oxford, UK), or obtained from the Cooperative Human Tissue Network (Additional file 1, Supplementary Table 1). The samples obtained for this study are part of an approved protocol for the collection of breast tissue samples (CCI protocol 2007-433, approved by the Albert Einstein College of Medicine Committee on Clinical Investigations) and were gener-ated from leftover biopsies. Patient consent forms were obtained in compliance with the Declaration of Helsinki.
Mouse mammary gland adenocarcinomas
Mouse primary tumors were dissected from polyoma virus middle T antigen (PyMT) mice [23] (gift from Dr. Jeffrey W. Pollard, AECOM, Bronx, NY, USA) at the
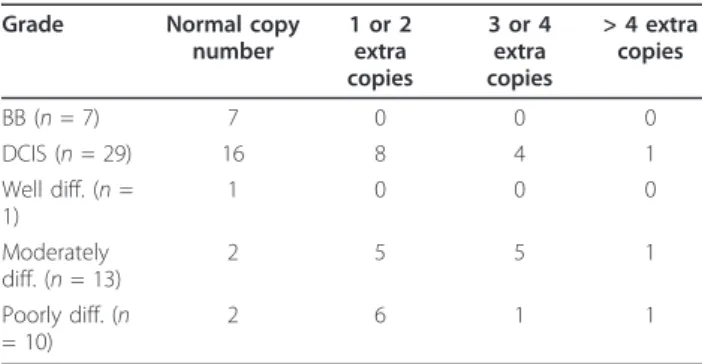
Table 1 Association between disease grade and copy number
Grade Normal copy number 1 or 2 extra copies 3 or 4 extra copies > 4 extra copies BB (n = 7) 7 0 0 0 DCIS (n = 29) 16 8 4 1 Well diff. (n = 1) 1 0 0 0 Moderately diff. (n = 13) 2 5 5 1 Poorly diff. (n = 10) 2 6 1 1
p-value (Exact chi-square test for association) < 0.05; p-value (exact CMH test for non-zero correlation) = < 0.05
indicated time points. Tumor-bearing glands were iso-lated and cut in half. One portion was processed for Western blot analysis and genetic studies, and the other was embedded in paraffin. Four-weeks-old C57B6 female mice serving as normal controls were killed, and the fourth inguinal MGs were dissected. The use of murine models for this study was approved by the Insti-tutional Animal Care and Use Committee at AECOM (protocol 20090502).
Cell lines
The cell lines used for experiments are shown in Addi-tional file 1, Supplementary Table 2. MCF10A cells were cultured as previously reported [24,25], hTERT-HME1 and 184A1 cells were cultured in mammary epithelium basal medium supplemented with the MEGM BulletKit (CC-3150; Lonza Group Ltd, Basel, Swtizerland) and all other cell lines were grown in DMEM supplemented with 10% fetal bovine serum. Because of the relatively high level of SEPT9 mRNA in the MCF10A cells, we analyzed the same cell line obtained from two different sources, Dr. Rachel Hazan (Department of Pathology, AECOM, Bronx, NY, USA) and the American Type Cul-ture Collection (Manassas, VA, USA) (Additional file 1, Supplementary Table 2). HCT116 is a colorectal cancer cell line that was included in the analysis as a control for our DNA methylation data, since its DNA is highly methylated [26] and because of the prognostic role of DNA methylation ofSEPT9 shown in colon cancer [27].
Fluorescencein situ hybridization analysis of cell lines and tissue microarrays
Nine bacterial artificial chromosome (BAC) clones map-ping to SEPT9, HER2 and CEP17 were obtained from the BACPAC Resources Center (Children’s Hospital Oakland Research Institute, Oakland, CA, USA). Clones and their genetic mapping are shown in Additional file 2, Supplementary Figure S1A. BAC clones mapping to the mouse Sept9 gene were previously reported [3]. DNA isolation, labeling, hybridization and imaging were performed as described previously [22,28]. Slide imaging was carried out with a Zeiss Axiovert 200 inverted microscope (Carl Zeiss MicroImaging, Inc., Thornwood, NY, USA) using SpectrumOrange (SO ™)-specific (Abbott Molecular, Des Plaines, IL, USA), Cy5-specific and 4’, 6-diamidino-2-phenylindole-specific filters (Chroma Technologies, Bellows Falls, VT, USA). Twenty-five cells were analyzed for each cell line, and locus-specific signals for SO (SEPT9) and Cy5 (HER2) were manually counted and plotted for further analysis. Unsupervised hierarchical clustering and heat map gen-eration representing the signals for each cell were per-formed using R version 2.8 statistical software [29]. On TMAs, signals within each cell were counted for a
minimum of 20 cells and scored as follows: two copies for each locus were classified as normal; cells with two copies of CEP17 and three to four copies ofSEPT9 were classified as low copy number gain (+); cells with loss of CEP17 and at least two copies ofSEPT9 and cells with two copies of CEP17 and five or more copies ofSEPT9 were classified as moderately high copy number gain (+ +); cells with more than five copies of SEPT9 were scored as high copy number gain (+++).
Fisher’s exact test of independence was used to test the null hypothesis of no association between grade and copy number, and the Cochran-Mantel-Haenszel test (based on Pearson’s r) was generated to test the null hypothesis of no linear association, given the ordinal nature of both grade and copy number categories.
Immunofluorescence on tissue sections and cell lines
Human TMAs (previously described), mouse mammary adenocarcinomas and age-matched normal tissues were baked at 60°C for 1 hour, deparaffinized in xylene (twice for 10 minutes each time) and rehydrated in a graded series of ethanol washes. Antigen retrieval was per-formed using Vector Antigen Unmasking Solution (H-3300; Vector Laboratories, Burlingame, CA, USA) for 20 minutes. Incubation with the following antibodies diluted in 3% goat serum/PBS was performed overnight at 37°C: anti-SEPT9 polyclonal antibody (gift from Dr. Koh-ichi Nagata, Institute for Developmental Research, Aichi, Japan [16]) detected with anti-rabbit Alexa Fluor 680 dye (Invitrogen, Carlsbad, CA, USA), monoclonal anti a-tubulin (DM1A clone; Sigma-Aldrich, St Louis, MO, USA) detected with anti-mouse Alexa Fluor 488 dye (Invitrogen); anti-nucleolin (gift of Dr. Thomas Meier, Department of Anatomy & Structural Biology, AECOM) detected with anti-mouse Alexa Fluor 488 dye (Invitrogen). All primary antibodies were used at a 1:1,000 dilution.
Stable MCF7 transfectants expressing GFP-tagged iso-forms of SEPT9 were fixed in 3.7% formaldehyde for 10 minutes at room temperature. All images were acquired with an Olympus BX61 inverted microscope equipped with a UPlanSApo 63 × objective oil immersion lens (Olympus Imaging America, Inc., Melville, NY, USA), a mercury arc lamp for excitation, narrow band filters for all fluorescence emission, and a SensiCamQE CCD cam-era system (PCO AG, Kelheim, Germany) using a FISH view.
Real-Time qRT-PCR
Total RNA was isolated from cancer cell lines, tissues and stably transfected GFP clones as reported previously [3]. cDNA was reverse-transcribed from 5μg of total RNA using random primers and SuperScript II Reverse Transcriptase (Invitrogen). SEPT9 and GFP primers
were designed with Primer3 software [30] (Additional file 1, Supplementary Table 3) along with glyceraldehyde 3-phosphate dehydrogenase (GAPDH) primers. SEPT9_v1 and SEPT9_v3 isoform primers were either as published [21] or designed by hand based on unique sequences at the 5’ end. Real-Rime qRT-PCR was per-formed using Applied Biosystems Fast SYBR Green Master Mix and the StepOnePlus Real-Time PCR Sys-tem (Life Technologies Corp., Carlsbad, CA, USA). Data normalization and analysis were performed as described previously [3].P values for statistically significant differ-ences in mRNA levels were calculated using at-test.
Western blot analysis of cell lines and tissues
Proteins (40μg) were extracted from cell lines and tis-sues (Additional file 1, Supplementary Table 4) and separated on 7.5% acrylamide SDS-PAGE gels, then transferred to nitrocellulose membranes. Alternatively, NuPAGE Novex 4% to 12% Bis-Tris gradient gel and 3-(N-morpholino) propanesulfonic acid SDS running buf-fer (Invitrogen, Cergy-Pontoise, France) were used to achieve maximal resolution of SEPT9 bands. SEPT9 was detected by enhanced chemiluminescence using the anti-SEPT9 antibody (1:4,000 dilution) provided by Dr. Nagata [31], which recognizes human and mouse SEPT9_v1 through SEPT9_v4 isoforms and some uncharacterized high-molecular-weight isoforms; the antibody provided by Dr. Cossart (Institut Pasteur, Paris, France [32]) (1:1,000 dilution), which recognizes human SEPT9_v1 to SEPT9_v5 isoforms; or an antibody that recognizes only SEPT9_v3 [33] (provided by Dr. Tachi-bana, Osaka City University, Osaka, Japan) (Additional file 3, Supplementary Figure S2). Anti-a-tubulin DM1A antibody was used at a 1:2,000 dilution (Cell Signaling Technologies, Danvers, MA, USA), and rabbit, anti-mouse and anti-rat secondary antibodies coupled to horseradish peroxidase were used at 1:2,000 dilutions (Jackson Immunoresearch Laboratories, Suffolk, UK). Quantification of bands was performed with the ImageJ software package (National Institutes of Health, Bethesda, MD, USA) and normalized to a-tubulin [34]. All positive bands between 37 and 75 kDa were counted as the SEPT9-related signal based on the expected mole-cular weight range defined by the five known isoforms (Additional file 1, Supplementary Table 5), and this sig-nal was normalized to thea-tubulin signal at 50 kDa.
Cloning of GFP-SEPT9 isoform fusions and generation of MCF7 stable transfectant clones
The SEPT9_v1, SEPT9_v2, SEPT9_v3, SEPT9_v4 and SEPT9_v5 isoforms [GenBank:AF189713, GenBank: AJ312319, GenBank:AF123052, GenBank:AJ312322 and GenBank:AJ312320] were cloned from normal breast cDNA (Clontech Laboratories, Inc., Mountain View,
CA, USA) using an isoform-specific forward primer con-taining aXhoI cassette and a reverse primer common to all isoforms containing a HindIII cassette (Additional file 1, Supplementary Table 3). Two micrograms of iso-form-specific plasmid were transfected into subconfluent MCF7 cells using FuGENE 6 Transfection Reagent (Roche Applied Science Indianapolis, IN, USA). Forty-eight hours after transfection cells were selected with 800 μg/mL G418 for 14 days. mRNA and protein levels were quantified for four clones per SEPT9-specific iso-form (total of 20 clones) by real-time qRT-PCR and Western blot analysis (Additional file 4, Supplementary Figure S3).
Cloning ofSEPT9_v3 promoter and luciferase assay
The genomic region chr17:72,824,475-72,827,999 of the hg18 build of the human genome was selected based on mammalian conservation and the publicly available ENCODE Project integrated regulation tracks [35]. The fragments shown in Figure 4B were cloned into the pGL3-Basic Luciferase Reporter Vector (Promega, Madi-son, WI, USA) and transfected into MCF7 cells, where lysates were quantified with the Dual-Luciferase Repor-ter Assay System (Promega). Data from three technical and two biological replicates were plotted for a total of six data points for each fragment.
Quantitative DNA methylation analysis using the MassARRAY EpiTYPER
Primers within the SEPT9_v3 promoter region were designed to include and target 10 different CpG sites using the MethPrimer program (Li Lab, University of California San Francisco, San Francisco, CA, USA) [36]. Matrix-assisted laser desorption/ionization time-of-flight mass spectrometry was performed using the MassAR-RAY EpiTYPER assay platform (SEQUENOM Inc., San Diego, CA, USA) on bisulfite-converted DNA as pre-viously described [37]. For bisulfite conversion of DNA, we used the Zymo DNA purification kit (Zymo Research Corp., Irvine, CA, USA). MassARRAY primers (SEQUE-NOM Inc.) were designed to cover the genomic region HSA17 using the hg17 build of the human genome (chr17:72,823,233-72,825,460) [38] (Additional file 1, Supplementary Table 3). For 5-aza-2’-deoxycytidine treatment, cell lines were plated in 100-mm Petri dishes, allowed to attach overnight and treated with 2μM 5-aza-2’-deoxycytidine for three days. Fresh 5-aza-2’-deox-ycytidine stock was made every day and replaced together with media. Statistical analysis of the differ-ences in methylation percentages between paired tumor and adjacent normal tissue samples at each CpG site was performed using nonparametric Wilcoxon signed-rank tests.P values were adjusted using the Holm-Bon-ferroni step-down method to correct for multiple testing
[39]. The average methylation percentage across all CpG sites was compared in tumors versus tumor-free adja-cent tissues as well as normal tissues using a paired t-test. Regression analysis to determine the coefficient of correlation betweenSEPT9_v3 mRNA and DNA methy-lation levels was performed using Microsoft Excel ver-sion 11.6.3 software (Microsoft Corp., Redmond, WA, USA).
Migration assay and colony size assessment
Transwell inserts (8 μM; Millipore, Billerica, MA, USA) were coated with 25 μg/mL type I rat tail collagen (BD Biosciences Franklin Lakes, NJ, USA). Cells (5 × 10⁴ in DMEM 0.3% BSA) were added in triplicate for each sample to the transwell inserts and allowed to migrate for 10 hours at 37°C. Nonmigratory cells were removed and filters were fixed in 3.7% formaldehyde/PBS for 15 minutes and stained with 0.2% crystal violet dye for 10 minutes. Migrated cells were counted and averaged from 10 fields of view per filter at 20 × magnification using an Axio Observer.A1 inverted microscope (Carl Zeiss MicroImaging, Inc.). Two independent biological replicate assays were analyzed. For cluster analysis, cells were seeded at 3.8 × 10³/cm2and allowed to grow for 5 days. The number of cells comprising clusters found within one-fourth of a 60-mm plate was counted for each cell line, again with the Axio Observer.A1 inverted microscope at 20 × magnification.
Results
To determine how alteredSEPT9 DNA copy number in human breast carcinogenesis might affect gene expres-sion and protein translation, we performed a compre-hensive analysis of DNA, mRNA and protein expression in a panel of 14 established and well-characterized human breast cancer cell lines. To potentially correlate in vitro with in vivo findings, 215 samples consisting of breast tumors, matched tumor-free tissues and normal breast epithelium were analyzed (Additional file 1, Sup-plementary Table 1).
SEPT9 is amplified in breast cancer cell lines and human breast adenocarcinomas
Using FISH to determine DNA copy number, a locus-specific probe forSEPT9 was cohybridized with a probe for HER2, a well-established oncogenetic biomarker that maps to the same chromosome arm as SEPT9 (Addi-tional file 2, Supplementary Figure S1A). Gene amplifi-cation of both loci was observed in most cancer cell lines and human breast carcinoma samples (Figure 1A). The nontumorigenic epithelial cell line MCF10A exhib-ited the lowest copy number for both SEPT9 and HER2 oncogenes (2.6 and 2.28 average number of copies per cell, respectively) (Additional file 2, Supplementary
Figure S1B). The nontumorigenic cell line HBL100, however, carries a higher average number of copies per cell for both genes (8.96 and 8.68), which is consistent with the knowledge that over time, cultured, immorta-lized cell lines derived from nontumorigenic breast tis-sue may acquire cytogenetic alterations similar to those of cancer cell lines [40]. Unsupervised clustering based onSEPT9 signals counted within each cell separated the 12 cell lines into low and high copy number clusters (Figure 1B). The low SEPT9 copy number group included the nontumorigenic HBL100 and MCF10A cell lines, while the high copy number group included the highly tumorigenic SKBR3 and MDA-MB-231 cell lines. Analysis of SEPT9 and HER2 copies for each cell line within a single cell revealed that the amplification of SEPT9 and HER2 represents two independent cytoge-netic events (Additional file 2, Supplementary Figure S1C).
SEPT9 is overexpressed at the mRNA and protein levels in breast cancer cell lines and human breast
adenocarcinomas
We aimed to determine whether genomic amplification of SEPT9 results in increased mRNA levels in human breast cancer cell lines and whether this change trans-lates into higher protein levels. Quantification of total SEPT9 mRNA levels (Figure 1C) showed that the cell lines expressed variable SEPT9 mRNA levels, but we found no direct correlation between mRNA levels and DNA copy number, suggesting that a more complex mode of regulation might occur at this genomic locus.
Because cytogenetic alterations of cell lines in two-dimensional culture systems may not accurately reflect what occurs in vivo, we examined the differences in SEPT9 expression in normal and tumor human breast tissues at the mRNA and protein levels. SEPT9 mRNA expression was quantified in 93 breast tissue samples consisting of normal tissue from individuals who had undergone reduction mammoplasty and tumors and their corresponding adjacent tumor-free breast tissue from cancer patients. There was a significant increase in SEPT9 in tumor tissues compared to both normal and tumor-free adjacent tissues (Figure 2A). Additionally, we analyzed SEPT9 protein content in breast tissues and tumors and found a significant increase in SEPT9 pro-tein expression in tumors compared to normal tissues (Figure 2B and Additional file 5, Figure Supplementary S4B). Notably, we found higher expression in adjacent tumor-free tissues compared to normal tissues. This result suggests that either (1) SEPT9 protein expression might be influenced by the tumor microenvironment, thus affecting the adjacent tumor-free area of the breast, or (2) SEPT9 expression is altered early in the premalig-nant stage.
SEPT9 gene amplification and expression changes during breast tumor progression
The observed differences in SEPT9 gene amplification and mRNA and protein levels in breast tumors com-pared to normal breast tissues prompted us to test whether these changes are associated with tumor grade. We analyzed SEPT9 copy number in a tumor set
including benign tissues, ductal carcinoma in situ (DCIS) and breast tumors classified as poorly or moder-ately differentiated (grade II or III, respectively). For well-differentiated tumors (grade I), only one sample was available, and although it was included in the analy-sis, it was not used to draw conclusions. Only approxi-mately one-half of the DCIS samples analyzed presented
Figure 1SEPT9 is amplified in human breast cancer. (A) FISH labeling of SEPT9 gene (green) and HER2 gene (red) in SKBR3 breast cancer cells (left panel) and primary invasive ductal carcinoma (IDC) breast tissue (right panel). (B) Unsupervised hierarchical clustering of SEPT9 DNA copy number in human cell lines. Each block represents one cell, and 25 cells were counted for each cell line. (C) Total SEPT9 mRNA levels in the human cell lines (Additional file 1, Supplementary Table 2).
Figure 2SEPT9 is amplified and overexpressed during breast tumorigenesis. (A) SEPT9 mRNA levels quantified in primary breast tumors (light gray circles), tumor-free adjacent tissues (dark gray) and normal breast tissues from reduction mammoplasty (black circles). (B)
Quantification of SEPT9 protein expression in breast primary tumors (light gray circles), tumor-free adjacent tissues (dark gray circles) and normal breast tissues from reduction mammoplasty (black circles). (C) Quantification of Sept9 gene copy number in normal mammary tissues and in primary mammary adenocarcinomas isolated from the PyMT mouse model at various stages of tumorigenesis (MG, normal mammary gland; 6 weeks premalignant hyperplasia, 8.9 weeks adenoma, and 14 and 20 weeks early and late carcinomas, respectively). Legend indicates copy number categories. (D) Sept9 mRNA levels in PyMT murine normal (black circles) and primary adenocarcinoma (light gray circles) mammary tissues. (E) Western blot depicting the pattern of Sept9 isoform (top panel) anda-tubulin (bottom panel) expression in normal mammary tissues and in primary mammary adenocarcinomas isolated from the PyMT mouse model at various stages of tumorigenesis. Values at the bottom indicate Sept9 expression levels normalized toa-tubulin. Only the bands between 37 and 75 kDa were used for quantification. T47D human breast cancer cell line in lane 9 was used as a reference to aid in isoform identification. (F) Left and center panels: immunohistofluorescence labeling of SEPT9 (red) anda-tubulin (green) in normal breast and adenocarcinoma tissues. White arrowheads indicate SEPT9 nuclear staining. Right panel: Colocalization of SEPT9 (red) and nucleolin (green) in normal breast tissues.
normal SEPT9 copy numbers, suggesting that genomic amplification of this oncogene occurs during early stages of tumorigenesis (Table 1). The maximum copy number detected in the primary tumors indicated that there are lower levels of gene amplification than those observed in breast cancer cell lines. The most significant finding of this analysis was thatSEPT9 copy number increased in grades II and III, suggesting that highSEPT9 amplifi-cation correlates with poor clinical outcome.
To further examine whetherSEPT9 gene amplification and increased SEPT9 mRNA and protein levels occur during tumor progression, we used the mammary carci-noma PyMT mouse model [41] to analyze stage-specific Sept9 expression. We detected Sept9 amplification in MGs with premalignant adenomas and observed that Sept9 gain (five signals per cell and higher) increases in advanced stage IV adenocarcinomas (Figure 2C). Simi-larly to human primary tumors, murine MG adenocarci-nomas also expressed higher Sept9 mRNA (Figure 2D) and protein levels (Figure 2E) than normal MGs. At the protein level, a differential pattern of Sept9 isoform expression was reproducibly observed in normal tissue, hyperplastic tissue, adenoma and early and late carcino-mas. There was an increase in Sept9 protein expression compared to normal MGs as early as the hyperplasia stage (six weeks). The most striking difference was a prominent decrease in the expression of a 120-kDa band with a concomitant increase in the expression of a 90-kDa band beyond hyperplasia (Figure 2E). Because these bands did not match any known isoform of Sept9, they were excluded from the quantification of Sept9 protein expression levels.
The observed quantitative changes in SEPT9 expres-sion between normal tissue and breast tumors and dur-ing tumor progression impelled us to perform immunofluorescence on the same TMAs used for FISH to detect whether significant changes in SEPT9 intracel-lular localization occurred. All cells expressed character-istic SEPT9 cytoplasmic staining, but, surprisingly, normal breast tissues bore a strong nuclear signal in the luminal layer of the epithelium that was lost in tumor cells (Figure 2F and Additional file 1, Supplementary Table 6). We also analyzed MGs isolated from four-week-old virgin C57B6 mice and found similar intracel-lular localization (Additional file 1, Supplementary Table 6). Additionally, when we analyzed PyMT tissues at var-ious stages of tumorigenesis, we found that approxi-mately 40% of cells (all luminal) exhibited nuclear staining in hyperplasia, whereas only about 2% of cells carried a nucleolar signal in advanced tumor stages. On the basis of the morphology and size of the nuclear staining, it appears that SEPT9 localizes to the nucleolus of normal breast cells, which was confirmed by its colo-calization with nucleolin (Figure 2F). Collectively, these
results suggest that in normal breast tissue, SEPT9 maintains both cytoplasmic and nucleolar localization, whereas during tumorigenesis only cytoplasmic expres-sion is retained.
Hypermethylation of theSEPT9_v3 putative promoter is frequent in breast tumors and results inSEPT9_v3 silencing
The lack of a direct correlation between SEPT9 copy number increases and mRNA levels prompted us to examine epigenetic modifications, specifically DNA methylation, at potential alternative transcription start sites (TSSs) in breast cancer. Alternative splicing of SEPT9 mRNA has previously been proposed as the pri-mary mode of regulation of SEPT9 isoforms [19]. Recently, it has been suggested that DNA methylation of CpG sites near specific TSSs coding for individual isoform variants may be an alternative regulatory mechanism [18]. On the basis of our genomic and computational analyses of the mammalianSEPT9 gene, we found a highly conserved genomic region contain-ing a CpG island that maps upstream to theSEPT9_v3 start codon, suggesting the presence of an alternative promoter (Figure 3A, top). We designed specific pri-mers that targeted and quantified the methylation per-centage at each CG dinucleotide within this region by using the highly sensitive MassARRAY technique on our panel of cell lines. Cell lines clustered into two groups, one group with theSEPT9_v3 TSS hypomethy-lated (average 18.4% methylation across all CpG sites) and one group with the SEPT9_v3 TSS hypermethy-lated (76.4%) (Figure 3A). To determine how DNA methylation alters SEPT9_v3 transcription, we quanti-fied specific SEPT9_v1 and SEPT9_v3 mRNA levels in cell lines, using SEPT9_v1 for comparison since this specific isoform has been shown to increase in cancer (Figure 3B). As expected, SEPT9_v1 was expressed in most cell lines, whereas significant differences in mRNA levels were observed for the SEPT9_v3 isoform. A subset of cell lines (T47D, MDA-MB-435, MCF7 and BT474) expressed nearly undetectable levels of SEPT9_v3, whereas other cell lines (HS578T, HBL100, MDA-MB-231, MCF10A, SKBR3 and MDA-MB-468) expressed high levels. Interestingly, cell lines with hypermethylation at the SEPT9_v3 start site exhibited lower levels of SEPT9_v3 mRNA, whereas cell lines with hypomethylation at the SEPT9_v3 start site expressed higher SEPT9_v3 mRNA levels (R2
= 0.678; significance deviation from zero:P = 0.0031) (Figures 3A and 3B). This finding also corresponded to repres-sion ofSEPT9_v3 expression at the protein level in cell lines that exhibited hypermethylation at the SEPT9_v3 start site (Figure 3C and Additional file 5, Supplemen-tary Figure S4A).
Figure 3 Hypermethylation of an alternative promoter in breast tumors downregulatesSEPT9_v3. (A) Quantification of DNA methylation at CpG sites upstream of the SEPT9_v3 transcription start site in cell lines targeted by MassARRAY. The unsupervised clustering distributes cell lines into two groups: hypomethylated and hypermethylated (left panel). Differences in the overall methylation percentages between these two groups are shown (right panel). White boxes represent CpG sites that were not analyzable. (B) Quantification of SEPT9_v1 and SEPT9_v3 isoform mRNA levels in human cell lines. (C) Expression of SEPT9 (top panel), SEPT9_v3 isoform (middle panel) anda-tubulin (bottom panel) detected by Western blot in the panel of breast cancer cell lines. Note that with the labeling of recombinant SEPT9_v1 and _v3 by an antibody recognizing both of these isoforms [16], the anti-SEPT9_v3 antibody recognizes the bottom band of the high-molecular-weight isoform doublet.
To confirm the functional consequence of DNA methylation at theSEPT9_v3 start site on transcription, a subset of cell lines was treated with the DNA demethylating agent 5-aza-2’-deoxycytidine. As expected, treatment of cell lines displaying hypermethy-lation of the SEPT9_v3 start site resulted in increased SEPT9_v3 mRNA expression (Figure 4A, left graph), whereas it had no effect on cell lines exhibiting hypo-methylation (Figure 4A, right graph). Taken together, these results strongly indicate that DNA methylation of an alternative promoter near the SEPT9_v3 TSS is a principal mechanism responsible for decreased SEPT9_v3 expression. The presence of an active alterna-tive promoter (Figure 4B, green bar) was confirmed by performing a luciferase reporter assay in which the genomic region upstream of theSEPT9_v3 TSS was tar-geted (Figure 4B).
Next we analyzed the methylation status of the CpG sites proximal to the SEPT9_ v3 TSS in human breast tumor samples, their matching tumor-free adjacent areas and normal breast tissues from reduction mam-moplasty patients (Figure 4C). MassARRAY analysis revealed an overall statistically significant difference in methylation levels between breast tumor tissues, the corresponding matching tumor-free area and normal breast tissues (52.9% versus 41.7% and 44.5%, respec-tively) (Figure 4C). Moreover, when DNA methylation was measured at each of the 10 individual CpG sites, we also found statistically significant differences in methyla-tion levels between the tumors and the matching tumor-free tissue samples. These results suggest that SEPT9_v3 may frequently be silenced in breast tumors by methylation of its promoter region.
SEPT9 isoforms differ in their respective cellular distribution and promigratory potential
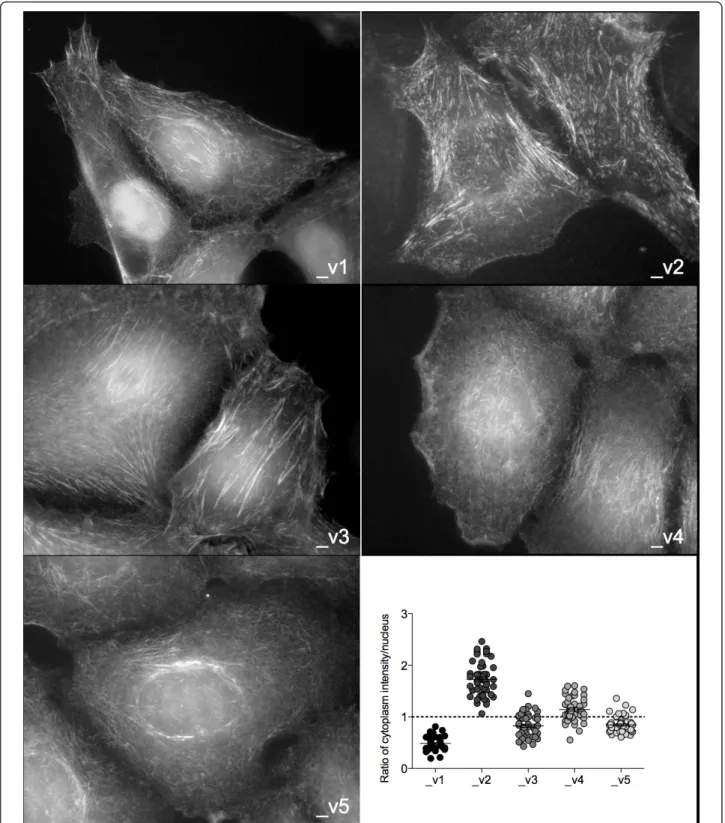
We sought to determine whether each SEPT9 isoform has similar intracellular distribution by generating stable MCF7 clones, each expressing one GFP-tagged SEPT9 isoform (Additional file 4, Supplementary Figure S3). All GFP-SEPT9 constructs were expressed in septin-like filamentous form, confirming functionality (Figure 5). Differences were observed in the organization of SEPT9 filaments between the nuclear region and the rest of the cytoplasm, thus the distribution of nuclear and cytoplas-mic immunofluorescence was quantified for each of the isoform clones. SEPT9_v1 was mainly expressed within the nucleus, whereas SEPT9_v2 localization was sparse in that region. The otherSEPT9 isoforms were relatively equally distributed between the nucleus and the rest of the cytoplasm.
Because of the presumed specific oncogenic nature of SEPT9_v1 [21] and the differences in interphase cellular distribution of SEPT9 isoforms, we tested the
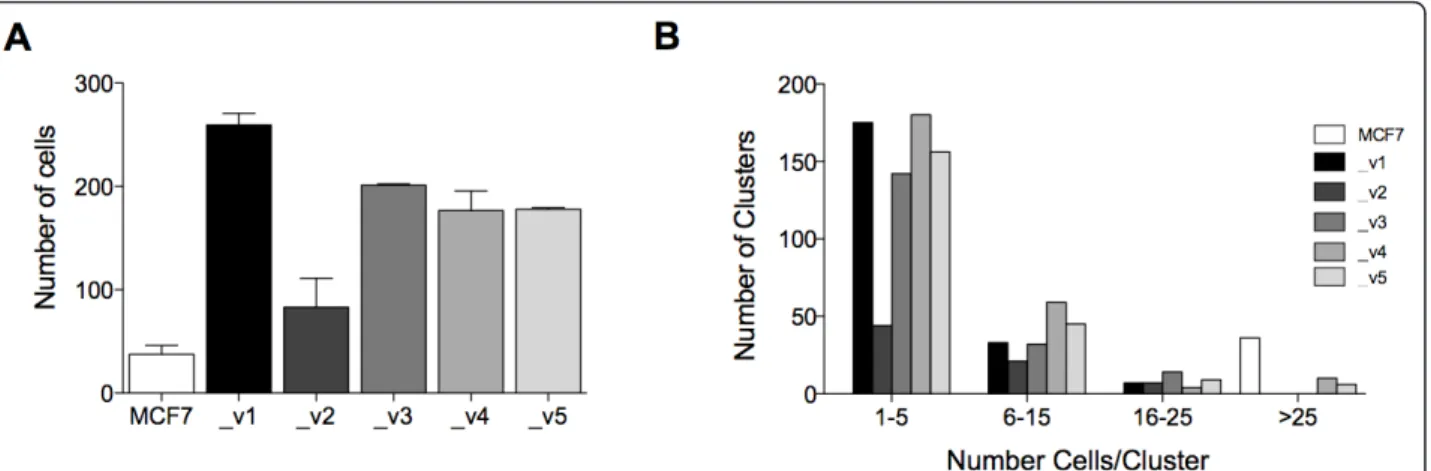
promigratory potential of each SEPT9 isoform in our stable MCF7 clones (Figure 6A). SEPT9_v1, GFP-SEPT9_v3, GFP-SEPT9_v4 and GFP-SEPT9_v5 showed significant increases in the number of migratory cells, whereas GFP-SEPT9_v2, despite a similar mRNA expression level of totalSEPT9 in cells (Additional file 4, Supplementary Figure S3D), was not as promigratory as the parental cell line. On the basis of this observation, we sought to determine whether increased migration is the result of a loss of cellular interaction, where single-cell growth is prevalent, as opposed to clustering, a common characteristic of epithelial cells. We counted the average number of cells present in a cluster for each GFP clone after five days of growth (Figure 6B). The data revealed that parental MCF7 tended to grow in clusters containing at least 25 cells. The least migratory isoform (GFP-SEPT9_v2) had the lowest number of cells per cluster in the 1-5 range compared to those that were most migratory (GFP-SEPT9_v1, GFP-SEPT9_v3, GFP-SEPT9_v4 and GFP-SEPT9_v5).
Discussion
In this study, we performed a comprehensive analysis of the SEPT9 locus at the levels of DNA copy number, mRNA and protein expression in breast cell lines, nor-mal human breast and breast tumor tissues, and nornor-mal mouse MGs and adenocarcinomas. We have shown that in humans,SEPT9 amplification varies at different stages of breast tumorigenesis and that in the PyMT mouse model it is dependent on the stepwise progression of mammary adenocarcinomas. Surprisingly, increases in SEPT9 gene copy number did not correlate with increased mRNA or protein expression in breast cell lines. However, in primary human and mouse tissues, more moderateSEPT9 gene amplification was observed, which correlated with elevated levels ofSEPT9 mRNA and protein. Examination of SEPT9 localization by immunofluorescence to detect human normal breast tis-sues and breast tumors, as well as normal mouse and mammary adenocarcinoma sections, revealed that, aside from cytoplasmic staining, a specific nucleolar localiza-tion in normal tissue was present, primarily in the lumi-nal layer of the ductal epithelium. Previous studies have shown that septins associate with the nuclear protein anillin during cytokinesis [42,43] and with karyopherins, a family of proteins involved in nuclear transport and septin SUMOylation [44]. Septins also interact with SOCS7 and accumulate in the nucleus to aid in DNA repair [45]. These studies, together with our results, sug-gest that septins may be involved in key nuclear pro-cesses contributing to normal cellular function and possibly to tumorigenesis.
Multiple modes of regulation are most likely responsi-ble for controlling SEPT9 isoform expression, one of
Figure 4 Hypermethylation of theSEPT9_v3 promoter occurs in human breast primary carcinomas. (A) Cell lines were treated with 5-aza-2’-deoxycytidine, and SEPT9_v3 mRNA was quantified. Representative cell lines with hypermethylation (left graph) and hypomethylation (right graph) of the SEPT9_v3 promoter region are displayed. U: untreated cells; T: treated cells. (B) SEPT9_v3 promoter region activity. Top: Location of tested luciferase fragments relative to the DMR. Bottom: Quantification of these fragments via luciferase reporter assay. (C) Supervised clustering of MassARRAY DNA methylation profiles in human primary adenocarcinomas, matching tumor-free areas and normal breast tissues. Right graph: Average levels of DNA methylation between tumors and tumor-free matching samples show a statistically significant difference.
Figure 5 SEPT9 isoforms localize in different cellular compartments. Fluorescence microscopy of MCF7 clones expressing individual GFP-SEPT9 isoforms (gray scale). Expression of GFP-GFP-SEPT9 isoform constructs was quantified and plotted as a ratio of intensities measured outside the region occupied by the nucleus to measurements within the nucleus (bottom right panel). Average ratios located above the dotted line indicate cytoplasmic expression and those below the line indicate nuclear expression.
which, as we have shown, is epigenetic silencing via DNA methylation. A differentially methylated region (DMR) upstream from theSEPT9_v3 start site was iden-tified where hypermethylation was shown to correlate with SEPT9_v3 silencing in cancer cell lines. Hyper-methylation of this region was also observed in breast carcinomas. A luciferase reporter assay confirmed the presence of an active alternative promoter downstream from the DMR. Further investigation of this region will help to identify the transcription factors involved in the expression ofSEPT9_v3 and how it is regulated during breast tumorigenesis. Our results suggest that expres-sion levels of high-molecular-weight SEPT9 isoforms might be regulated by methylation at alternative promo-ter regions, and the current use of the methylation sta-tus of the SEPT9_v2 putative alternative promoter region as a marker for the early detection of colon can-cer highly supports this hypothesis [18,46]. The role of methylation of CpG islands found in intragenic alterna-tive promoters has been highlighted in a recent gen-ome-wide study of the human brain, where this mode of regulation has been shown to be both tissue- and cell type-specific and is conserved in mouse [47]. Additional predicted alternative promoter regions must be studied to verify whetherSEPT9 isoforms are regulated solely by DNA methylation or by alternative mechanisms as sug-gested previously [48]. We have found that estrogen receptor (ER)-positive tumors express significantly higher levels of SEPT9 mRNA than ER-negative tumors (data not shown), suggesting that alternative promoters found within the SEPT9 gene might be differentially regulated in breast cancer, potentially through epigenetic modifications or hormonal regulation.
When we compared normal mouse mammary tissue to mammary adenocarcinomas in PyMT mice, we
observed increased expression of high-molecular-weight Sept9 isoforms (that is, isoforms SEPT9_v1, SEPT9_v2 and SEPT9_v3) during tumorigenesis. This finding is comparable to reports that suggest that SEPT9_v1 is one of the isoforms with oncogenic potential, as proven by different mechanisms. It stabilizes HIF-1a and increases during angiogenesis [14], and it stabilizes c-Jun N-terminal kinase and promotes proliferation [48]. Further identification and detailed mapping of posttran-slational modifications by mass spectrometry are required, and they may identify high-molecular-weight isoforms such as those observed in mouse tissues (90 and 120 kDa). We did not observe a protein band matching the molecular weight of Sept9_v4 in the PyMT tissue. This was to be expected, because in the mouse, a valine residue replaces the first methionine of human SEPT9_v4. However, the fact that there was no Sept9_v4 expression in the PyMT mouse model suggests that SEPT9_v4 is not a key isoform in breast tumor development.
If different SEPT9 isoforms maintain specific cellular functions, changes in their respective expression levels could result in a gain of oncogenic properties. To test this hypothesis, we generated MCF7 clones expressing each of five isoforms individually. We observed that GFP-SEPT9_v1 was primarily localized within the nucleus, whereas GFP-SEPT9_v2 displayed mainly cyto-plasmic localization, with the localization of GFP-SEPT9_v3, GFP-SEPT9_v4, and GFP-SEPT9_v5 being somewhat evenly distributed between both cellular com-partments. SEPT9 was initially found to be overex-pressed in human ovarian tumors with an observed increase inSEPT9_v1 and SEPT9_v4* isoform expression [10]. Our data, together with the findings of Petty’s group [49], suggest that SEPT9_v1 is a key isoform in
Figure 6 SEPT9 isoforms alter migratory properties of MCF7. (A) Transwell migration assay comparing MCF7 clones, each expressing a different GFP-SEPT9 isoform fusion construct. Plotting reflects the average number of migrated cells from two biological replicate assays conducted for each isoform. (B) Cell cluster size distribution for each MCF7 clone. The same gray scale is used in (A) and (B) to represent MCF7 and each isoform construct.
breast tumorigenesis that promotes cell migration. We observed that SEPT9_v2 influenced MCF7 cell migration the least and speculate that a regulatory mechanism such as methylation of its promoter prevents its expres-sion, and therefore its function, in this cell line. The role of SEPT9 in the migration of normal and cancer cells is presumably connected to its association with microtubules and the actin cytoskeleton [16,31,50]. Intercellular junctions that interact with the cytoskele-ton appear to be disrupted upon the overexpression of isoforms, causing an increase in the rate of migration, as shown by our results. A recent proteomic analysis of pseudopods isolated from metastatic cancer cell lines revealed that SEPT9 is enriched in these structures and that its downregulation induces a mesenchymal-epithe-lial transition [51], altering migration rates. SEPT9_v1 was found to exhibit nuclear localization and be the most promigratory isoform, whereas SEPT9_v2 was localized to the cytoplasm and affected migration rates the least. Further studies are necessary to determine whether cellular localization influences migration along with other cellular functions.
Collectively, our results strongly indicate that SEPT9 plays a role in tumorigenesis and that particular modes of regulation, such as epigenetic modifications, are involved in the differential expression of SEPT9 iso-forms. An intriguing question raised by our study is the possible connection between the loss of SEPT9 nuclear localization and tumor development. What determines this change in intracellular localization, and does it con-tribute to aneuploidy, apoptosis and/or cancer cell inva-sion and metastasis? Furthermore, is there a balance in specific expression of SEPT9 isoforms and/or posttran-slational modifications that drive localization and onco-genic potential? Our present and previous observations [3] indicate that SEPT9 operates as an oncogene in can-cer cells, but it may also sustain a tumor-suppressing function when localized in normal epithelial nuclei.
Conclusions
SEPT9 amplification occurs at the DNA level during human and mouse breast carcinogenesis and results in an overall increase inSEPT9 mRNA and protein levels. In this study, we have provided evidence that this pro-cess is associated with the alteration of SEPT9 isoform expression between normal and tumor cells in breast cancer. Moreover, we have shown that SEPT9_v3 iso-form expression is regulated via DNA methylation at an alternative promoter, potentially driving changes in iso-form expression during breast cancer initiation and pro-gression. Our data support the hypothesis thatSEPT9 isoforms maintain functional differences that could be selected for during tumor development and indicate that SEPT9 isoform profiling could lead to the development
of additional biomarkers for breast cancer detection, prognosis and treatment. Therefore, this study provides a rational framework for further analysis of the expres-sion of SEPT9 isoforms and their specific functions at the cellular and molecular levels in breast cancer development.
Additional material
Additional file 1: Supplementary Table 1. List of breast tissue samples. Supplementary Table 2. List of cell lines used in the study.
Supplementary Table 3. List of primer sequences. Supplementary Table 4. Western blot analysis protocol. Supplementary Table 5. Molecular weight of SEPT9 isoforms in human and mouse. Supplementary Table 6. Nuclear versus cytoplasmic localization.
Additional file 2: Supplementary Figure S1.SEPT9 is amplified in human breast cancer cell lines. (A) Mapping of BAC clones selected for FISH analysis for SEPT9, HER2 and the subcentromeric region of chromosome 17. (B) Raw counts of the number of SEPT9 (green) and HER2 (red) signals detected by FISH in each of the 25 cells analyzed in our cell line panel. (C) The number of analyzed cells shown to exhibit increased SEPT9 copies (green), HER2 copies (red) or a balanced number of SEPT9 and HER2 copies (black) in human cell lines.
Additional file 3: Supplementary Figure S2. Sequence alignment of mouse and human SEPT9_v1 and mapping of antigens used to generate the antibody.
Additional file 4: Supplementary Figure S3. GFP-SEPT9 isoform construct and expression. (A) Vector map and ideogram depicting the cloning strategy used to generate GFP-SEPT9 fused isoforms. (B) Western blots of untransfected MCF7 and GFP_v1 through GFP_v5 fused clones. The membrane was probed with an anti-GFP antibody (top panel), with the anti-SEPT9 antibody provided by Dr Nagata (middle panel) and with a-tubulin (bottom panel). (C) Isoform-specific primers suitable for cloned cDNA were designed to uniquely amplify the _v1 through _v5 isoforms. These primers were used to confirm the specific overexpression of each isoform. (D) Real-Time qRT-PCR was performed to determine the level of SEPT9 overexpression of the clones (gray bars) compared to the parental MCF7 (white bar).
Additional file 5: Supplementary Figure S4. SEPT9 expression in human cell lines and breast tissues. (A) SEPT9 expression in human breast cancer cell lines detected by Western blot analysis using Dr Nagata’s antibody. (B) Western blot of matching human primary breast tissues and adjacent tumor-free area showing the expression of SEPT9 isoforms detected with Dr Cossart’s antibody (top panel: Ponceau red, middle panel: SEPT9, bottom panel:a-tubulin).
Abbreviations
BAC: bacterial artificial chromosome; BSA: bovine serum albumin; DCIS: ductal carcinoma in situ; DMEM: Dulbecco’s modified Eagle’s medium; DMR: differentially methylated region; ER: estrogen receptor; FISH: fluorescence in situ hybridization; GFP: green fluorescent protein; HIF-1α: hypoxia-inducible factor-1 alpha; IDC: invasive ductal carcinoma; MG: mammary gland; PBS: phosphate-buffered saline; PyMT: polyoma virus middle T antigen; qRT-PCR: quantitative reverse transcriptase polymerase chain reaction; TMA: tissue microarray; TSS: transcription start site.
Acknowledgements
We thank the Shared Resources at Albert Einstein College of Medicine (AECOM): the Molecular Cytogenetic Facility, in particular Dr. Jidong Shan for her help with the FISH analysis, and the Genomics Core, in particular David Reynolds for his assistance with the methylation studies. We are grateful to Dr. Jeffrey Pollard (AECOM) for providing the PyMT mice and to Dr. Jeffrey Segall (AECOM) for providing insight and advice on the migration assays. We thank the Université de la Méditerranée International Relations for
financial support. We thank Jessie Brown, Priya Shivraj and Lauren Tal for their technical assistance. We thank Dr Elias Spiliotis for comments and scientific discussion. The work of the authors was supported by the grant from the ACS (ACS grant RSG-11-021-01-CNE to CM).
Author details
1
Department of Genetics, Albert Einstein College of Medicine, Yeshiva University, 1301 Morris Park Avenue, Bronx, NY 10461, USA.2Department of
Surgery, Jacobi Medical Center, 1400 Pelham Parkway South, Bronx, NY 10461, USA.3Department of Pathology, Jacobi Medical Center, 1400 Pelham
Parkway South, Bronx, NY 10461, USA.4Department of Pathology, Albert
Einstein College of Medicine, Yeshiva University, 111 East 210th Street, Bronx, NY 10467, USA.5Department of Anatomy and Structural Biology, Albert
Einstein College of Medicine, Yeshiva University, 1301 Morris Park Avenue, Bronx, NY 10461, USA.6Department of Epidemiology & Population Health,
Albert Einstein College of Medicine, Yeshiva University, 1301 Morris Park Avenue, Bronx, NY 10461, USA.7Centre de Recherche en Cancérologie de
Marseille, Inserm U891, 27 bd Leï Roure, BP 30059, 13273 Marseille Cedex 09 France.8Institut Paoli-Calmettes, F-13009 Marseille, 27 bd Leï Roure, BP
30059, 13273 Marseille Cedex 09 France.9Aix-Marseille Université, F-13007
Marseille, 27 bd Leï Roure, BP 30059, 13273 Marseille Cedex 09 France.
Authors’ contributions
DC carried out the methylation, real-time qRT-PCR and migration studies, as well as the immunofluorescence analysis, cell line and tissue sample collection and preparation, and edited and revised the manuscript. ZY performed the FISH and luciferase experiments and generated the GFP fusion clones. MC is the surgeon and NS and MHO are the pathologists who provided samples for analysis. SC supervised the migration assays. PVP performed the Western blot analysis and gave advice on manuscript preparation and revision. CM supervised the study and is responsible for the writing of the manuscript. All authors read and approved the final version of the manuscript.
Competing interests
The authors declare that they have no competing interests.
Received: 1 December 2010 Revised: 12 May 2011 Accepted: 10 August 2011 Published: 10 August 2011
References
1. Yamaguchi H, Condeelis J: Regulation of the actin cytoskeleton in cancer cell migration and invasion. Biochim Biophys Acta 2007, 1773:642-652. 2. Spiliotis ET, Nelson WJ: Here come the septins: novel polymers that
coordinate intracellular functions and organization. J Cell Sci 2006, 119:4-10.
3. Montagna C, Lyu MS, Hunter K, Lukes L, Lowther W, Reppert T, Hissong B, Weaver Z, Ried T: The Septin 9 (MSF) gene is amplified and
overexpressed in mouse mammary gland adenocarcinomas and human breast cancer cell lines. Cancer Res 2003, 63:2179-2187.
4. Kuttler F, Mai S: Formation of non-random extrachromosomal elements during development, differentiation and oncogenesis. Semin Cancer Biol 2007, 17:56-64.
5. Sørensen AB, Lund AH, Ethelberg S, Copeland NG, Jenkins NA, Pedersen FS: Sint1, a common integration site in SL3-3-induced T-cell lymphomas, harbors a putative proto-oncogene with homology to the septin gene family. J Virol 2000, 74:2161-2168.
6. Suzuki T, Shen H, Akagi K, Morse HC, Malley JD, Naiman DQ, Jenkins NA, Copeland NG: New genes involved in cancer identified by retroviral tagging. Nat Genet 2002, 32:166-174.
7. Osaka M, Rowley JD, Zeleznik-Le NJ: MSF (MLL septin-like fusion), a fusion partner gene of MLL, in a therapy-related acute myeloid leukemia with a t(11;17)(q23;q25). Proc Natl Acad Sci USA 1999, 96:6428-6433.
8. Taki T, Ohnishi H, Shinohara K, Sako M, Bessho F, Yanagisawa M, Hayashi Y: AF17q25, a putative septin family gene, fuses the MLL gene in acute myeloid leukemia with t(11;17)(q23;q25). Cancer Res 1999, 59:4261-4265. 9. Burrows JF, Chanduloy S, McIlhatton MA, Nagar H, Yeates K, Donaghy P,
Price J, Godwin AK, Johnston PG, Russell SE: Altered expression of the septin gene, SEPT9, in ovarian neoplasia. J Pathol 2003, 201:581-588.
10. Scott M, McCluggage WG, Hillan KJ, Hall PA, Russell SE: Altered patterns of transcription of the septin gene, SEPT9, in ovarian tumorigenesis. Int J Cancer 2006, 118:1325-1329.
11. Hall PA, Jung K, Hillan KJ, Russell SE: Expression profiling the human septin gene family. J Pathol 2005, 206:269-278.
12. Bennett KL, Karpenko M, Lin MT, Claus R, Arab K, Dyckhoff G, Plinkert P, Herpel E, Smiraglia D, Plass C: Frequently methylated tumor suppressor genes in head and neck squamous cell carcinoma. Cancer Res 2008, 68:4494-4499.
13. Stanbery L, D’Silva NJ, Lee JS, Bradford CR, Carey TE, Prince ME, Wolf GT, Worden FP, Cordell KG, Petty EM: High SEPT9_v1 expression is associated with poor clinical outcomes in head and neck squamous cell carcinoma. Transl Oncol 2010, 3:239-245.
14. Amir S, Golan M, Mabjeesh NJ: Targeted knockdown of SEPT9_v1 inhibits tumor growth and angiogenesis of human prostate cancer cells concomitant with disruption of hypoxia-inducible factor-1 pathway. Mol Cancer Res 2010, 8:643-652.
15. Amir S, Wang R, Matzkin H, Simons JW, Mabjeesh NJ: MSF-A interacts with hypoxia-inducible factor-1α and augments hypoxia-inducible factor transcriptional activation to affect tumorigenicity and angiogenesis. Cancer Res 2006, 66:856-866.
16. Nagata K, Kawajiri A, Matsui S, Takagishi M, Shiromizu T, Saitoh N, Izawa I, Kiyono T, Itoh TJ, Hotani H, Inagaki M: Filament formation of MSF-A, a mammalian septin, in human mammary epithelial cells depends on interactions with microtubules. J Biol Chem 2003, 278:18538-18543. 17. Estey MP, Di Ciano-Oliveira C, Froese CD, Bejide MT, Trimble WS: Distinct
roles of septins in cytokinesis: SEPT9 mediates midbody abscission. J Cell Biol 2010, 191:741-749.
18. Grützmann R, Molnar B, Pilarsky C, Habermann JK, Schlag PM, Saeger HD, Miehlke S, Stolz T, Model F, Roblick UJ, Bruch HP, Koch R, Liebenberg V, Devos T, Song X, Day RH, Sledziewski AZ, Lofton-Day C: Sensitive detection of colorectal cancer in peripheral blood by septin 9 DNA methylation assay. PLoS One 2008, 3:e3759.
19. McIlhatton MA, Burrows JF, Donaghy PG, Chanduloy S, Johnston PG, Russell SE: Genomic organization, complex splicing pattern and expression of a human septin gene on chromosome 17q25.3. Oncogene 2001, 20:5930-5939.
20. Robertson C, Church SW, Nagar HA, Price J, Hall PA, Russell SE: Properties of SEPT9 isoforms and the requirement for GTP binding. J Pathol 2004, 203:519-527.
21. Gonzalez ME, Peterson EA, Privette LM, Loffreda-Wren JL, Kalikin LM, Petty EM: High SEPT9_v1 expression in human breast cancer cells is associated with oncogenic phenotypes. Cancer Res 2007, 67:8554-8564. 22. Downing TE, Oktay MH, Fazzari MJ, Montagna C: Prognostic and predictive
value of 16p12.1 and 16q22.1 copy number changes in human breast cancer. Cancer Genet Cytogenet 2010, 198:52-61.
23. Lin EY, Jones JG, Li P, Zhu L, Whitney KD, Muller WJ, Pollard JW: Progression to malignancy in the polyoma middle T oncoprotein mouse breast cancer model provides a reliable model for human diseases. Am J Pathol 2003, 163:2113-2126.
24. Neve RM, Chin K, Fridlyand J, Yeh J, Baehner FL, Fevr T, Clark L, Bayani N, Coppe JP, Tong F, Speed T, Spellman PT, DeVries S, Lapuk A, Wang NJ, Kuo WL, Stilwell JL, Pinkel D, Albertson DG, Waldman FM, McCormick F, Dickson RB, Johnson MD, Lippman M, Ethier S, Gazdar A, Gray JW: A collection of breast cancer cell lines for the study of functionally distinct cancer subtypes. Cancer Cell 2006, 10:515-527.
25. Kao J, Salari K, Bocanegra M, Choi YL, Girard L, Gandhi J, Kwei KA, Hernandez-Boussard T, Wang P, Gazdar AF, Minna JD, Pollack JR: Molecular profiling of breast cancer cell lines defines relevant tumor models and provides a resource for cancer gene discovery. PLoS One 2009, 4:e6146. 26. Kondo Y, Shen L, Issa JP: Critical role of histone methylation in tumor
suppressor gene silencing in colorectal cancer. Mol Cell Biol 2003, 23:206-215.
27. He Q, Chen HY, Bai EQ, Luo YX, Fu RJ, He YS, Jiang J, Wang HQ: Development of a multiplex MethyLight assay for the detection of multigene methylation in human colorectal cancer. Cancer Genet Cytogenet 2010, 202:1-10.
28. Roohi J, Cammer M, Montagna C, Hatchwell E: An improved method for generating BAC DNA suitable for FISH. Cytogenet Genome Res 2008, 121:7-9.
29. Bates D, Chambers J, Dalgaard P, Falcon S, Gentleman R, Hornik K, Iacus S, Ihaka R, Leisch F, Ligges U, Lumley T, Maechler M, Murdoch D, Murrell P, Plummer M, Ripley B, Sarkar D, Temple Lang D, Tierney L, Urbanek S: R: A Language and Environment for Statistical Computing. Version 2.8. Vienna: The R Project for Statistical Computing; 2008 [http://www.r-project. org/].
30. Rozen S, Skaletsky H: Primer3 on the WWW for general users and for biologist programmers. Methods Mol Biol 2000, 132:365-386.
31. Nagata K, Asano T, Nozawa Y, Inagaki M: Biochemical and cell biological analyses of a mammalian septin complex, Sept7/9b/11. J Biol Chem 2004, 279:55895-55904.
32. Pizarro-Cerdá J, Jonquières R, Gouin E, Vandekerckhove J, Garin J, Cossart P: Distinct protein patterns associated with Listeria monocytogenes InlA- or InlB-phagosomes. Cell Microbiol 2002, 4:101-115.
33. Tachibana T, Okazaki E, Yoshimi T, Azuma M, Kakehashi A, Wanibuchi H: Rat monoclonal antibody specific for septin 9. Hybridoma (Larchmt) 2010, 29:169-171.
34. ImageJ software. [http://rsb.info.nih.gov/ij/].
35. ENCODE Project Consortium: The ENCODE (ENCyclopedia Of DNA Elements) Project. Science 2004, 306:636-640.
36. Li LC, Dahiya R: MethPrimer: designing primers for methylation PCRs. Bioinformatics 2002, 18:1427-1431.
37. Ehrich M, Nelson MR, Stanssens P, Zabeau M, Liloglou T, Xinarianos G, Cantor CR, Field JK, van den Boom D: Quantitative high-throughput analysis of DNA methylation patterns by base-specific cleavage and mass spectrometry. Proc Natl Acad Sci USA 2005, 102:15785-15790. 38. Thompson RF, Suzuki M, Lau KW, Greally JM: A pipeline for the
quantitative analysis of CG dinucleotide methylation using mass spectrometry. Bioinformatics 2009, 25:2164-2170.
39. Holm S: A simple sequentially rejective multiple test procedure. Scand J Stat 1979, 6:65-70.
40. Burdall SE, Hanby AM, Lansdown MR, Speirs V: Breast cancer cell lines: friend or foe? Breast Cancer Res 2003, 5:89-95.
41. Guy CT, Cardiff RD, Muller WJ: Induction of mammary tumors by expression of polyomavirus middle T oncogene: a transgenic mouse model for metastatic disease. Mol Cell Biol 1992, 12:954-961. 42. Kinoshita M, Field CM, Coughlin ML, Straight AF, Mitchison TJ: Self- and
actin-templated assembly of mammalian septins. Dev Cell 2002, 3:791-802.
43. Hall PA, Todd CB, Hyland PL, McDade SS, Grabsch H, Dattani M, Hillan KJ, Russell SE: The septin-binding protein anillin is overexpressed in diverse human tumors. Clin Cancer Res 2005, 11:6780-6786.
44. Makhnevych T, Ptak C, Lusk CP, Aitchison JD, Wozniak RW: The role of karyopherins in the regulated sumoylation of septins. J Cell Biol 2007, 177:39-49.
45. Kremer BE, Adang LA, Macara IG: Septins regulate actin organization and cell-cycle arrest through nuclear accumulation of NCK mediated by SOCS7. Cell 2007, 130:837-850.
46. deVos T, Tetzner R, Model F, Weiss G, Schuster M, Distler J, Steiger KV, Grützmann R, Pilarsky C, Habermann JK, Fleshner PR, Oubre BM, Day R, Sledziewski AZ, Lofton-Day C: Circulating methylated SEPT9 DNA in plasma is a biomarker for colorectal cancer. Clin Chem 2009, 55:1337-1346.
47. Maunakea AK, Nagarajan RP, Bilenky M, Ballinger TJ, D’Souza C, Fouse SD, Johnson BE, Hong C, Nielsen C, Zhao Y, Turecki G, Delaney A, Varhol R, Thiessen N, Shchors K, Heine VM, Rowitch DH, Xing X, Fiore C, Schillebeeckx M, Jones SJ, Haussler D, Marra MA, Hirst M, Wang T, Costello JF: Conserved role of intragenic DNA methylation in regulating alternative promoters. Nature 2010, 466:253-257.
48. McDade SS, Hall PA, Russell SE: Translational control of SEPT9 isoforms is perturbed in disease. Hum Mol Genet 2007, 16:742-752.
49. Gonzalez ME, Makarova O, Peterson EA, Privette LM, Petty EM: Up-regulation of SEPT9_v1 stabilizes c-Jun-N-terminal kinase and contributes to its pro-proliferative activity in mammary epithelial cells. Cell Signal 2009, 21:477-487.
50. Surka MC, Tsang CW, Trimble WS: The mammalian septin MSF localizes with microtubules and is required for completion of cytokinesis. Mol Biol Cell 2002, 13:3532-3545.
51. Shankar J, Messenberg A, Chan J, Underhill TM, Foster LJ, Nabi IR: Pseudopodial actin dynamics control epithelial-mesenchymal transition in metastatic cancer cells. Cancer Res 2010, 70:3780-3790.
doi:10.1186/bcr2924
Cite this article as: Connolly et al.: Septin 9 isoform expression, localization and epigenetic changes during human and mouse breast cancer progression. Breast Cancer Research 2011 13:R76.
Submit your next manuscript to BioMed Central and take full advantage of:
• Convenient online submission
• Thorough peer review
• No space constraints or color figure charges
• Immediate publication on acceptance
• Inclusion in PubMed, CAS, Scopus and Google Scholar
• Research which is freely available for redistribution
Submit your manuscript at www.biomedcentral.com/submit