Publisher’s version / Version de l'éditeur:
Vous avez des questions? Nous pouvons vous aider. Pour communiquer directement avec un auteur, consultez la première page de la revue dans laquelle son article a été publié afin de trouver ses coordonnées. Si vous n’arrivez Questions? Contact the NRC Publications Archive team at
[email protected]. If you wish to email the authors directly, please see the first page of the publication for their contact information.
https://publications-cnrc.canada.ca/fra/droits
L’accès à ce site Web et l’utilisation de son contenu sont assujettis aux conditions présentées dans le site LISEZ CES CONDITIONS ATTENTIVEMENT AVANT D’UTILISER CE SITE WEB.
8th International Conference and Exhibition on Performance of Ships and
Structures in Ice [Proceedings], 2008
READ THESE TERMS AND CONDITIONS CAREFULLY BEFORE USING THIS WEBSITE.
https://nrc-publications.canada.ca/eng/copyright
NRC Publications Archive Record / Notice des Archives des publications du CNRC :
https://nrc-publications.canada.ca/eng/view/object/?id=7d0e4c4d-1c9c-427e-b6c7-770297f6f5a2
https://publications-cnrc.canada.ca/fra/voir/objet/?id=7d0e4c4d-1c9c-427e-b6c7-770297f6f5a2
NRC Publications Archive
Archives des publications du CNRC
This publication could be one of several versions: author’s original, accepted manuscript or the publisher’s version. / La version de cette publication peut être l’une des suivantes : la version prépublication de l’auteur, la version acceptée du manuscrit ou la version de l’éditeur.
Access and use of this website and the material on it are subject to the Terms and Conditions set forth at
Historical data added to the Grand Banks Iceberg Database
Historical Data added to the Grand Banks Iceberg Database
Brian T. Hill
NRC – Institute for Ocean Technology St. John’s, Newfoundland & Labrador, Canada
Alan Ruffman
Geomarine Associates Ltd. Halifax, Nova Scotia, Canada
Kilah Ivany
NRC – Institute for Ocean Technology St. John’s, Newfoundland & Labrador, Canada
ABSTRACT
The Grand Banks Icebergs Database has been augmented recently by all the available iceberg data from the International Ice Patrol (IIP) annual bulletins prior to 1960. Transcription of all the iceberg records from the Hydrographic Bulletin (HB) of the U.S. Hydrographic Service is also underway. This weekly bulletin was published from 1889 until 1954, although only data from the 1920s have been transcribed so far. Trends in iceberg reporting in relation to those of the International Ice Patrol are discussed, along with trends in iceberg numbers which show a sharp decline after many years of high numbers.
KEY WORDS: Icebergs; Grand Banks; North Atlantic.
INTRODUCTION
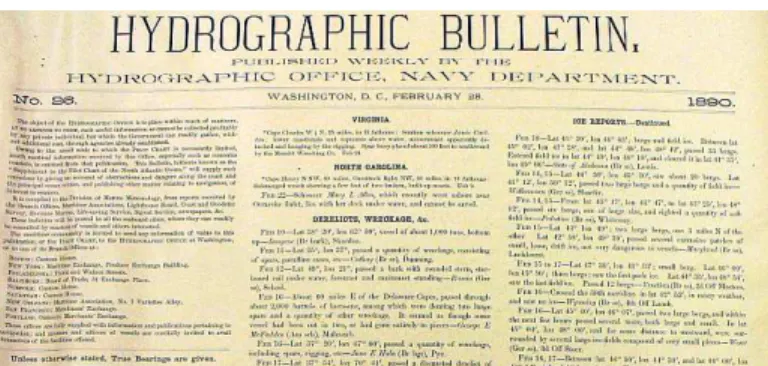
The Institute for Ocean Technology (IOT) has been a major contributor to the PERD (Program for Energy Research and Development) Grand Banks Iceberg Database with some 96,000 records recently added. The focus has been on transcribing historical pre-1960 data which precede those of the modern electronic era. This was the original target of the sightings database. The greater part of the data from the modern era are from the International Ice Patrol (IIP) which was established in 1914, following the sinking of the Titanic in 1912. The bulk of the current historical record is also drawn from the IIP, and the data from all of its annual bulletins have now been transcribed. The IIP annual count of icebergs in northwestern Atlantic waters drifting south of 48°N (hence into the trans-Atlantic shipping lanes) estimated back to 1900 has been widely accepted, and is regarded as an index of iceberg severity in the North Atlantic. However, the IIP is not the only source of historical data. There are other contemporary serial publications that contain much valuable supplementary information, for example, the New York Maritime Register. Of particular value, however, are the hard-to-find Hydrographic Bulletins of the U.S. Hydrographic Office, at the National Archives at College Park, Maryland. These were recently located and photographed by the authors. This weekly bulletin (Figure 1), a single sheet of one sided newsprint whose size varied according to the amount of material printed, was published from 1889 until 1954.
Figure 1. Example of an early issue of the Hydrographic Bulletin They are a mine of information regarding hazards to navigation and other unusual events at sea such as those of waterspouts and rogue waves, but in particular, of ice and icebergs. These ice reports are very detailed and normally include: the date of the sighting, and sometimes the time; the name of the vessel or light station reporting; the latitude and longitude of the observation; the kind of ice; and, in the case of icebergs, the number, and often the size as to whether small, medium, large, very large or an ice island. Occasionally the estimated height and length of the berg, sometimes measured by theodolite, is also included. While work on transcribing these data has only just begun, (10 years out of the 59 collected from 1889 to 1947 so far out of a collection of over 4,500 digital images), it is evident that they will considerably augment the IIP data.
Although the IIP commenced its annual reports in 1914, it was not until 1923 that the issues contained a tabularized summary of ice reports from transiting vessels and its own patrols. These summaries include the same kind of information described above in the HBs but sometimes with the additional information if the berg has been identified from a previous sighting as a “re-sight”. Issues earlier than 1923 gave a brief descriptive summary by month, normally only giving specific ice or iceberg information for the geographical limits or some of the more remarkable sightings. The plots and tables showing the IIP’s monthly and annual iceberg counts go back to 1900, before the
actual inauguration of its patrols in 1914. According to the IIP, the iceberg data for these early years was reconstructed from mariners’ reports to the Hydrographic Office; essentially the same information as is found in the HBs.
The 1920s issues of the HB were selected for transcription and analysis first principally for the reason that they covered the period when the IIP matured into being the prime ice-reporting agency. Also, the sea-ice extent record of sea ice over the Grand Banks from 1860 (Hill and Jones, 1988), and later extended to 1820 (Hill, 1998), showed a sudden amelioration in the early 1920s, after a 40 year stretch of varying but unusual severity, and we wished to see if this could also be identified in the iceberg record.
The ice reports from the HBs for the 1920s (10 years) contained over 13,500 iceberg observations of which almost 9,300 were new data. It will be demonstrated that these can supplement those from the IIP and that they can thus be used to extend the monthly and annual counts back to the time of their first publication in 1889. It is hoped that eventually, with the use of other sources such as the New York Maritime Register and the Monthly Weather Review that the time series can be extended back to at least the pre-1870s.
DATA FORMAT AND CHECKING
The iceberg sightings were entered into a spreadsheet using the existing Grand Banks Iceberg Database template as a guide, in order that incorporating the spreadsheets into the database could be fairly readily accomplished. These data fields conform to the basic details described above and include: Data Source (e.g. IOT, IIP); ID#; Re-sight (Yes, No), Sighting Source (e.g. Ship, Aircraft); Sighting Method (Visual, Radar); Latitude; Longitude; Size, Shape and Dimensions. However, there were certain other elements pertaining to the historical nature of the sightings that were regarded as worth recording. These in particular were the names of the reporting vessels, and any other relevant information that was reported, such as ice fields and drift speed as well as references as to where this information was found. As different source material was used in compiling the data, such information could be helpful in deciding if the same iceberg was being reported in different sources or was an original sighting. The vessel name was also useful in helping to track the movements of that ship, either on a particular voyage, or over a number of voyages or years. Since this additional information did not conform to the existing database template it had to be excluded but it is hoped that these original spreadsheets will soon be made available (see www.icedata.ca). Latitudes and longitudes were normally given for each sighting but occasionally they had to be calculated if the distance and direction were given from some reference point.
The IIP data by year has been transcribed to electronic format already. When sightings from the HBs data were added the file was checked to see if the sighting was original or not. If the sighting was new it was simply appended to the file. If not, then a reference was added to the original IIP entry. Occasionally, the HB added further data as to the size or dimension of the berg or perhaps the name of the vessel reporting. Once all the data from the HBs had been added, the file was checked for duplicate entries by sorting the data according to latitude, longitude or date, then visually scanning the data. Duplicate entries were deleted (occasionally found within the IIP data itself) and re-sights identified if there was a sufficient likelihood. Typographical errors in the source material were abundant, particularly for dates, latitudes and longitudes, and sometimes in the number of bergs. If it was obvious that the same sighting was reported in an HB in a different manner then we used best judgment to eliminate the duplicate sighting,
perhaps based on other data from the vessel, and a comment was added to the entry. Difficulties in deciding whether a report was an original, a duplicate or a re-sight could be compounded if the name of the vessel was unknown and dates were different. If dates were out by a day or so and were consistently so for a number of sightings, then a pattern could be detected and the duplicate records deleted. Often there was no way of deciding if similar observations were one and the same, so it is likely that the files do contain a number of re-sights. This also applies to the IIP data, and estimates by the IIP assess the actual number of bergs at about half of those reported (Murphy, 2008).
As a final check on the data, the iceberg locations were plotted on a background map of the area. The high resolution Google Earth proved excellent for this purpose. A software routine was compiled that displayed the positions on Google Earth and by clicking on the point the iceberg ID number and details were displayed. Any suspicious sighting such as those lying on land could then be checked against its reference. If possible, the coordinates were corrected, and if not, the entry was deleted.
DISCUSSION
Number of Iceberg Sightings
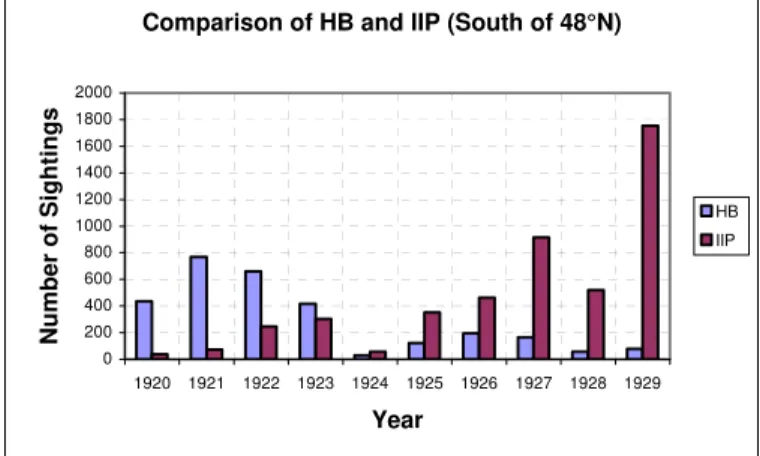
The IIP annual count of icebergs south of 48°N since 1900 is well established and is an excellent indicator of ice severity in the North Atlantic. Having now added information from the HB for the 1920s the first thing that was done was to see how much value was added by these data. Figure 2 shows the number of sightings south of 48° based
Comparison of HB and IIP (South of 48°N)
0 200 400 600 800 1000 1200 1400 1600 1800 2000 1920 1921 1922 1923 1924 1925 1926 1927 1928 1929 Year Number of Sightings HB IIP
Figure 2. Trends in unique sightings reported by the Hydrographic Bulletin and the International Ice Patrol south of 48°N.
on the data published in the IIP annual reports (in red) together with the new additional sightings (not recorded by the IIP) from the HBs (in blue). Note that the number of “sightings” when used here are the number of iceberg reports, where one report may refer to more than one iceberg. For example, a report of three bergs at one location would be recorded as one sighting, and a report of several large and small bergs and some growlers would be recorded as three sightings (one for each ice type). The trends show that for the early part of the decade the HB was recording more information than was being reported in the IIP annual reports. The IIP began summarizing ice reports in a formatted tabular form in 1923. 1924 was a very light year but the IIP was becoming more thorough in its reporting, and by the end of the decade, the contribution of new reports from the HBs was very small. It is worth noting that the ice reports in the weekly bulletin were often quite lengthy and that rarely were observations captured by the IIP that were not noted by the HB.
Comparison of HB and IIP (All entries) 0 500 1000 1500 2000 2500 1920 1921 1922 1923 1924 1925 1926 1927 1928 1929 Year Number of sightings HB IIP
Figure 3. Trends in unique sightings reported by the Hydrographic Bulletin and the International Ice Patrol for areas north and south of 48°N.
Figure 3 shows the trends in all ice observations from above and below 48°N, the main difference being that this includes vessel traffic through the Strait of Belle Isle, the waterway between the island of Newfoundland and mainland Labrador. During winter, ice makes this unnavigable, eventually clearing out about June depending on the season. The IIP’s vessel patrols normally finished their season in June or July once the iceberg threat in the trans-Atlantic shipping lanes south of 48°N was largely over. After that time they relied on information being passed to them from transiting ships. The trends in Figure 3 are slightly different in that it was not until much later in the decade that the IIP became more proficient in its reporting of ice throughout the whole iceberg area. The facts that the Strait lies in territorial, not international waters, and that the HB regularly reported from Canadian Signal Service lighthouses in the Strait are also noteworthy. As an example, Figure 4 shows an iceberg chart for 1923 showing the iceberg sightings as in the IIP report for that year, together with the additional sightings as reported in other sources, mainly the HB. The clustering of sightings along the standard shipping routes is evident, as is the weighting of HB data in the northerly Strait of Belle Isle, open summer to fall.
Figure 4. Chart showing the iceberg sightings from the IIP (red) and from other sources (blue) for 1923.
Comparison of HB and IIP data August to December (South of 48°N) 0 10 20 30 40 50 60 70 80 90 100 1920 1921 1922 1923 1924 1925 1926 1927 1928 1929 Year Number of Sightings HB IIP
Figure 5. Trends in unique sightings of late season icebergs reported by the HB and IIP during the 1920s for the area south of 48°N.
Since the IIP concluded their patrols in June or July as the iceberg threat lessened in the trans-Atlantic shipping lanes, it was of interest to see how many icebergs were still being reported by the HB compared to those in the IIP reports. These are summarized in Figure 5 for the area south of 48° and it is apparent that late season bergs were not being uniquely recorded by the IIP (i.e. only reported by the IIP, and not the HB), at least in their annual reports, until 1929. This does help to highlight the usefulness of the HB in being able to improve the data set for these early IIP years. However, although not reported in their annual reports, the IIP did make estimates for iceberg numbers for the latter part of the year based on mariners’ observations to the Hydrographic Service, so it was of interest to see how well these numbers agreed with what was reported in the HB. This is shown in Figure 6. For most part, the agreement is very good, the exceptions being 1922 and 1923, with iceberg numbers from all sources almost doubling the IIP estimate for 1922 to almost 6 times for 1923. Not knowing exactly how the IIP iceberg numbers were derived, there is no ready explanation why the numbers should be so different although it does highlight some of the differences of working with older documents where one report may for example, just say “berg” and another “bergs”. For 1929, though the total numbers agree at 31, there were actually some bergs reported by one but not the other.
Comparison of the IIP number of late season icebergs with those from all sources (south of
48°N) 0 20 40 60 80 100 120 1920 1921 1922 1923 1924 1925 1926 1927 1928 1929 Year Number of Bergs IIP All Data
Figure 6. Trends in late season iceberg numbers as reported by the IIP and numbers derived from all sources for the area south of 48°N`.
Incidence of Icebergs and Sea-Ice off Eastern Canada 0 20 40 60 80 100 120 140 160 180 1900 1910 1920 1930 1940 1950 1960 1970 1980 1990 2000 Year # of Sightings 0 50000 100000 150000 200000 250000 300000 350000 400000 Ice ext e nt area ( k m^ 2)
# of Sightings from Aug - Dec 5 per. Mov. Avg. (Sea Ice)
Figure 7. Comparison of fall iceberg count, August to December and winter sea-ice extent, January to April (5 year average).
The overall trend illustrated in Figure 6 shows a significant number of late season bergs at the start of the decade, 1920-22, falling rapidly to none in 1924 and 1925 with only a gradual rise in numbers towards the end of the decade. These days, in the 21st century, having no icebergs around in the fall appears to be the norm, so using IIP iceberg numbers Figure 7 shows the number of late season icebergs south of 48°N, August to December, from 1900, as well as the average winter sea-ice extent, January to April, south of 55°N (updated from Hill, 1998) in the waters east of Canada. The trends of iceberg numbers and sea-ice extent follow each other reasonably well, both showing gradual but fluctuating declines from the early 1920s to the early 1970s when conditions worsened again for the next twenty years or so, but were highly variable. The sudden shift in atmospheric and ocean conditions in the 1920s have been noted by several authors, (see, for example, Rogers,1985; Deser and Blackmon, 1993). Drinkwater (2006) argues that the dramatic warming in the North Atlantic at that time, as increased southerly winds pumped heat into the higher latitudes, was also responsible for a widespread shift in the marine ecosystem. This shift lasted for 30 – 40 years, with a return to the previous state in the 1960s, the timing varying slightly and spatially across the North Atlantic. Such changes are demonstrated well in the sea-ice and iceberg record as shown in Figure 7 and the response of ice conditions to a changing environment makes it an excellent indicator. The longer and more accurate we can make the ice record then the more valuable it will be.
Ice Islands
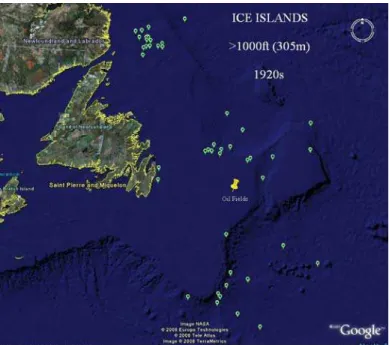
Berg dimensions are not often given in the IIP annual reports, or the HBs, but it is our experience so far that more are given in the HBs. An interesting aspect of this is that it helps to identify the more unusual “ice islands”; in modern nomenclature these are normally taken to mean large relatively flat icebergs that have broken off large Greenland glaciers that terminate in the sea, or have separated from the ice shelves of northern Ellesmere Island. Although sometimes not identified as such in the HBs, any large iceberg longer than 1000 feet has been classed by us as an ice island. Figure 8 shows the number of these attributed to each year of the 1920s from all sources, principally the HB with a few from the IIP, and Newell (1993) who collated data from a number of sources. The decline in numbers of ice islands through the early years of the decade can be credited to the general decline in iceberg numbers but it suggests that the unusually high number of reports in 1928 is an anomaly. Perhaps this can be attributed to the Arctic warming that had already begun and the partial break up of one of the ice shelves, not too dissimilar to the recent calving of the Ayles
Ice Islands 0 5 10 15 20 25 30 1920 1921 1922 1923 1924 1925 1926 1927 1928 1929 Year Number of
Ice Island Report
e
d
Figure 8: Number of Ice Island reported through the 1920s from all sources
Ice Shelf in August 2005, or perhaps pieces had already calved but were ice jammed in the narrow waterways between Greenland and Ellesmere Island until the warming trend released them. When all ice reports from the HBs have been transcribed and analyzed it will be interesting to see if there have been other years with similar anomalies of ice island reports.
Figure 9. Ice Island locations as reported during the 1920s from all sources, whose lengths were 1000 feet (305 m) or greater (one off the map in 62°N).
The spatial distribution of the ice islands as reported during the 1920s from all sources is shown in Figure 9. The clustering of reports illustrates the typical routes taken by transiting vessels through the Strait of Belle Isle to the north of the island of Newfoundland, or round Cape Race to the south and thence up the St. Lawrence, or by the Tail of the Grand Banks for ports on the eastern seaboard. The absence of reports between the clusters indicates the absence of vessels, or at least of reporting vessels, rather than the absence of ice islands as obviously they have to drift through those empty areas to reach the more southerly locations. The approximate position of the currently producing oil fields is also indicated. The largest ice island reported
Figure 10. The drift positions of ice islands recorded during 1928. The yellow line indicates a distance of 300 nautical miles.
during this decade was one of 6½ [nautical] miles in length and 100 feet high (12.0 km by 30.5 m) in 1928 (Newell, 1993) in latitude 52°N, longitude unknown, cited from Hennessy (1932). Most ice islands are considerable smaller and lie in the range of 300 m to 1 km long, but even a 300 m long 30 m high ice island will have a mass of approximately 20 million tons.
Newell (1998) lists five sightings for the 1920s, all for 1928, whereas using the same criterion for length, 42 were found in the HBs (five more were described as ice islands without any lengths given) including 22 for 1928 (four without lengths). All the sightings for 1928 are shown in Figure 10, colour coded by month. No attempt has been made yet to try and identify what are likely re-sights or individual ice islands in either Figure 9 or 10. However, a fairly clear idea of ice island drift is given in Figure 10, as the cluster of sightings moves south month-by-month with the two month September – October gap being the time to drift down from the shipping route through the Strait of Belle Island to that around Cape Race at the southeast corner of Newfoundland. This is a distance of about 300 nautical miles which is thus covered at an average rate of approximately 0.15 knots, or 8 cm/s. The most southerly ice island report for this year was 47°03'N 46°50'W, approximately 30 miles further south than reported by Newell, and the most southerly for the decade is in 41°26'N 47°20'W, reported twice on 21 May 1920 (or perhaps rather unlikely two separate ice islands) with dimensions varying between 1000 and 1500 feet long and 150 to 400 feet high. This is almost a degree and half further south than the most southerly ice island, 1000 feet long by 275 feet high, previously identified (42°50'N 49°30'W in May 1959) (Newell, 1993). Unusual Iceberg Locations: fact or fiction?
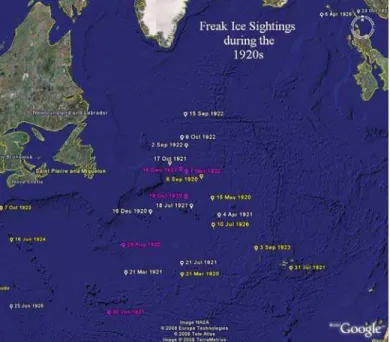
Over the years, ice has been reported in some unusual locations throughout the North Atlantic such as on or near the shores of Scotland, the Azores and Bermuda. Lists of these unusual sightings of freak ice have been compiled and can be found in a number of sources sharing much the same information. A chart displaying some of these is available on IIP’s web site and the list we discuss here was published by Hennesy (1932) which credits the U.S. Hydrographic Bulletin for
several reports, and is probably the basis for most other compilations. The veracity of such sightings has long been of interest to the authors. Could the observers have been mistaken in what they thought they saw, or was there indeed some unusually large piece of ice which, under the circumstances of winds and currents could have been driven to those peculiar locations before melting? Such a piece of glacial ice did not suddenly show up at the unusually southern latitude. Rather it had a months-long slow drift to that location. Given the amount of shipping in those days one might expect a number of observations throughout its drift life, though as we have seen in Figures 9 and 10 it could be possible for a piece of ice to vanish into a black hole between shipping lanes and thus go undetected for a long time. One is also reliant, of course, on the sighting information being properly reported. Having now established a relatively thorough record of ice sightings throughout the 1920s, each freak ice report, 25 in all, was checked against the records in the database and is discussed below.
1920. 21 March, a growler 30' long by 3' high in 38°02'N 40°38'W
The sighting was recorded in both the HB No. 1595 March 30, and the New York Maritime Register from an unnamed ship. It is 5° further south than any other ice sighting for the month. The position cannot be disproved but there was an iceberg sighted on the 13th of March in 48°52'N 41°31'W and it is easier to imagine the growler as a remnant of this berg and a latitudinal typographical error for 48°02'N than one so far south.
1920. 15 May, a berg sighted by an unnamed ship in 45°11'N 36°42'W
in HB No. 1604 June 2. This longitude was 6° further to the east than any other sighting for the month. At this latitude there are several bergs in 46°W so it very likely that this was a longitudinal typographical error for 46°42'W.
1920. 29 August, according to HB No.1620 September 22, a berg in
40°30'N 47°52'W which is 5° further south than the closest berg which is, in fact according to HB 1619 September 15, a berg exactly on 45°30'N 47°52'W on the same date, so this freak ice sighting is almost certainly a latitudinal typographical error.
1920. 6 September, according to HB No.1620 September 22, bergs in
47°10'N 38°04'W and also in the same position on the date of 30 August in HB No.1619 September 15. It is hard to imagine a berg, or bergs being in this same exact location a week later and they are suspected to be the one and the same report. For this latitude at this time of year the sighting is 10°-12° further east, depending on whether it was in August or September, than any other ice. In fact, for this latitude there was a sighting on September 2 of a berg in 48°40'W (HB No.1619) and it is strongly suspected that the freak ice report was a corruption of this longitude.
1920. 19 October, one iceberg in 45°22'N 40°09'W and another in
45°24'N 40°07'W but not recorded until HB No.1631 December 8, as observed by unnamed ships. The positions are 5° further east than any other sighting for the month, and very far east for this time of year. Interestingly, there was another report of an iceberg on 19 October in 45°24'N 45°09'W in an earlier issue of the HB, No. 1626 November 3, also by an unnamed ship. The freak ice sighting is almost certainly a 5°longitudinal corruption of the originally recorded coordinates making it highly dubious.
.
1920. 16 December, a berg observed by the SS Oriana in 43°53'N
44°39'W. This sighting was evidently not reported in the HBs. It is about 3° further east than the nearest iceberg and likely a valid sighting.
Figure 11. Chart showing some of the extreme ice sightings during the 1920s as reported in some sources.
1921. 21 March, a berg in 37°50'N 47°23'W. This was observed by the
SS Hollandia. It was not reported in the HBs and though almost 4°
south of any other ice, it cannot be confirmed or contradicted by the current data.
1921. 4 April, large berg in 43°35'N 35°57'W. This was also observed
by the SS Hollandia but not recorded in the HBs. It is almost 5° east of any other ice in that latitude. The position is suspicious but there are no other data to deny or confirm it, nor to suggest what else it might be.
1921. 30 June, 10-feet-long growler in 33°20'N 49°16'W. In fact, this is
a latitudinal typographical error for a 10-foot-long iceberg reported on that day in HB No. 1662 July 13 by an unknown vessel in 43°20'N 49°16'W, 10° further to the north.
1921. 18 July, a small berg 15 feet long in 44°30'N 39°26'W
supposedly from a report in an HB but the authors have not yet found it. The location is about 8° further east than other ice in the same latitude, and though suspicious is not totally unreasonable.
1921. 21 July, a berg in 39°09'N 40°39'W. This is reported in HB
No.1668 August 24 which describes one berg about 60 feet high, and two small growlers about 15 and 20 feet.
1921. 31 July, a berg in 37°37'N 27°29'W supposedly also from an HB
but the authors have not yet found this one either. This is a very unusual location being off the Azores and is 12° further east and 2° further south than the next nearest reported ice which is itself in an unusually extreme position for that time of year. This location can only be viewed with suspicion.
1921. 17 October, a berg about 70 feet high and 400 feet long in
48°23'N 42°19'W observed by SS Mount Vernon. This sighting is about 4° further east than any other ice in this latitude and was also unrecorded by the HB but is not an unreasonable location.
1922. 2 September, a berg in 50°00'N 40°05'N observed by SS
Hallgjerd. Not reported by the HB but bergs did extend quite far east
that year, certainly to 49°N 43°W. See also next record.
1922. 15 September, a large berg in 52°52'N 40°12'W observed by SS
Empress of Britain. See previous record. Interestingly although this
observation is not recorded in the HB, two others are for September 6 showing the vessel taking the northerly route through the Strait of Belle Isle.
1922. 6 October, a berg 60 feet high observed by the SS Christian
Krogh in 50°43'N 40°42'W. For the month and latitude this sighting is
about 5° further east than any other ice though not dissimilar to the previous September sightings.
1922. 7 November, berg and growlers reported, or more correctly,
relayed by Cape Race Radio Station in 47°38'N 40°04'W, some 9° further east than any other ice in that latitude. There is no record of this in the HB and it is evidently meant to be a berg and two growlers reported on November 8 by the SS Canadian Carrier in 47°38'N 50°02'W in HB No.1733, November 22. This was clearly a 10° error in the longitude as relayed by Cape Race.
1923. 3 September, a 30 feet long piece of ice, 1½ feet high in 40°10'N
31°36’'W. This is listed in the HB number 1779 October 10 as reported by the SS Djambi and described as the most easternmost ice of the year. This location is almost 20° east of any other ice, the nearest being about 42°30'N 50°30'W, almost 1,000 miles away. It is almost impossible to believe ice could survive to nearly as far as the Azores in September waters and this sighting has to viewed as highly suspicious. Or could it be the remnant of the single ice island observed in 1923, half a mile long, not far from St. John’s on July 4?
1923. 7 October, a large growler 100 feet square in 40°46'N 65°54'W
was reported in HB No.1780 October 17 observed by the SS Eastern
Dawn. There are no other sightings close though there were some
bergs sighted in latitudes 42° - 43° longitudes 50° - 52°W in September and October which is quite far south for that time of year.
1924. 16 June, growler in 38°03'N 63°20'W recorded in HB No.1815 June 18 sighted by SS West Irmo. That the ship was likely in 38° and not 48° was confirmed by a report that the ship was at New York at about that time on a West African run. The nearest reported ice was off Cape Race which casts the authenticity of this sighting in doubt.
1926 & 1927. Long pieces of ice were reported off northern Scotland
on 16 April 1926 by the trawler Orizaba in 61°03'N 10°30'W, and also on 23 October 1927 by the trawler Grecian Empire in approximately 60°N 0°30'W (30 miles ESE of the Outer Skerries, Shetland Islands). They were not reported in the HBs but there seems no reason to doubt their authenticity.
1926. 25 June, growler observed by the SS Baxtergate. This record is
also mentioned briefly on the IIP web site as a notable extreme location for ice, being a growler at 30°20'N 62°32'W, about 150 nautical miles from Bermuda. This is an obvious candidate for suspicion but, in fact, it was reported in HB number 1928 August 18, and again with more complete details in number 1944 December 8 which, given the uniqueness of the locality as probably one of the most southerly and authenticated sightings in iceberg history, is for the record as follows: “June 25.-Lat.30°20', lon.62°32'W, at 11:30 a.m., passed close to a large piece of ice about 30 feet long and 15 feet wide, showing about 3 feet above water; temperature of sea water, 80°F.-Baxtergate (Br. SS.), Theaker; report by Second Officer Cox.”
“Note,-This is the most southerly position in which ice has been
reported sighted within the knowledge of the Hydrographic Office, and Captain Theaker further reports: “From the boat deck I sighted a white object four points on the starboard bow, and going to the bridge I consulted with the third officer as to the nature of the obstruction, which I thought must be the hull of a schooner, bottom up, never dreaming that ice would be in such a position. I therefore hauled over toward the object for a better view. When getting nearer we remarked to each other that it looked like ice, yet I could not imagine it in this latitude. I steamed so close to it that we saw small pieces breaking away from the main pieces. The sun was shining brightly, the water was very clear, and we could see the submerged part. There was not the least doubt that it was ice, for some of the small pieces were right alongside of the ship.” Chief Officer R.P. Granger and Second Officer G. Cox, who besides Captain Theaker worked the navigation, verified its position.”
There appears to be no reason at all to doubt this report
1926. 10 July, two pieces of ice observed by the SS Chelatros in
42°42'N 36°45'W and reported in HB No.1924, July 21. It is difficult to accept this as authentic as it 12° further east and ½° further south than any known ice. If it was in 46°W that would be more sensible but that cannot be demonstrated.
1927. 16 December, four large bergs observed by SS Ascania in
47°52'N 40°50'W. This location is almost impossible to accept as there were no iceberg sightings recorded south of 50° since August.
The locations of these 25 freak ice sightings are plotted in Figure 11. Based on information given in the HBs, five of those that are shown to be typographical errors or so remote from any other observation as to be unreasonable are shown in red; eight that remain suspicious due to their locality and remoteness from any other ice sightings but remain plausible are shown in yellow; the remaining 12, shown in white, are sightings which are either confirmed by records in the HB, or given the ice conditions at the time, are not unreasonable. Some sightings reported by Hennessy have not been supported by reports in the HBs. Many of the ice reports to the US Hydrographic Office that were recorded in the bulletins were from east – west vessel traffic entering North American waters. It is likely that Hennessy, Senior Nautical Assistant of the Marine Division writing for the Marine Observer of the British Meteorological Office had access to additional material.
CONCLUSIONS
All iceberg reports for the decade of the 1920s from the Hydrographic Bulletins of the US Hydrographic Office have been transcribed into spreadsheets ready for inclusion in the Grand Banks Sightings Database. These records considerably enhance the International Ice Patrol records already transcribed by adding nearly 9,300 new observations and some details for about 4,000 others. Analysis of the numbers show this is particularly so for the early parts of the decade before the IIP began publishing data in tabularized format in their annual bulletins. This emphasizes the significance of the HBs in being able to extend the iceberg record for pre-IIP years. The HBs also capture more late season iceberg reports after the IIP surface patrols have ended for the season. The combined reports show a sudden decline in iceberg numbers during the 1920s and this can be attributed to an apparent sudden and well documented climatic shift which lasted for the next 40 years. Reports in the HBs often include iceberg dimensions and that has proven very useful in identifying the large ice islands, sometimes kilometers long. Despite the amelioration of ice conditions in the mid and late 1920s, there were unusually large
numbers of ice islands in 1928 and these are thought to be caused by the recent climatic shift and the warming of the Arctic temperatures either causing some break up of portions of ice shelves or freeing the pieces from frozen confinement in the narrow waterways further north. These ice islands, perhaps weighing over 20 million tons are shown to have crossed the Grand Banks at drift speeds of 0.15 knots. Finally, the HBs can be used to help verify, correct, and even contradict extreme reported ice sightings in the North Atlantic some of which were proved false.
The Hydrographic Bulletins are thus a valuable addition to the iceberg record already established by the IIP. Work will continue with transcribing the data from the pre-1920 bulletins and perhaps less importantly now, with the post-1929 data. The extended iceberg record, perhaps back to the pre-1870s, will provide a greater understanding of ice and climate variability over the Grand Banks environs, a matter of importance not just to the marine and oil industries, but also to ecologists and other scientists for the understanding of shifting marine ecosystems and migrations, and the impact that has on the various species, including humankind, that depend on them.
ACKNOWLEDGEMENTS
Many Memorial University of Newfoundland engineering work term students and Women In Science and Engineering, Newfoundland Chapter, students have worked on this project over the years. For this aspect of the project we would particularly like to thank work term students Chelsea Kavanagh, Jeff Brown and Surrey Lane. Thanks also to colleague Wayne Pearson for providing very useful software routines utilizing Google Earth. We acknowledge the friendly assistance by the staff at the National Archives at College Park, Maryland, who helped prepare the way for our arrival and ensured that our time there was spent as efficiently as possible. This work was funded in part by National Science Foundation grant 0629500 administered by INSTAAR at the University of Colorado.
REFERENCES
Drinkwater, K.F., “The Regime Shift of the 1920s and 1930s in the North Atlantic”, Progress in Oceanography Vol.68, pp.134-151
www.sciencedirect.com. 2006.
Deser, C., and Blackmon, M.L., “Surface Climate Variations over the North Atlantic Ocean during Winter: 1900-1989” Journal of
Climate, Vol.6, No.9 pp.1743-1753, 1993.
Hennessy, J., “Ice in the western Northern Atlantic”, Marine Observer,
Vol.9, pp.76-80. 1932.
Hill, B.T. Historical Record of Sea Ice and Iceberg Distribution around Newfoundland and Labrador, 1810 - 1958 Conference and Workshop of Arctic Climate Systems Study: Sea Ice Charts of the Arctic, Seattle, 1998. WMO/TD No. 949; IAPO Informal Report
N0. 3. IOT- LM-1998-02. http://www.icedata.ca/icedb/ice/
Hill, Brian T. and Jones, S.J. The Newfoundland Ice Extent and the Solar Cycle from 1860 to 1988. Journal of Geophysical Research,
Vol.95, No.C4 pp. 5385-5394.
International Ice Patrol (IIP) web site at:
www.uscg.mil/lantarea/iip/FAQ/FAQ_Icebergs.shtml
Murphy, D., International Ice Patrol, personal communication, 2008. Newell, J.P., “Exceptionally Large Icebergs and Ice Islands in Eastern
Canadian Waters: A review of Sightings from 1900 to Present”,
Arctic, Vol.46, No.3 pp. 205-211, September, 1993.
Rogers, J.C., “Atmospheric Circulation Changes Associated with the Warming over the Northern North Atlantic in the 1920s”, Journal